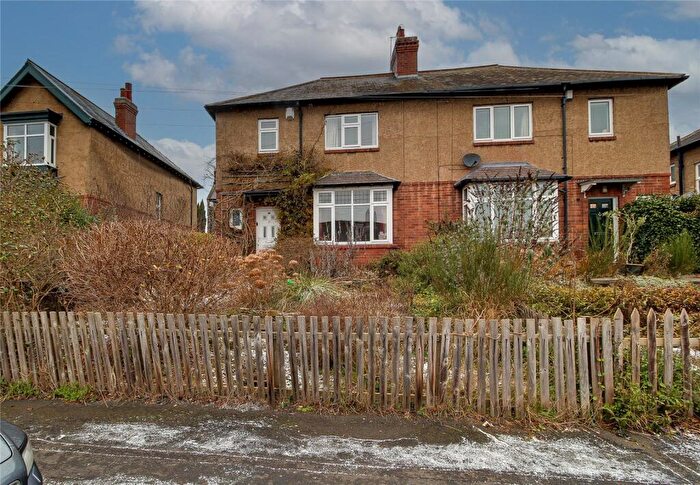
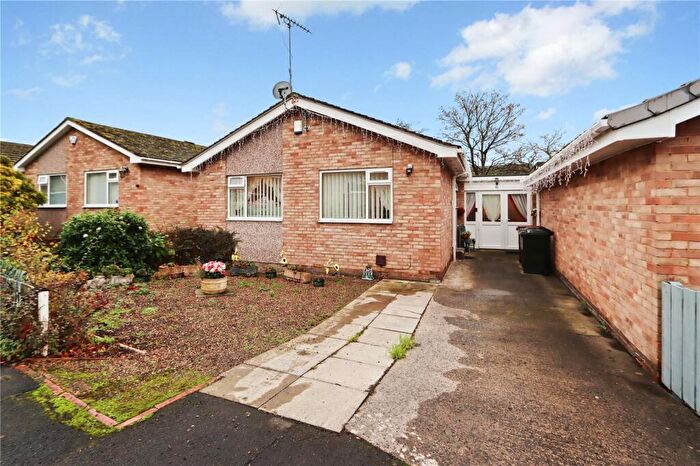
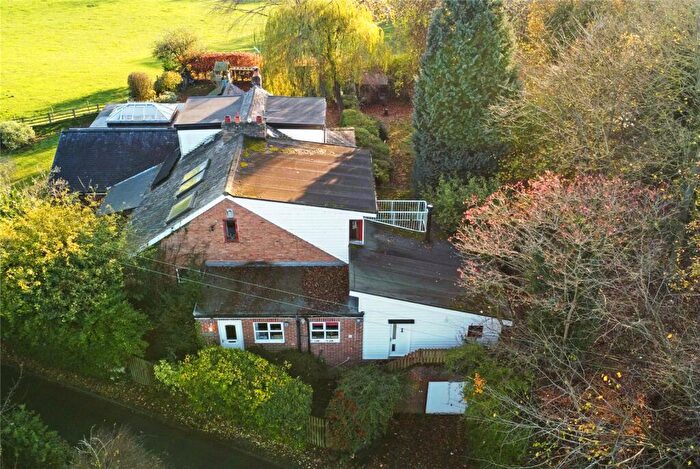
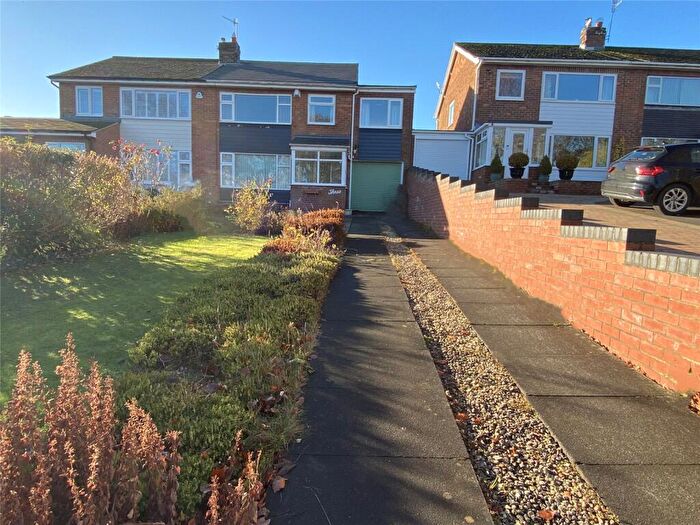
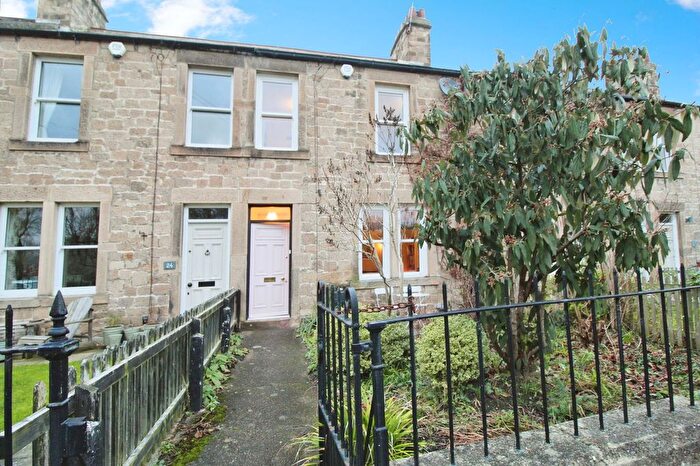
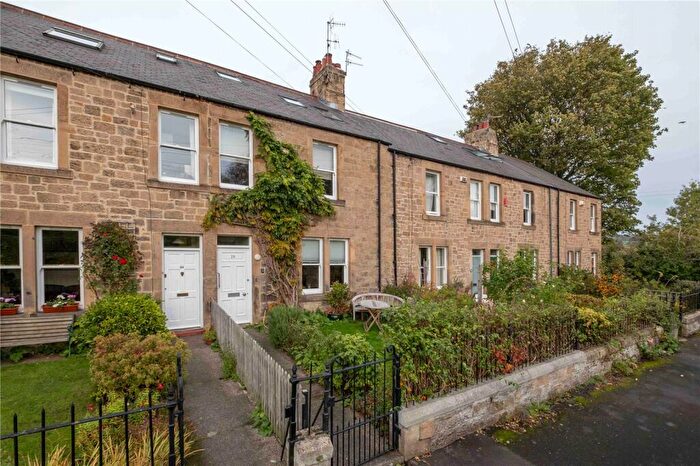
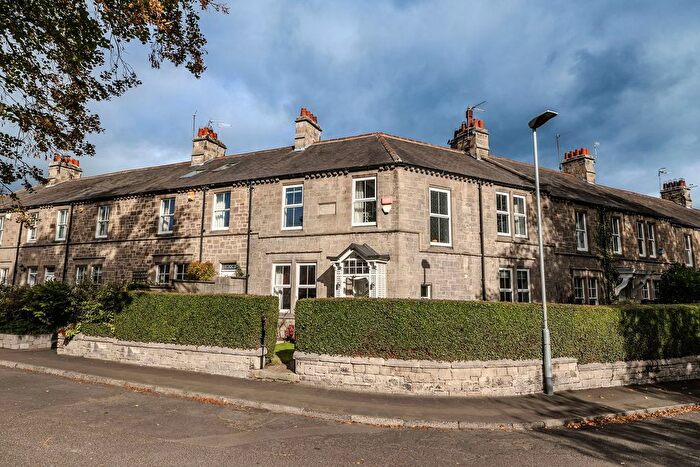
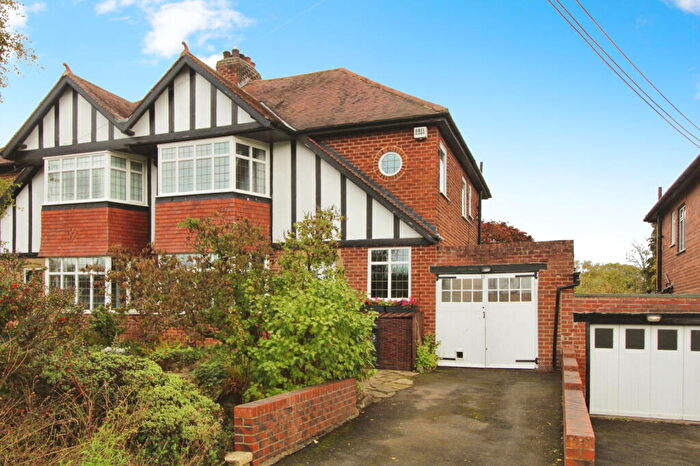
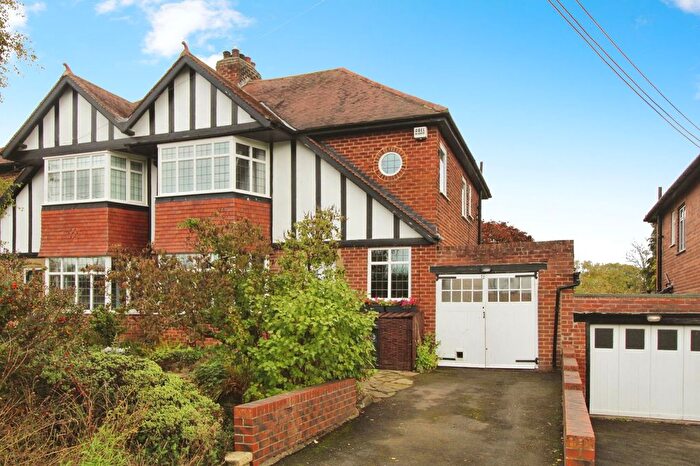
Houses for sale & to rent in Bywell, Wylam
House Prices in Bywell
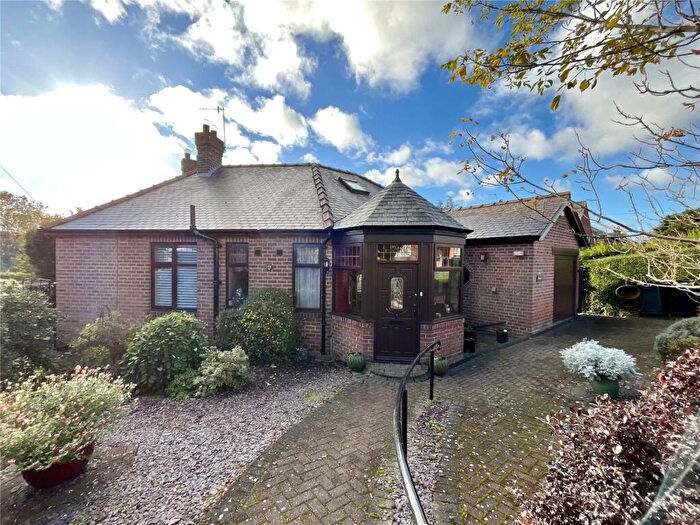
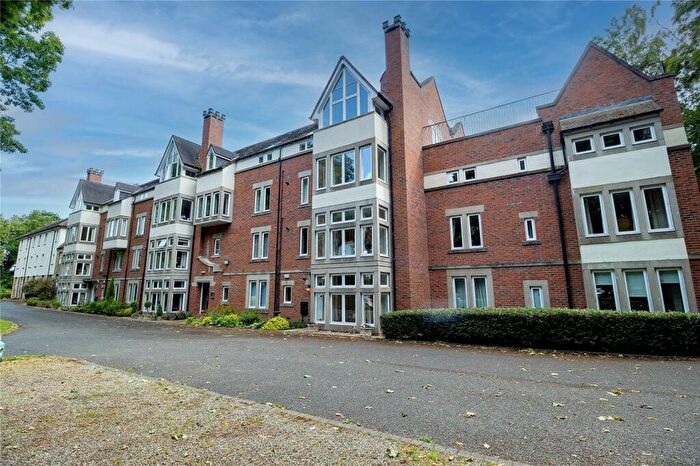
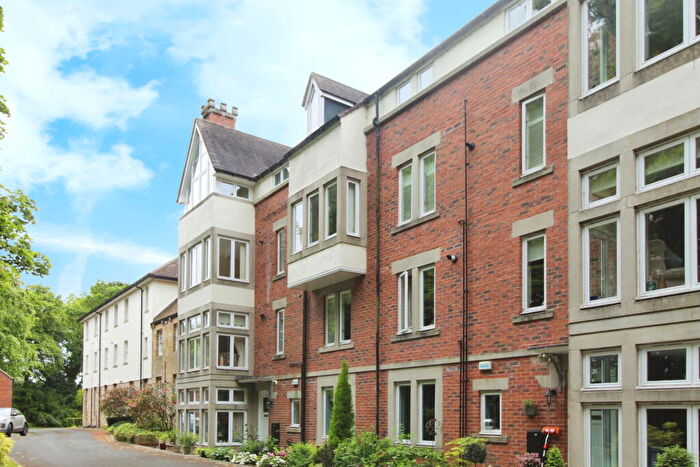
Properties in Bywell have an average house price of £376,857.00 and had 74 Property Transactions within the last 3 years¹.
Bywell is an area in Wylam, Northumberland with 820 households², where the most expensive property was sold for £1,100,000.00.
Properties for sale in Bywell
Previously listed properties in Bywell
Roads and Postcodes in Bywell
Navigate through our locations to find the location of your next house in Bywell, Wylam for sale or to rent.
| Streets | Postcodes |
|---|---|
| Acomb Drive | NE41 8BD |
| Algernon Terrace | NE41 8AQ NE41 8AX |
| Bell Road | NE41 8EH |
| Blackett Cottages | NE41 8AR |
| Blackett Court | NE41 8BT |
| Bluebell Close | NE41 8EU |
| Burgoyne Terrace | NE41 8AL |
| Chapel Lane | NE41 8AA NE41 8DF |
| Cherry Tree Lane | NE41 8AF |
| Church Road | NE41 8AP NE41 8AS NE41 8AT NE41 8AU |
| Dene Road | NE41 8EY NE41 8EZ NE41 8HA NE41 8HB |
| Dene Terrace East | NE41 8AY |
| Dene Terrace West | NE41 8AZ |
| Denecroft | NE41 8DE |
| Elm Bank Road | NE41 8HS NE41 8HT |
| Falcon Terrace | NE41 8EE |
| Florist Hall Cottages | NE41 8EP |
| Forster Gardens | NE41 8BF |
| Hackworth Gardens | NE41 8EJ |
| Hagg Bank | NE41 8JU |
| Hagg Bank Cottages | NE41 8JT |
| Hedley Road | NE41 8EF NE41 8EG |
| Holeyn Hall Road | NE41 8BB NE41 8BE NE41 8BQ NE41 8BG |
| Ingham Terrace | NE41 8DS |
| Jackson Road | NE41 8EL |
| Laburnum Terrace | NE41 8AH |
| Main Road | NE41 8AB NE41 8DL NE41 8DN |
| Oakwood Cottages | NE41 8BJ |
| Ovingham Road | NE41 8AW |
| Parson Road | NE41 8EQ |
| Railway Cottages | NE41 8JS |
| Rose Cottages | NE41 8DG |
| Rowe Lane | NE41 8DW |
| South View | NE41 8AG |
| Station Road | NE41 8JA NE41 8HR |
| Stephenson Court | NE41 8LA |
| Stephenson Terrace | NE41 8DZ |
| Street Houses | NE41 8BW |
| Swindale Cottages | NE41 8HD |
| The Crescent | NE41 8HU |
| The Dene | NE41 8EN NE41 8EW |
| The Orchard | NE41 8BS |
| Thomas Close | NE41 8BN |
| Tyne View | NE41 8DU |
| Tynedale Close | NE41 8EX |
| West View | NE41 8DT |
| Woodcroft Road | NE41 8DH NE41 8DJ NE41 8DQ |
| Woodvale Gardens | NE41 8ER NE41 8ES |
| Wylam Hills Farm Cottages | NE41 8BA |
| Wylam Wood Road | NE41 8HX NE41 8HZ NE41 8JR |
| NE41 8AJ NE41 8AN NE41 8BH NE41 8BL NE41 8DP NE41 8DX NE41 8EB NE41 8AD NE41 8BP NE41 8ED NE41 8ET NE41 8HP |
Transport near Bywell
- FAQ
- Price Paid By Year
- Property Type Price
Frequently asked questions about Bywell
What is the average price for a property for sale in Bywell?
The average price for a property for sale in Bywell is £376,857. There are 161 property listings for sale in Bywell.
What streets have the most expensive properties for sale in Bywell?
The streets with the most expensive properties for sale in Bywell are Holeyn Hall Road at an average of £775,850, Elm Bank Road at an average of £767,500 and Wylam Wood Road at an average of £762,500.
What streets have the most affordable properties for sale in Bywell?
The streets with the most affordable properties for sale in Bywell are Stephenson Court at an average of £166,000, Jackson Road at an average of £175,000 and Tyne View at an average of £195,000.
Which train stations are available in or near Bywell?
Some of the train stations available in or near Bywell are Wylam, Prudhoe and Stocksfield.
Property Price Paid in Bywell by Year
The average sold property price by year was:
| Year | Average Sold Price | Price Change |
Sold Properties
|
|---|---|---|---|
| 2025 | £404,960 | 10% |
20 Properties |
| 2024 | £362,731 | -2% |
27 Properties |
| 2023 | £370,166 | -28% |
27 Properties |
| 2022 | £474,151 | 37% |
30 Properties |
| 2021 | £299,492 | -2% |
32 Properties |
| 2020 | £304,763 | 6% |
19 Properties |
| 2019 | £286,973 | -11% |
34 Properties |
| 2018 | £319,250 | 9% |
42 Properties |
| 2017 | £289,200 | 7% |
30 Properties |
| 2016 | £269,959 | -7% |
33 Properties |
| 2015 | £287,696 | 4% |
28 Properties |
| 2014 | £275,757 | -2% |
26 Properties |
| 2013 | £282,403 | 18% |
32 Properties |
| 2012 | £231,000 | 5% |
19 Properties |
| 2011 | £220,078 | -28% |
27 Properties |
| 2010 | £281,917 | 17% |
31 Properties |
| 2009 | £232,789 | -32% |
19 Properties |
| 2008 | £307,758 | 4% |
23 Properties |
| 2007 | £295,885 | 14% |
53 Properties |
| 2006 | £254,372 | -1% |
30 Properties |
| 2005 | £257,580 | 8% |
31 Properties |
| 2004 | £237,688 | 17% |
26 Properties |
| 2003 | £197,117 | 31% |
31 Properties |
| 2002 | £135,466 | 12% |
48 Properties |
| 2001 | £119,131 | 3% |
41 Properties |
| 2000 | £115,281 | -28% |
30 Properties |
| 1999 | £148,009 | 21% |
44 Properties |
| 1998 | £116,470 | 22% |
29 Properties |
| 1997 | £91,300 | 9% |
43 Properties |
| 1996 | £82,934 | -1% |
44 Properties |
| 1995 | £84,122 | - |
25 Properties |
Property Price per Property Type in Bywell
Here you can find historic sold price data in order to help with your property search.
The average Property Paid Price for specific property types in the last three years are:
| Property Type | Average Sold Price | Sold Properties |
|---|---|---|
| Semi Detached House | £443,121.00 | 14 Semi Detached Houses |
| Detached House | £513,250.00 | 16 Detached Houses |
| Terraced House | £316,218.00 | 40 Terraced Houses |
| Flat | £205,750.00 | 4 Flats |

