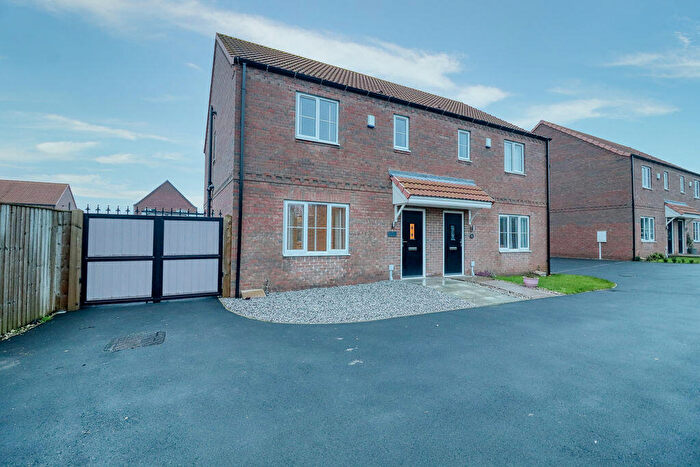
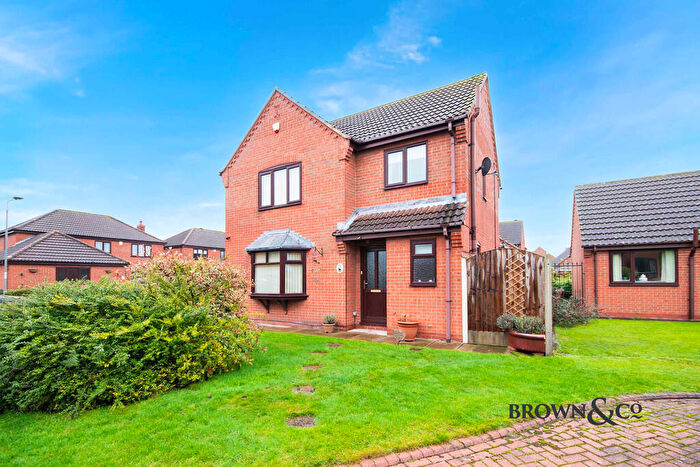
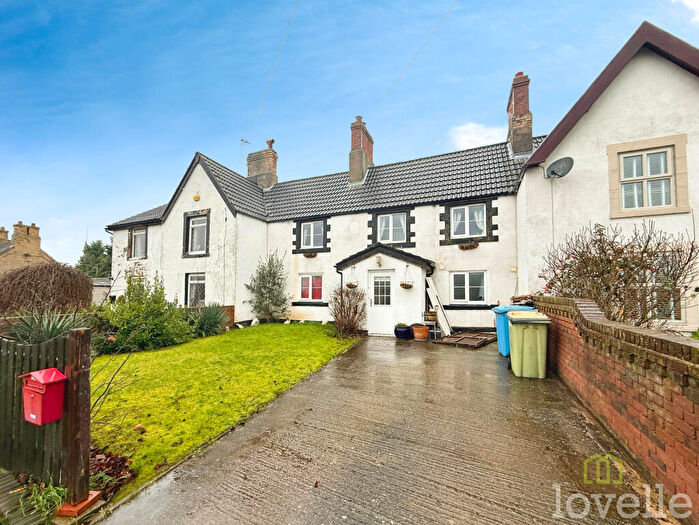
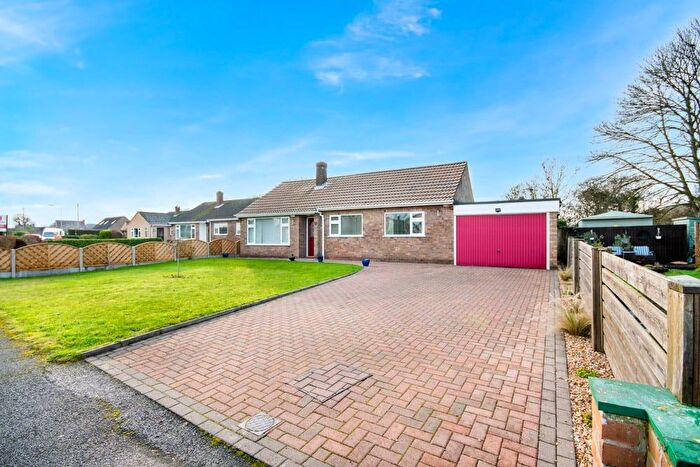
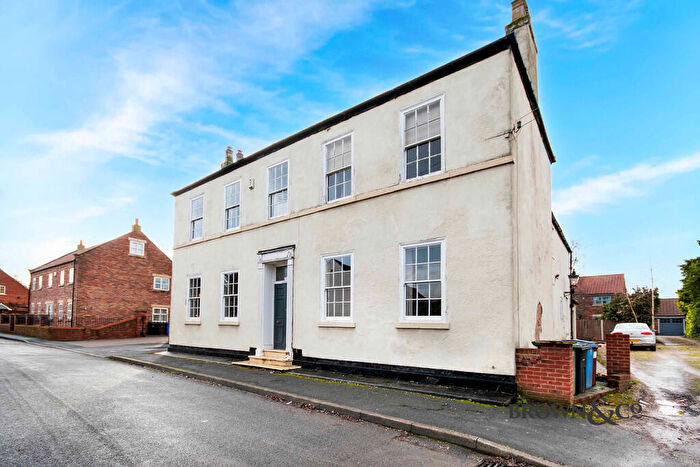
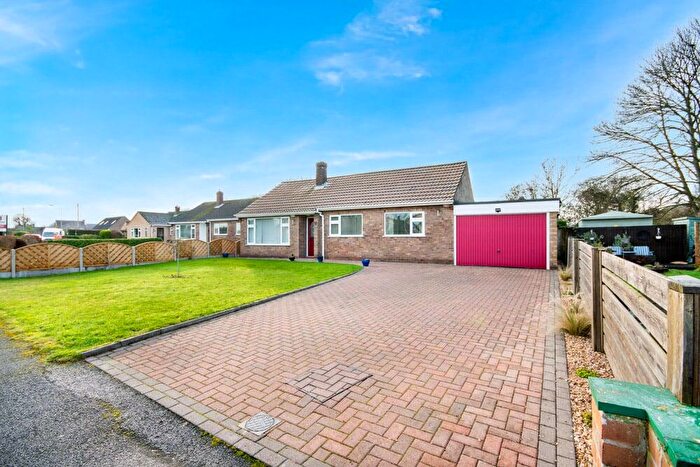
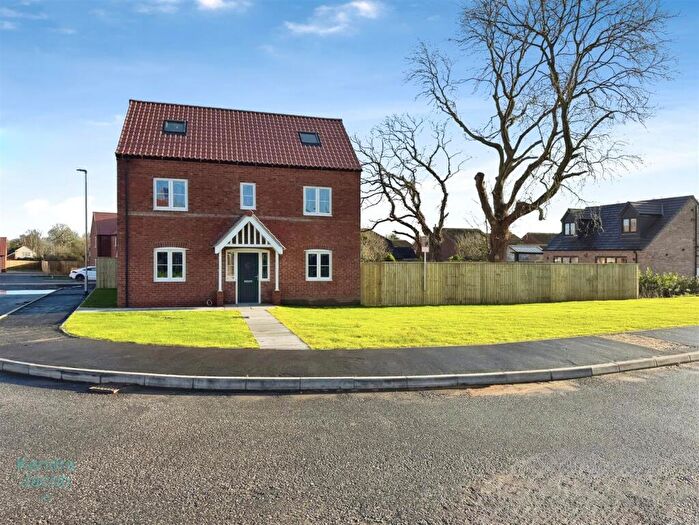
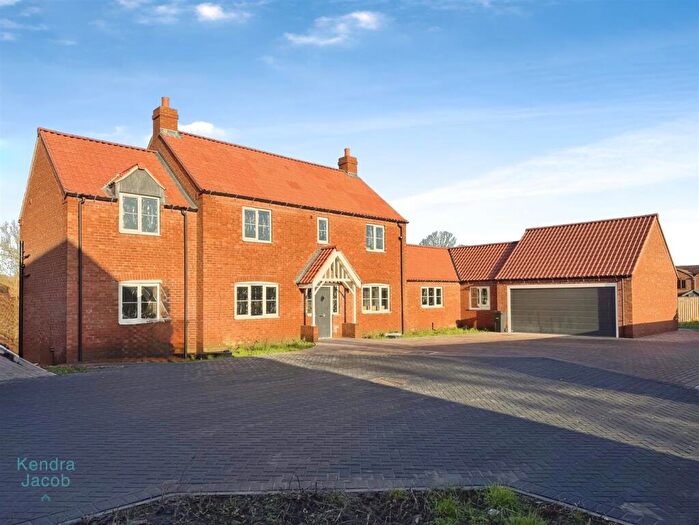
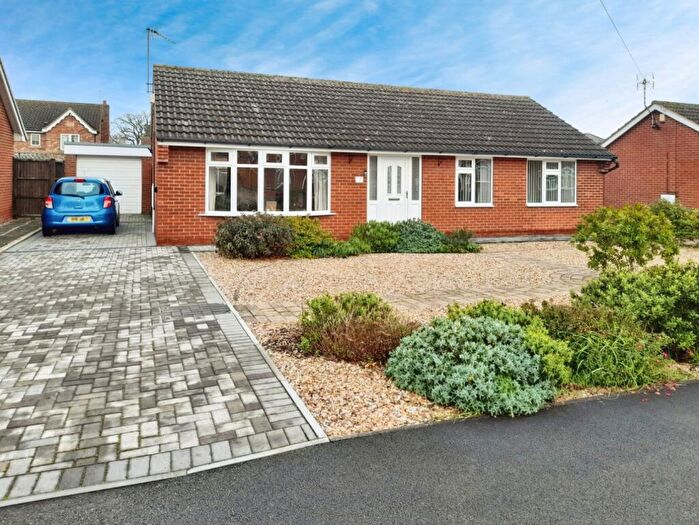
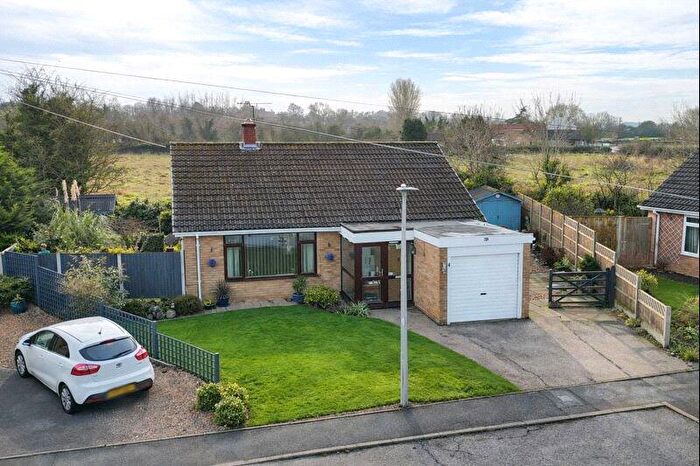
Houses for sale & to rent in Beckingham, Doncaster
House Prices in Beckingham
Properties in Beckingham have an average house price of £261,843.00 and had 103 Property Transactions within the last 3 years¹.
Beckingham is an area in Doncaster, Nottinghamshire with 935 households², where the most expensive property was sold for £899,950.00.
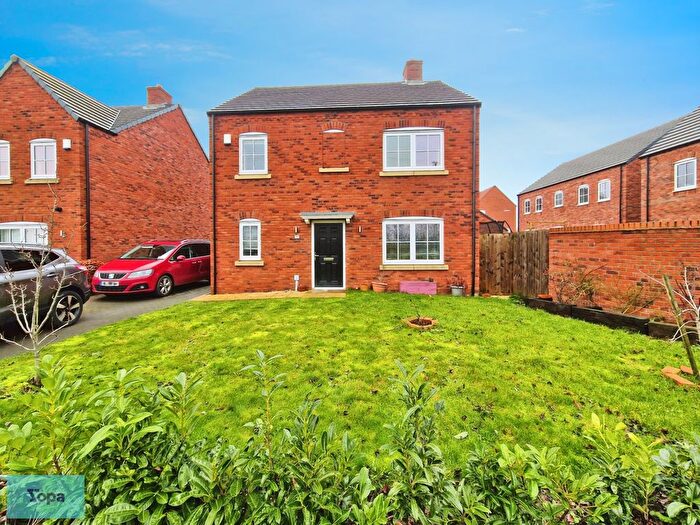
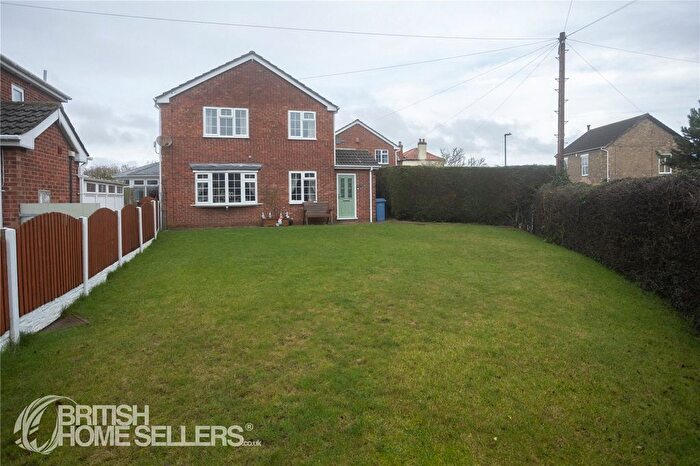
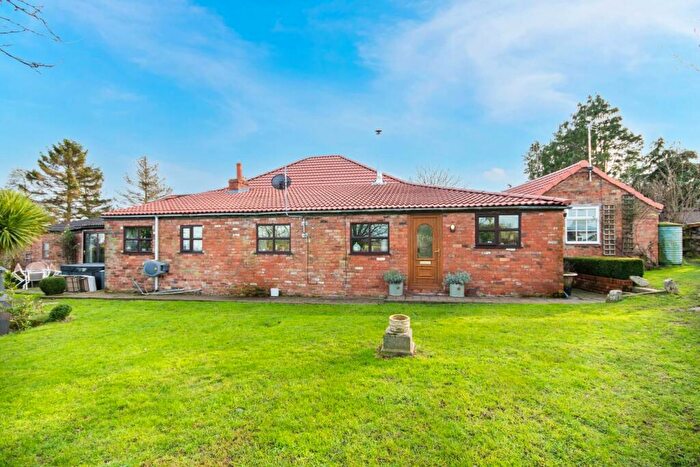
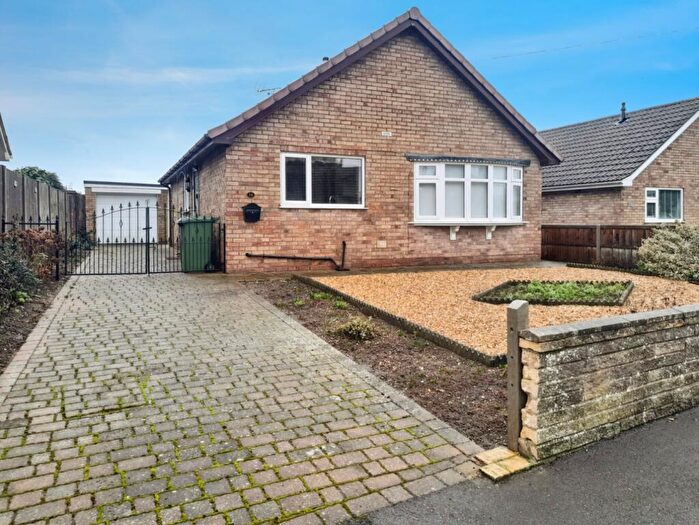
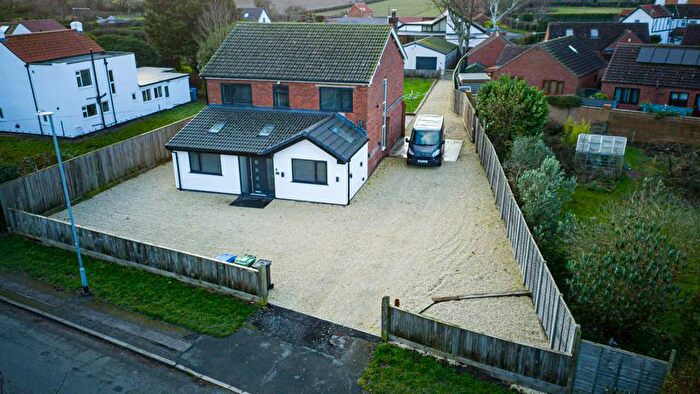
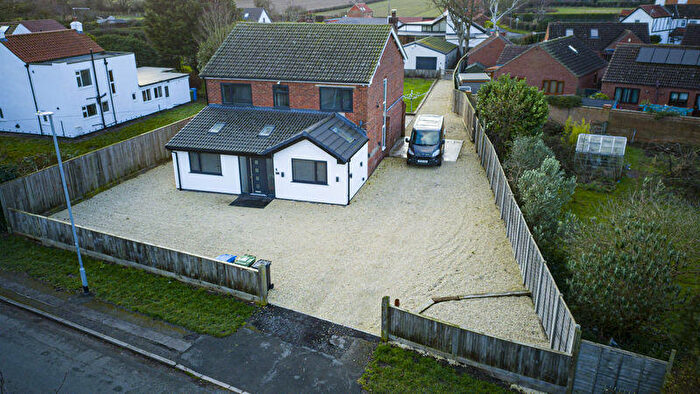
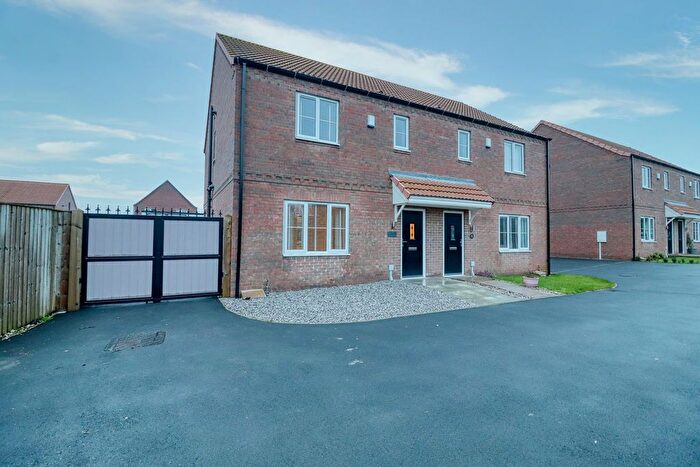
Properties for sale in Beckingham
Roads and Postcodes in Beckingham
Navigate through our locations to find the location of your next house in Beckingham, Doncaster for sale or to rent.
| Streets | Postcodes |
|---|---|
| Bar Road North | DN10 4NN |
| Bar Road South | DN10 4QB |
| Beck Drive | DN10 4JU |
| Beckingham Road | DN10 4HZ |
| Beecher Lane | DN10 4QL |
| Bells Court | DN10 4QJ |
| Birdcroft Lane | DN10 4JB |
| Bramley Way | DN10 4DY |
| Brickenhole Lane | DN10 4HX |
| Brickyard Lane | DN10 4LZ |
| Caves Lane | DN10 4LS |
| Chestnut Close | DN10 4JZ |
| Church Street | DN10 4PH |
| Church View | DN10 4PU |
| Crabtree Lane | DN10 4QG |
| Deerlands Way | DN10 4FW |
| Drovers End | DN10 4FD |
| Fountain Hill | DN10 4LX DN10 4LY |
| Fountain Hill Road | DN10 4LT |
| Green Lane | DN10 4NZ DN10 4RP |
| Gringley Road | DN10 4HT DN10 4HU DN10 4QF DN10 4PG DN10 4QD |
| Hawthorn Close | DN10 4QH |
| High Street | DN10 4HR DN10 4LJ DN10 4NW DN10 4NY DN10 4PB DN10 4PF DN10 4PQ DN10 4PE |
| Horseshoe Rise | DN10 4HQ |
| Lapwing Close | DN10 4SR |
| Low Street | DN10 4JA DN10 4PJ DN10 4PS DN10 4PW |
| Mill Lane | DN10 4HY |
| Millbaulk Lane | DN10 4LL |
| Moorland Avenue | DN10 4LG |
| Moorland Close | DN10 4LQ |
| Moorland Walk | DN10 4LH |
| Mutton Lane | DN10 4QE |
| Newells Terrace | DN10 4DP |
| North Moor Drive | DN10 4LN |
| North Moor Road | DN10 4LW |
| Nursery Gardens | DN10 4NF |
| Oaklands | DN10 4FB |
| Old Trent Road | DN10 4PY |
| Orchard Close | DN10 4FY |
| Orchard Rise | DN10 4NG |
| Pippin Close | DN10 4DX |
| Ravencroft Lane | DN10 4PA |
| Rectory Gardens | DN10 4PP |
| School House Lane | DN10 4LF |
| Sidsaph Hill | DN10 4HP DN10 4HS |
| South Moor Road | DN10 4LB DN10 4LD |
| Southfield Lane | DN10 4FX |
| St Marys Close | DN10 4JT |
| Station Road | DN10 4JH DN10 4JJ DN10 4JL DN10 4JN DN10 4JQ DN10 4JW DN10 4PT DN10 4PX DN10 4QA |
| Stockwith Road | DN10 4JD DN10 4JE DN10 4JF DN10 4JG DN10 4JS |
| The Crescent | DN10 4LU DN10 4PR |
| The Croft | DN10 4QW |
| The Green | DN10 4NL |
| The Grove | DN10 4QQ |
| The Limes | DN10 4QN |
| The Meadows | DN10 4NP |
| The Paddocks | DN10 4PD |
| The Rotunda | DN10 4FF |
| Timson Court | DN10 4TS |
| Trent Grove | DN10 4JX |
| Vicarage Lane | DN10 4PN |
| Walkeringham Road | DN10 4PL |
| Watson Park | DN10 4TA |
| West Moor Road | DN10 4LR |
| Willow Lane | DN10 4FS |
| Willow Mews | DN10 4TE |
| Wood Lane | DN10 4NR DN10 4NS DN10 4NU DN10 4NT DN10 4NX |
| Wright Gardens | DN10 4BW |
| DN10 4NB DN10 4JP DN10 4JR |
Transport near Beckingham
- FAQ
- Price Paid By Year
- Property Type Price
Frequently asked questions about Beckingham
What is the average price for a property for sale in Beckingham?
The average price for a property for sale in Beckingham is £261,843. This amount is 19% higher than the average price in Doncaster. There are 566 property listings for sale in Beckingham.
What streets have the most expensive properties for sale in Beckingham?
The streets with the most expensive properties for sale in Beckingham are West Moor Road at an average of £750,000, Stockwith Road at an average of £478,316 and The Green at an average of £475,000.
What streets have the most affordable properties for sale in Beckingham?
The streets with the most affordable properties for sale in Beckingham are Newells Terrace at an average of £120,000, Bells Court at an average of £121,000 and Moorland Avenue at an average of £156,166.
Which train stations are available in or near Beckingham?
Some of the train stations available in or near Beckingham are Gainsborough Central, Gainsborough Lea Road and Retford.
Property Price Paid in Beckingham by Year
The average sold property price by year was:
| Year | Average Sold Price | Price Change |
Sold Properties
|
|---|---|---|---|
| 2025 | £288,539 | 4% |
25 Properties |
| 2024 | £276,868 | 17% |
38 Properties |
| 2023 | £230,885 | -21% |
40 Properties |
| 2022 | £279,471 | -2% |
49 Properties |
| 2021 | £285,429 | 21% |
50 Properties |
| 2020 | £224,325 | 14% |
33 Properties |
| 2019 | £193,919 | -11% |
45 Properties |
| 2018 | £214,544 | 2% |
57 Properties |
| 2017 | £209,783 | 7% |
40 Properties |
| 2016 | £194,626 | 14% |
43 Properties |
| 2015 | £166,516 | 5% |
53 Properties |
| 2014 | £158,719 | 5% |
34 Properties |
| 2013 | £151,185 | -9% |
35 Properties |
| 2012 | £164,302 | 10% |
34 Properties |
| 2011 | £148,056 | -16% |
31 Properties |
| 2010 | £172,380 | 3% |
42 Properties |
| 2009 | £166,716 | -24% |
34 Properties |
| 2008 | £206,702 | 7% |
29 Properties |
| 2007 | £192,358 | 4% |
56 Properties |
| 2006 | £184,475 | 10% |
43 Properties |
| 2005 | £165,625 | -1% |
26 Properties |
| 2004 | £167,937 | 21% |
37 Properties |
| 2003 | £131,991 | 26% |
31 Properties |
| 2002 | £98,022 | 13% |
45 Properties |
| 2001 | £85,302 | -10% |
36 Properties |
| 2000 | £94,159 | 23% |
55 Properties |
| 1999 | £72,168 | 15% |
38 Properties |
| 1998 | £61,698 | 11% |
38 Properties |
| 1997 | £55,023 | -14% |
46 Properties |
| 1996 | £62,669 | -5% |
38 Properties |
| 1995 | £65,972 | - |
34 Properties |
Property Price per Property Type in Beckingham
Here you can find historic sold price data in order to help with your property search.
The average Property Paid Price for specific property types in the last three years are:
| Property Type | Average Sold Price | Sold Properties |
|---|---|---|
| Semi Detached House | £206,092.00 | 27 Semi Detached Houses |
| Detached House | £351,991.00 | 47 Detached Houses |
| Terraced House | £167,648.00 | 29 Terraced Houses |


