
Houses for sale in Nottinghamshire, England
House Prices in Nottinghamshire
Properties in Nottinghamshire have
an average house price of
£253k
and had 38,524 Property Transactions
within the last 3 years.¹
Nottinghamshire is a location in
England with
368,444 households², where the most expensive property was sold for £5.13M.
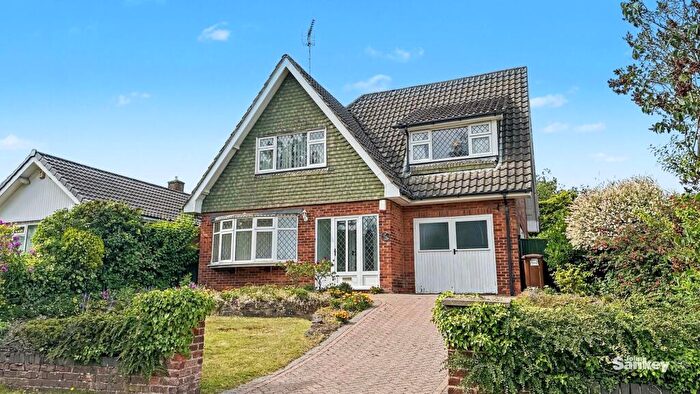
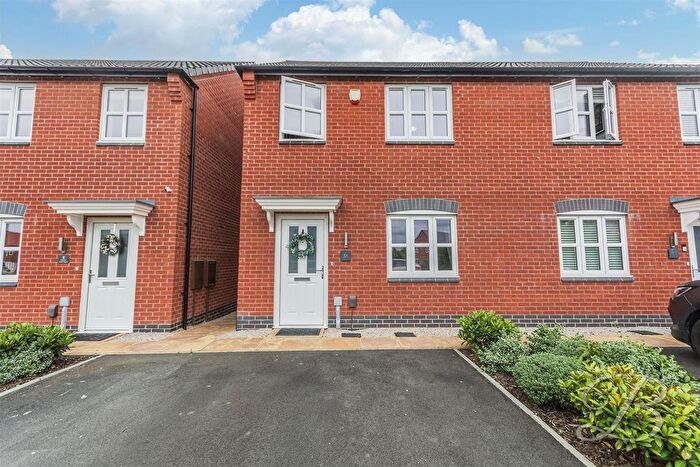
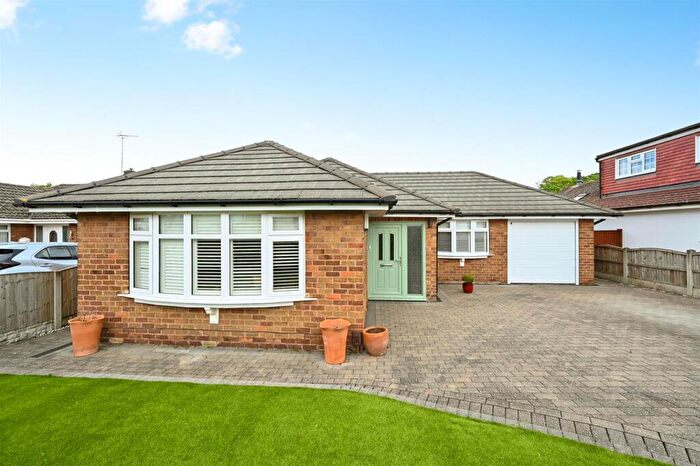
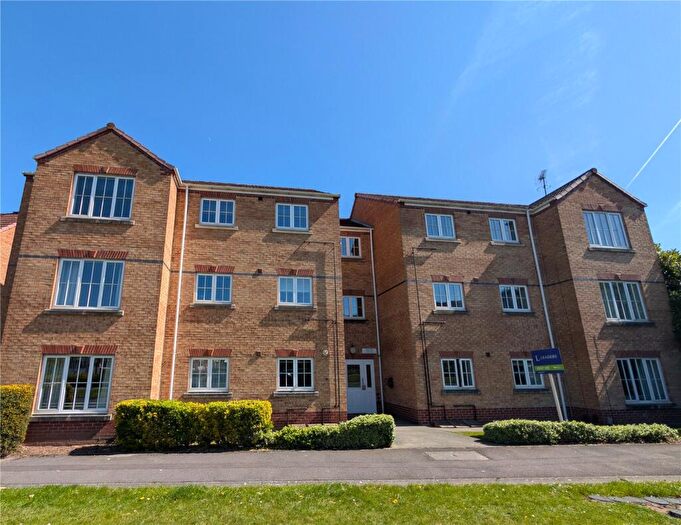
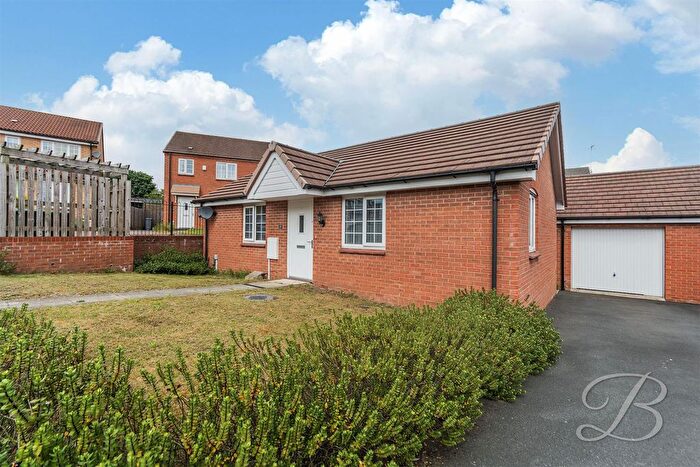
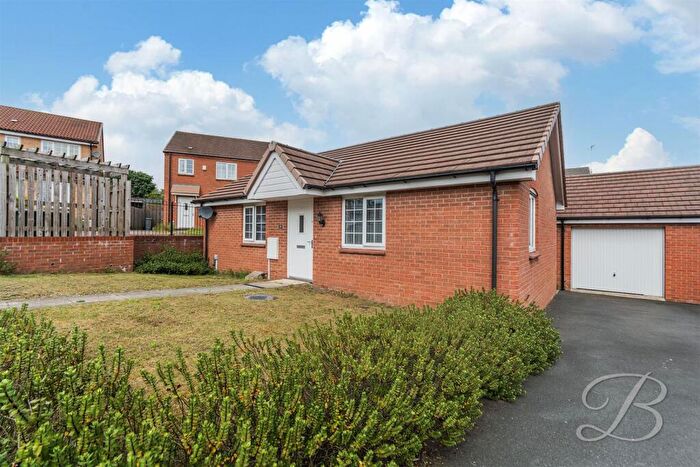
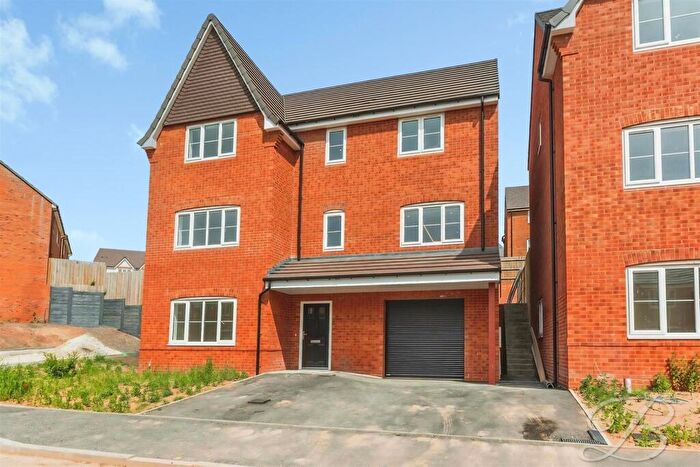
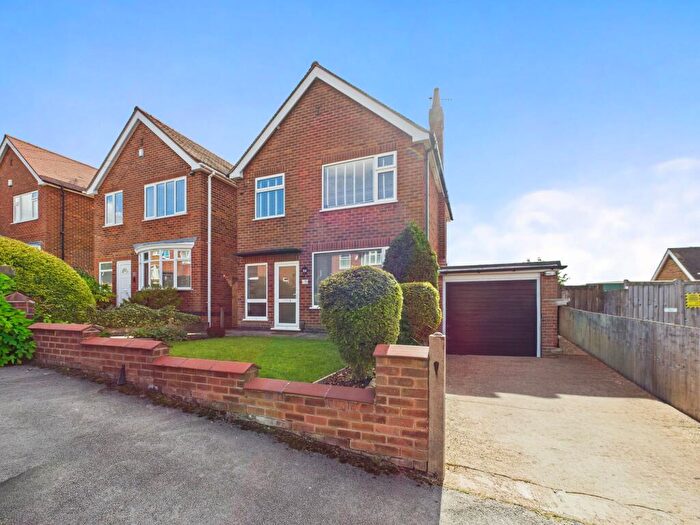
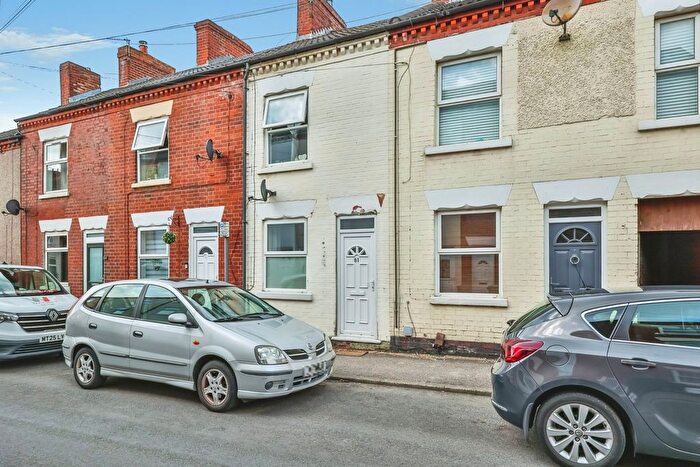
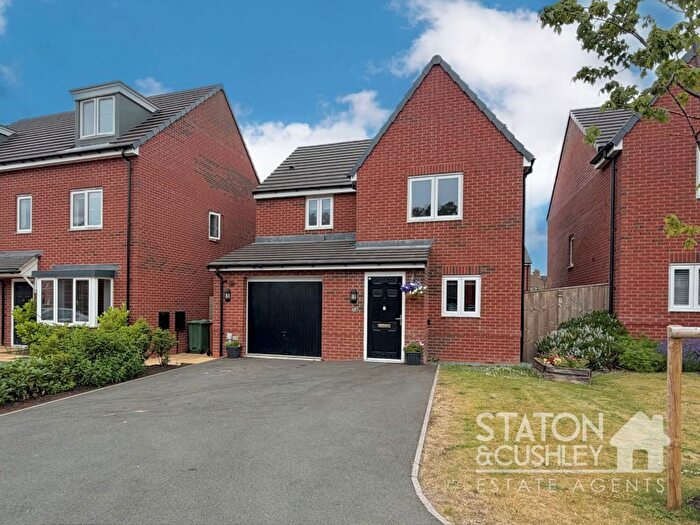
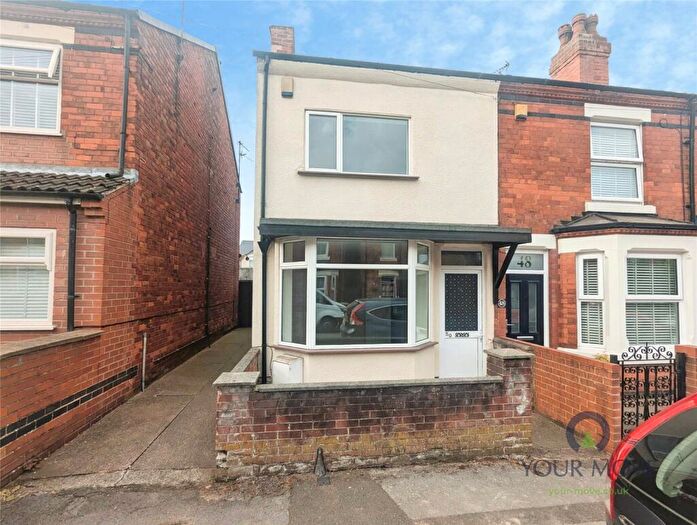
Properties for sale in Nottinghamshire
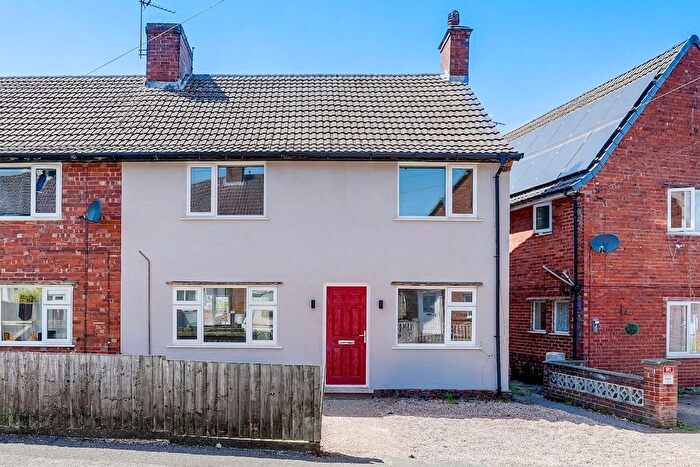
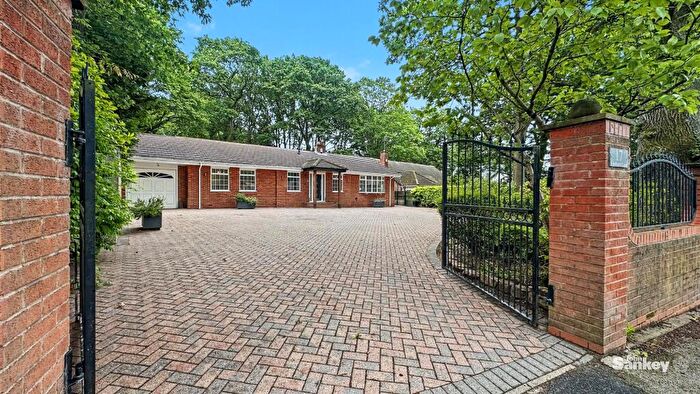
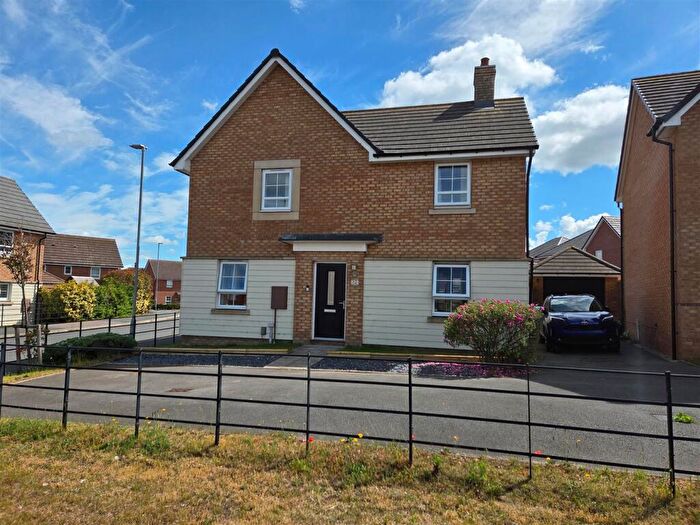
![]()
If you are looking to sell your house, let it out, or receive a property valuation, an expert can help you.
Click the button below to get started.


Towns in Nottinghamshire
Navigate through our locations to find the location of your next house in Nottinghamshire, England for sale or to rent.
Property price trends in Nottinghamshire
According to the latest Land Registry data, the average home in Nottinghamshire sold for £251,875 in 2026. That figure comes from a substantial record of 442,726 sales logged over the past 31 years.
Prices have moved up over the last three years. Compared with 2023, when the typical sale came in around £246,574, that's a rise of roughly 2.1%.
Looking back five years, average prices are up about 4.4% since 2021, a gain of around £10,634 in cash terms.
Zoom out to the past decade for the fuller picture. Back in 2016, homes here averaged £184,587, so the typical sold price has climbed about 36.5% since then, roughly 3.2% a year. Stretch the view to fifteen years and that annual pace holds at about 3.2%.
Frequently asked questions about Nottinghamshire
What is the average price for a property for sale in Nottinghamshire?
The average price for a property for sale in Nottinghamshire is £252,903. This amount is 30% lower than the average price in England. There are more than 10,000 property listings for sale in Nottinghamshire.
What locations have the most expensive properties for sale in Nottinghamshire?
The locations with the most expensive properties for sale in Nottinghamshire are Melton Mowbray at an average of £612,375, Southwell at an average of £421,851 and Loughborough at an average of £350,304.
What locations have the most affordable properties for sale in Nottinghamshire?
The locations with the most affordable properties for sale in Nottinghamshire are Alfreton at an average of £130,954, Sutton-in-ashfield at an average of £175,436 and Mansfield at an average of £194,567.
Which train stations are available in or near Nottinghamshire?
Some of the train stations available in or near Nottinghamshire are Hucknall, Newstead and Mansfield Town.
Property Price Paid in Nottinghamshire by Year
The average sold property price by year was:
| Year | Average Sold Price | Price Change |
Sold Properties
|
|---|---|---|---|
| 2026 | £251,875 | -3% |
2,194 Properties |
| 2025 | £259,034 | 3% |
12,738 Properties |
| 2024 | £252,468 | 2% |
12,470 Properties |
| 2023 | £246,574 | -1% |
11,122 Properties |
| 2022 | £249,247 | 3% |
13,959 Properties |
| 2021 | £241,241 | 8% |
17,337 Properties |
| 2020 | £221,235 | 8% |
13,670 Properties |
| 2019 | £203,473 | 1% |
15,709 Properties |
| 2018 | £201,348 | 5% |
15,374 Properties |
| 2017 | £191,974 | 4% |
15,570 Properties |
Property Price per Property Type in Nottinghamshire
Here you can find historic sold price data in order to help with your property search.
The average Property Paid Price for specific property types in the last three years are:
| Property Type | Average Sold Price | Sold Properties |
|---|---|---|
| Semi Detached House | £216,258.00 | 14,048 Semi Detached Houses |
| Terraced House | £164,798.00 | 8,471 Terraced Houses |
| Detached House | £366,571.00 | 13,528 Detached Houses |
| Flat | £141,249.00 | 2,477 Flats |
Transport in Nottinghamshire
Please see below transportation links in this area:
