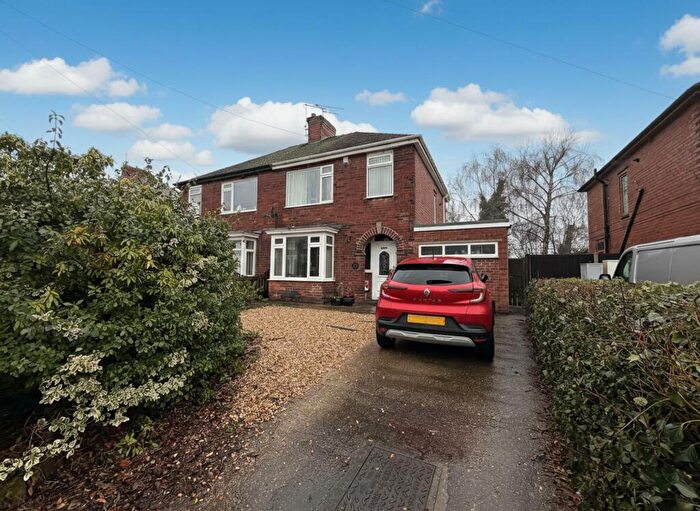
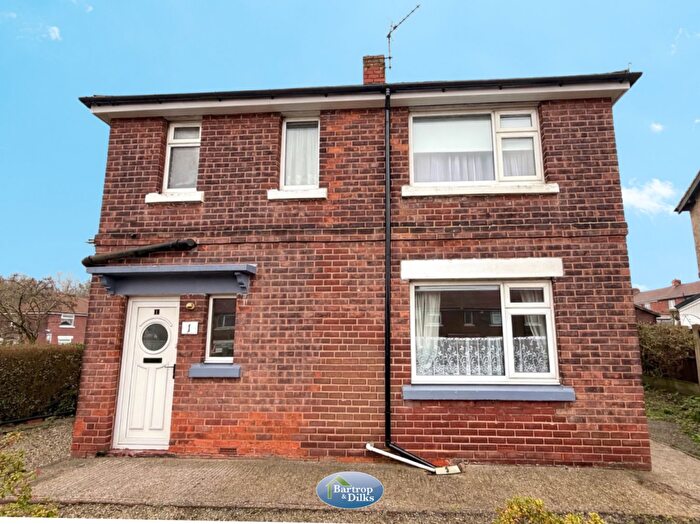
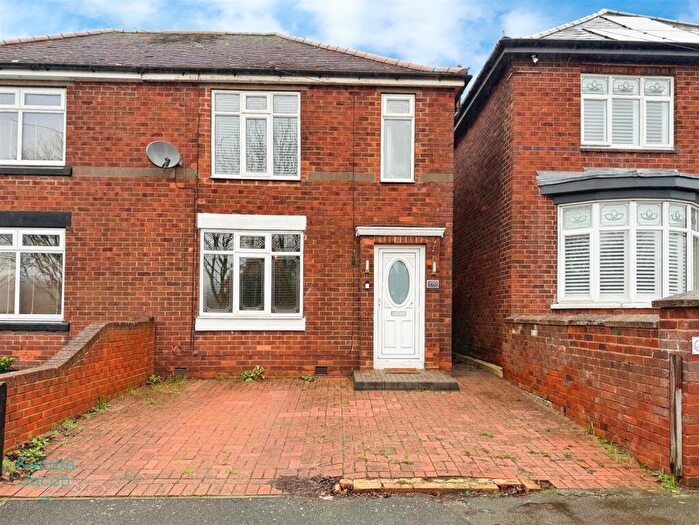
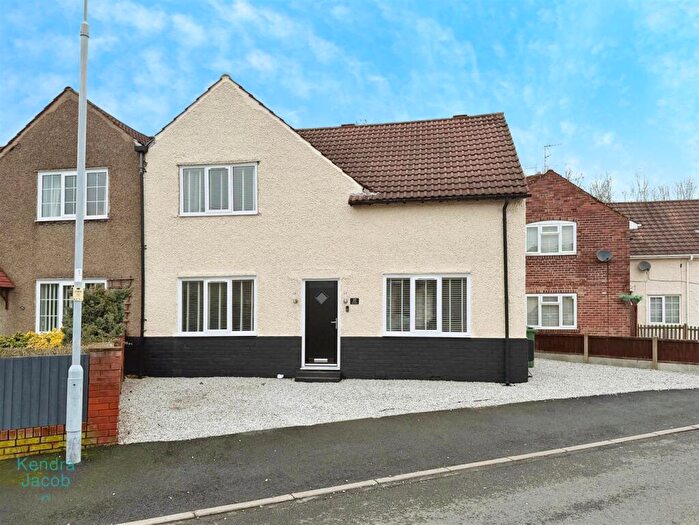
Houses for sale & to rent in Welbeck, Worksop
House Prices in Welbeck
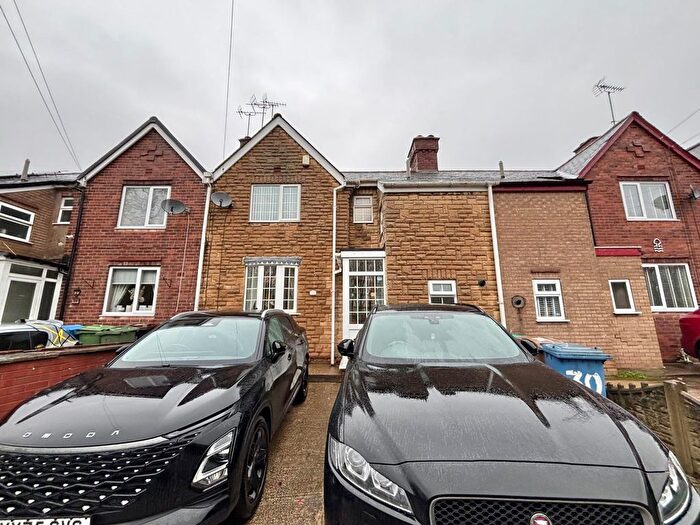
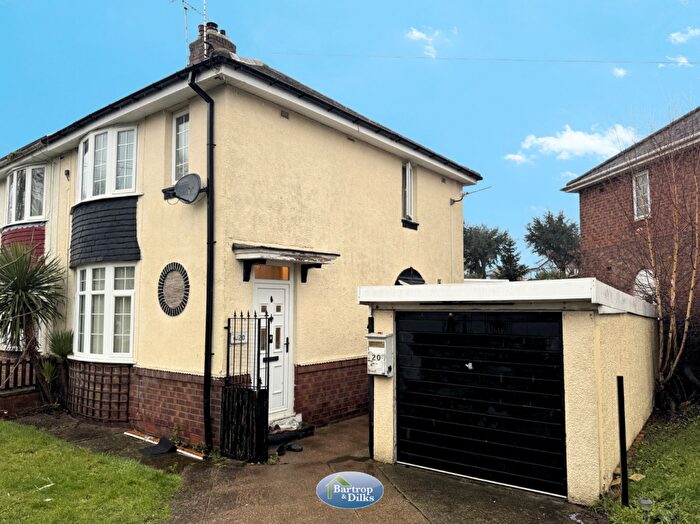
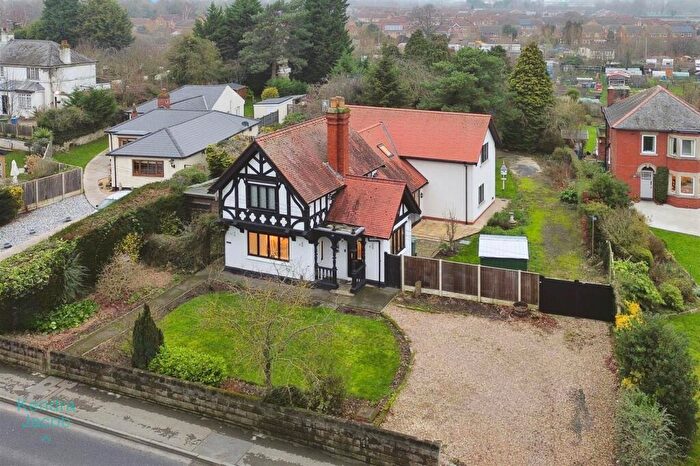
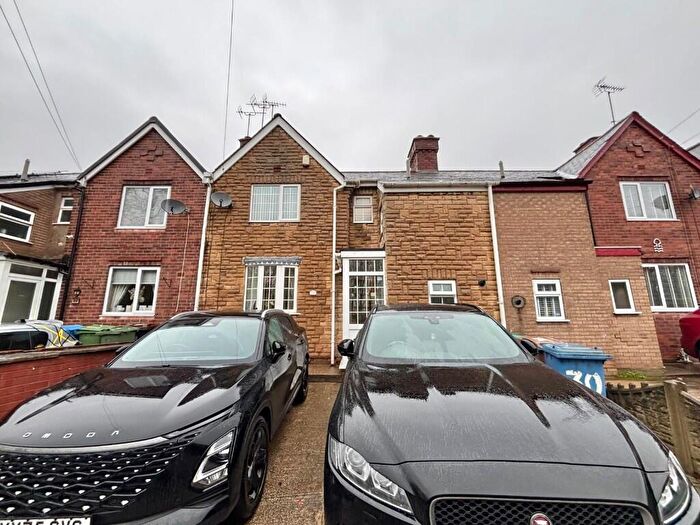
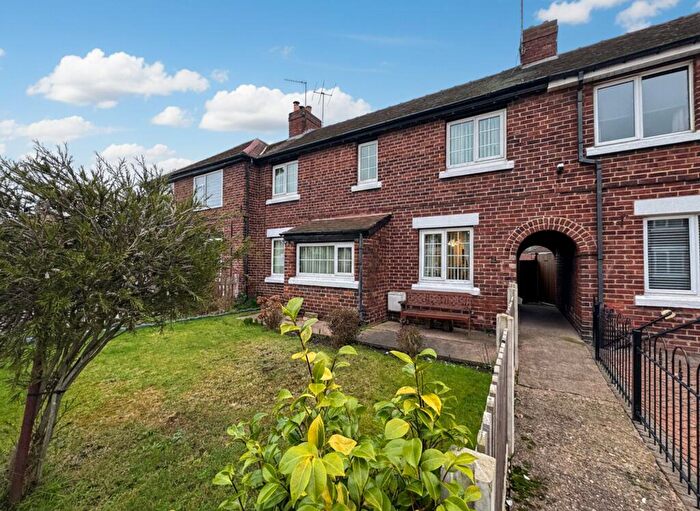
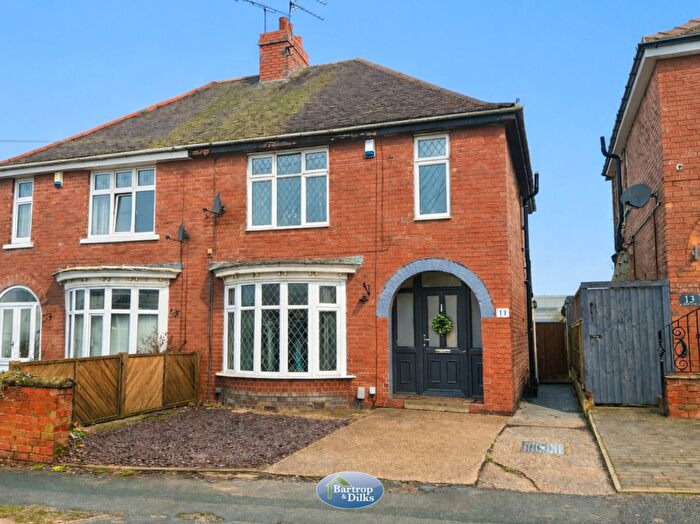
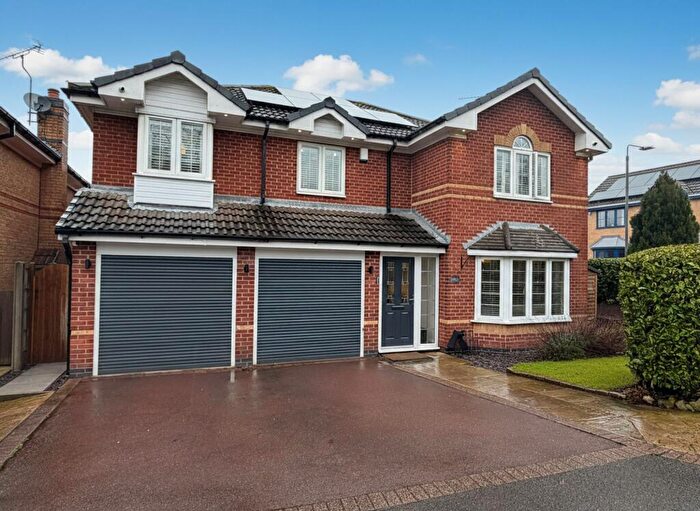
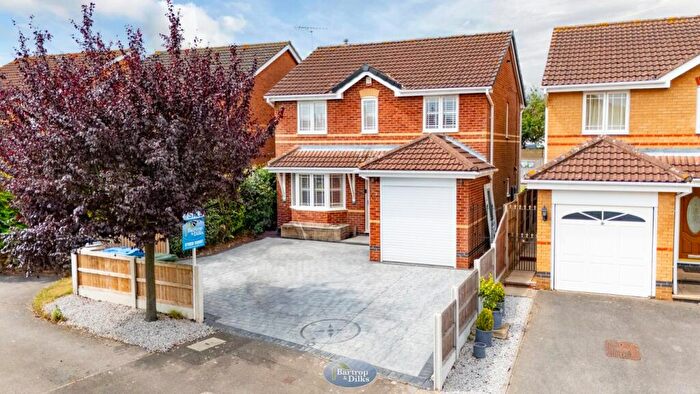
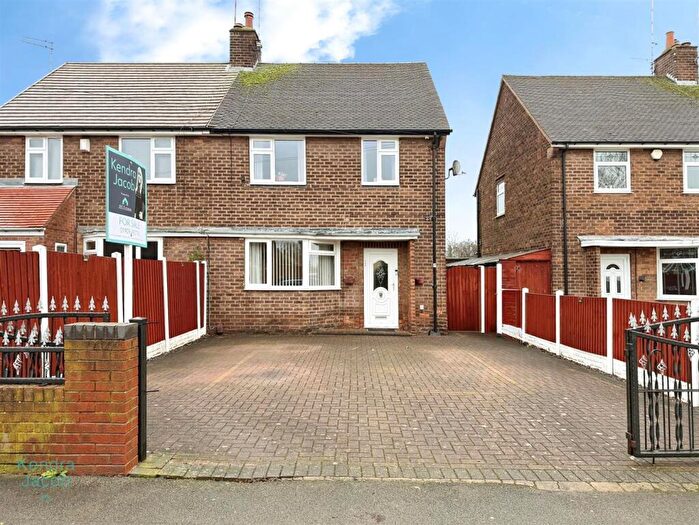
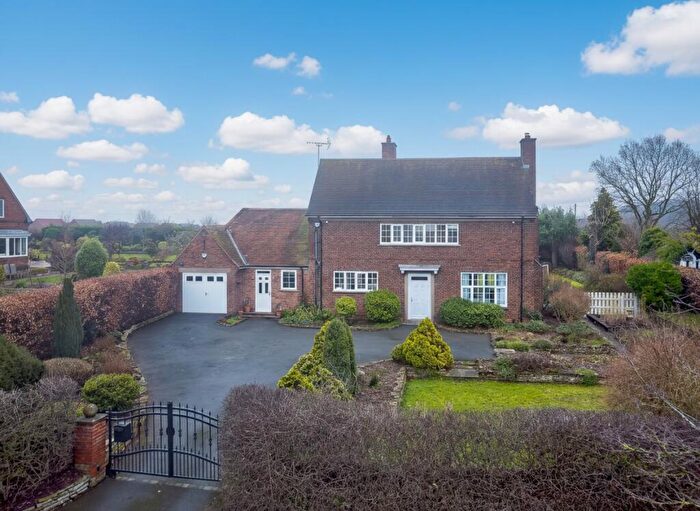
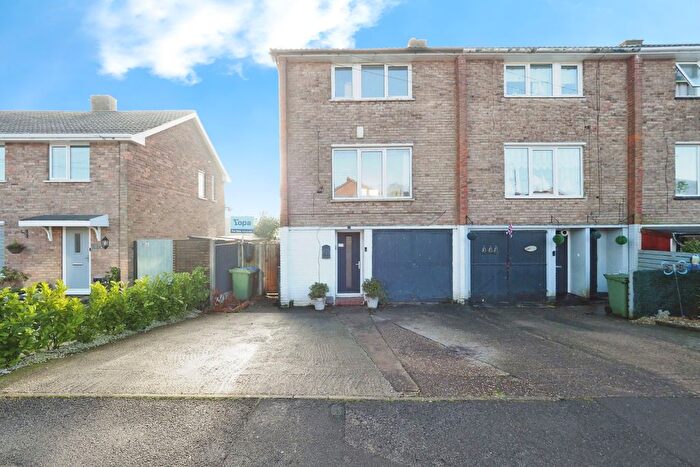
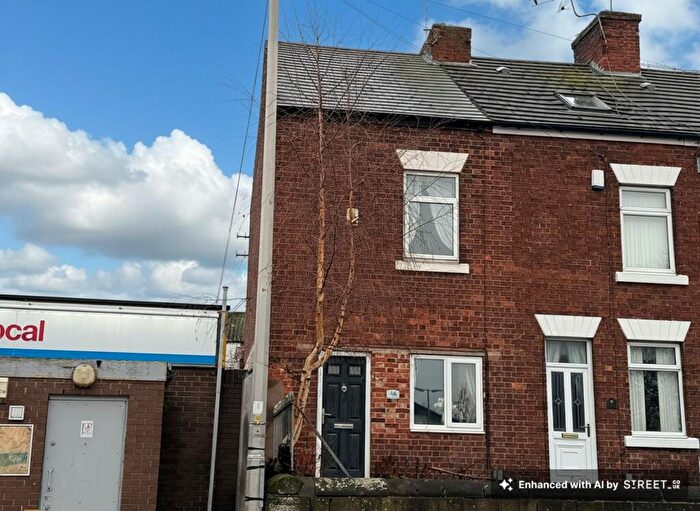
Properties in Welbeck have an average house price of £336,500.00 and had 3 Property Transactions within the last 3 years¹.
Welbeck is an area in Worksop, Nottinghamshire with 192 households², where the most expensive property was sold for £485,000.00.
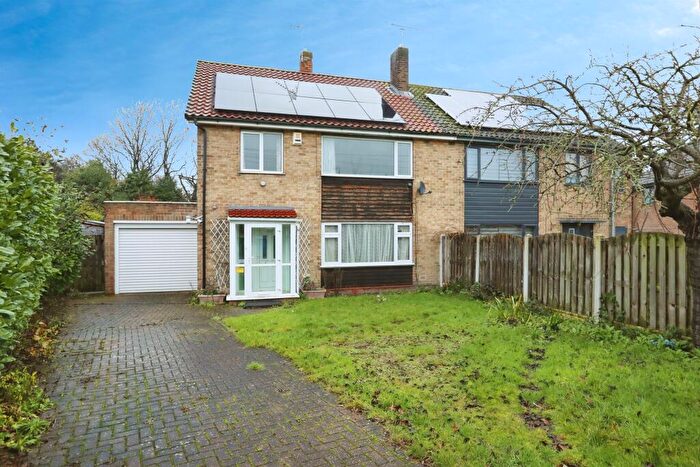
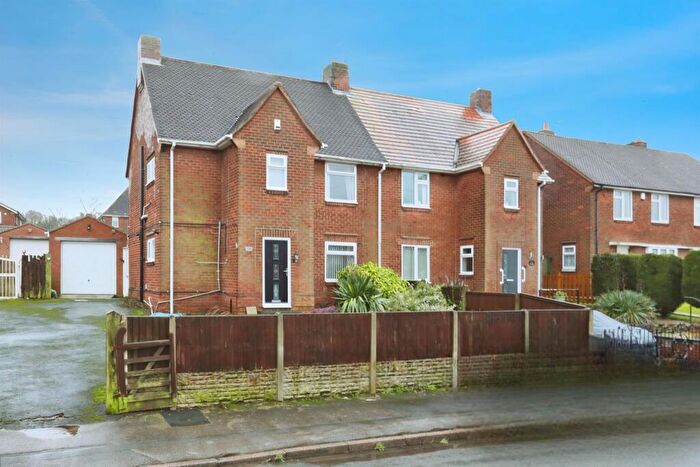
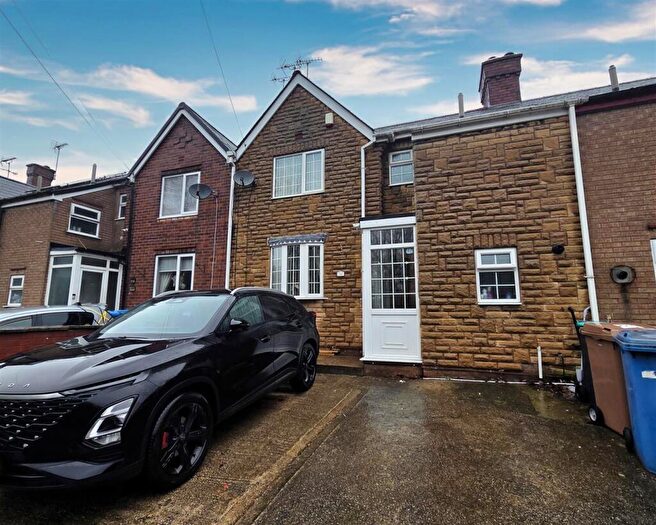
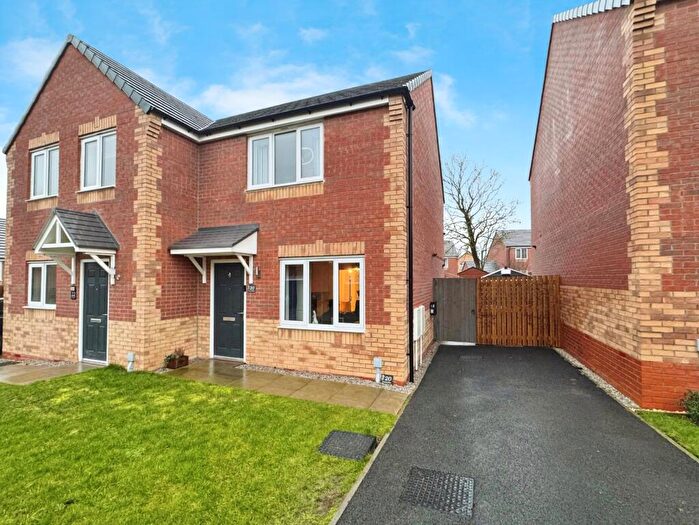
Properties for sale in Welbeck
Roads and Postcodes in Welbeck
Navigate through our locations to find the location of your next house in Welbeck, Worksop for sale or to rent.
| Streets | Postcodes |
|---|---|
| Clumber Park | S80 3AX S80 3AY S80 3BA S80 3BD S80 3BE S80 3BQ S80 3BX S80 3NU S80 3NX S80 3PA S80 3AZ |
| Court Yard | S80 3BG |
| Hardwick Terrace | S80 3PD |
| Holbeck Woodhouse | S80 3NQ |
| Hunciecroft | S80 3ND |
| Lake View Cottages | S80 3BW |
| Limetree Avenue | S80 3AE |
| Lower Woodyard Flats | S80 3LX |
| Mansfield Road | S80 4HT |
| Oxford Wing | S80 3LZ |
| Sparken Hill | S80 3BH |
| The Winnings | S80 3LY |
| Vesuvius Way | S80 3NE |
| S80 3BP S80 3BT S80 3BJ S80 3BL S80 3BN S80 3BU S80 3LL S80 3LR S80 3LT S80 3LW S80 3NB S80 3NF S80 3NG S80 3PB S80 3PE |
Transport near Welbeck
-
Worksop Station
-
Whitwell (Derbys) Station
-
Creswell (Derbys) Station
-
Langwith Station
-
Shireoaks Station
- FAQ
- Price Paid By Year
- Property Type Price
Frequently asked questions about Welbeck
What is the average price for a property for sale in Welbeck?
The average price for a property for sale in Welbeck is £336,500. This amount is 73% higher than the average price in Worksop. There are 3,993 property listings for sale in Welbeck.
What streets have the most expensive properties for sale in Welbeck?
The street with the most expensive properties for sale in Welbeck is Mansfield Road at an average of £485,000.
What streets have the most affordable properties for sale in Welbeck?
The street with the most affordable properties for sale in Welbeck is Lake View Cottages at an average of £232,000.
Which train stations are available in or near Welbeck?
Some of the train stations available in or near Welbeck are Worksop, Whitwell (Derbys) and Creswell (Derbys).
Property Price Paid in Welbeck by Year
The average sold property price by year was:
| Year | Average Sold Price | Price Change |
Sold Properties
|
|---|---|---|---|
| 2024 | £336,500 | -66% |
3 Properties |
| 2022 | £557,500 | 64% |
2 Properties |
| 2019 | £199,950 | -190% |
1 Property |
| 2017 | £580,000 | 71% |
1 Property |
| 2015 | £169,475 | -181% |
2 Properties |
| 2012 | £476,000 | 72% |
1 Property |
| 2005 | £133,000 | -87% |
1 Property |
| 2000 | £249,000 | 79% |
1 Property |
| 1999 | £51,750 | -165% |
2 Properties |
| 1998 | £137,000 | - |
1 Property |
Property Price per Property Type in Welbeck
Here you can find historic sold price data in order to help with your property search.
The average Property Paid Price for specific property types in the last three years are:
| Property Type | Average Sold Price | Sold Properties |
|---|---|---|
| Semi Detached House | £232,000.00 | 1 Semi Detached House |
| Detached House | £388,750.00 | 2 Detached Houses |

