
Houses for sale & to rent in Royton North, Oldham
House Prices in Royton North
Properties in Royton North have an average house price of £231k and had 372 Property Transactions within the last 3 years¹.
Royton North is an area in Oldham, Oldham with 4,399 households², where the most expensive property was sold for £1.2M.
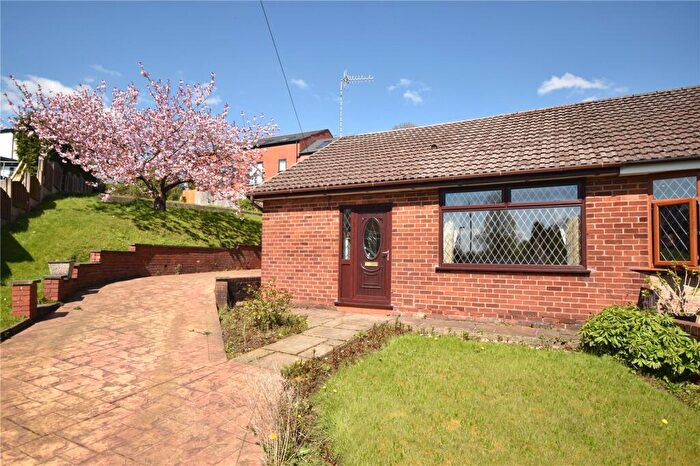
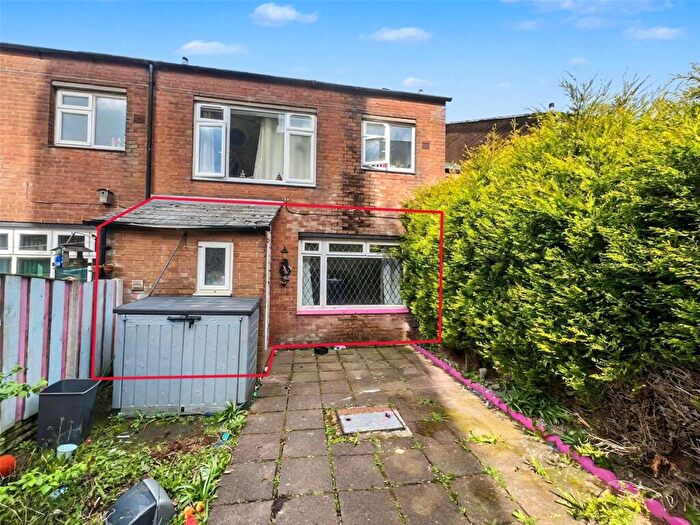
Properties for sale in Royton North

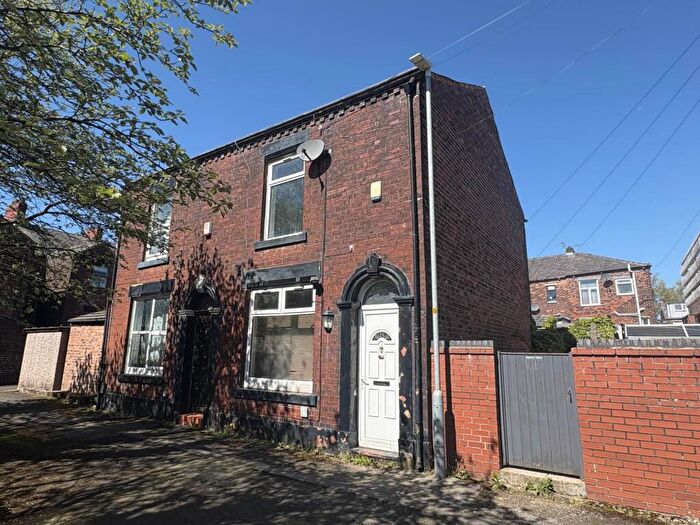
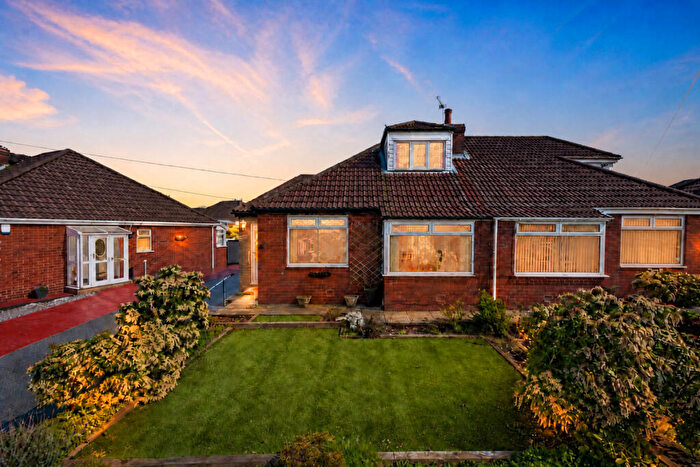
![]()
If you are looking to sell your house, let it out, or receive a property valuation, an expert can help you.
Click the button below to get started.


Roads and Postcodes in Royton North
Navigate through our locations to find the location of your next house in Royton North, Oldham for sale or to rent.
| Streets | Postcodes |
|---|---|
| Alandale Drive | OL2 5TU |
| Albert Street | OL2 5UB OL2 5UF |
| All Saints Close | OL2 5RD |
| Alpine Drive | OL2 5HA OL2 5HB |
| Ash Grove | OL2 6TJ |
| Ashwood Drive | OL2 5TW |
| Baysdale Drive | OL2 5TR |
| Beechwood Drive | OL2 5XR |
| Birchinlee Avenue | OL2 5EL |
| Borrowdale Close | OL2 6TN |
| Bransdale Avenue | OL2 5TX |
| Brantwood Close | OL2 5TF |
| Brecon Close | OL2 5YG |
| Brendon Hills | OL2 5HW |
| Bromley Avenue | OL2 5YB |
| Brook Street | OL2 5PN |
| Brookfield Avenue | OL2 5PL |
| Brooklands Street | OL2 5SU |
| Burnsall Grove | OL2 5RJ |
| Butcher Lane | OL2 5UR |
| Camberwell Way | OL2 5TL |
| Cambrian Drive | OL2 5EU |
| Cameron Court | OL2 6UH |
| Castlerigg Drive | OL2 5YJ |
| Castleton Road | OL2 6UP OL2 6XT |
| Cecil Street | OL2 5NE |
| Cemetery Road | OL2 5SP OL2 5SW |
| Chapel Croft | OL2 5JU OL2 5LB |
| Chapel Lane | OL2 5QG |
| Chapel Street | OL2 5QL |
| Chapelway Gardens | OL2 6UQ |
| Charles Street | OL2 5JN OL2 5JT |
| Cherry Grove | OL2 5YL |
| Chetwyn Avenue | OL2 5UJ |
| Cheviot Avenue | OL2 5HQ |
| Chiltern Drive | OL2 5TD |
| Church Street | OL2 5JS OL2 5LA OL2 5LF OL2 5LG |
| Church Walk | OL2 5QH OL2 5RU |
| Cinder Hill Lane | OL1 2SU OL1 2SX OL1 2SS |
| Cleveland Grove | OL2 5EX |
| Connington Close | OL2 5TP |
| Consort Avenue | OL2 5SE |
| Coral Mews | OL2 5PS |
| Cotswold Drive | OL2 5HD |
| Coverdale Avenue | OL2 5UD |
| Croft Head | OL2 5WD |
| Cromwell Road | OL2 5SG |
| Croydon Avenue | OL2 5YE |
| Deepdale Avenue | OL2 6XD |
| Denbydale Way | OL2 5TE OL2 5TJ OL2 5TN OL2 5UH |
| Devine Close | OL2 6UJ |
| Dogford Road | OL2 6UA |
| Dunkerley Street | OL2 5LE |
| Elizabeth Avenue | OL2 5LY |
| Elk Mill Centre Retail Park | OL2 5HX |
| Elly Clough | OL2 5EP OL2 5ES |
| Elmwood Drive | OL2 5XP |
| Ennerdale Avenue | OL2 6UX |
| Fairway Crescent | OL2 6TT |
| Fir Bank Road | OL2 6TU |
| Firswood Drive | OL2 5XS |
| Flake Lane | OL2 5RF |
| Garden Terrace | OL2 6XS |
| Glazedale Avenue | OL2 5TS |
| Glen Grove | OL2 5SY |
| Glen View | OL2 5RG |
| Grasmere Road | OL2 6SJ OL2 6SW |
| Grisedale Avenue | OL2 6XB |
| Haggate | OL2 5DU |
| Haggate Crescent | OL2 5NF |
| Hall Street | OL2 5PR |
| Hamilton Avenue | OL2 5EN |
| Hanging Chadder | OL2 6XR |
| Hanging Chadder Lane | OL2 6XP |
| Harewood Drive | OL2 5TB OL2 5TZ OL2 5UA |
| Hawkshead Drive | OL2 6TW |
| High Gate Drive | OL2 5UP |
| Highbury Way | OL2 6UL |
| Highlands | OL2 5HL OL2 5HP |
| Highlands Road | OL2 5HR |
| Highthorne Green | OL2 5US |
| Hindle Drive | OL2 5LU OL2 5LZ |
| Holden Fold Lane | OL2 5LN OL2 5LW OL2 5FJ |
| Holly Bank | OL2 6TZ |
| Hollybrook | OL1 2SY |
| Ingleton Close | OL2 5UE |
| John Street | OL2 5JR |
| Kensington Avenue | OL2 5SA OL2 5XZ OL2 5YF |
| Kershaw Street | OL2 5QZ |
| Kingston Drive | OL2 5XU OL2 5YA |
| Kirkdale Drive | OL2 5TG |
| Kirkstone Drive | OL2 6TP |
| Lakeland Drive | OL2 6XE |
| Lancaster Square | OL2 5QY |
| Lea View | OL2 5HE OL2 5HF OL2 5HG OL2 5HJ OL2 5ED |
| Lewisham Close | OL2 5YD |
| Leyburn Avenue | OL2 5RN |
| Lime Grove | OL2 6TH |
| Lindale Avenue | OL2 6UU |
| Longdale Close | OL2 5UG |
| Lorne Avenue | OL2 5EQ |
| Loughrigg Avenue | OL2 6XA |
| Lowther Avenue | OL2 6UY OL2 6UZ |
| Lynmouth Avenue | OL2 5EF |
| Lynton Avenue | OL2 5EE |
| Malham Close | OL2 5RQ |
| Malvern Close | OL2 5HH |
| Mardale Avenue | OL2 6UT |
| Market Square | OL2 5QD |
| Market Street | OL2 5QA |
| Mendip Close | OL2 5EY OL2 5EZ |
| Middleton Road | OL2 5EB OL2 5EH OL2 5JQ OL2 5LL OL2 5LS OL2 5LT OL2 5NA OL2 5PA OL2 5JJ OL2 5LP |
| Mill Lane | OL2 5NG |
| Mill Street | OL2 5QW |
| Newark Park Way | OL2 5YQ |
| Newcoin Street | OL2 6JZ |
| Newtondale Avenue | OL2 5TT |
| Nordek Close | OL2 5SS |
| Nordek Drive | OL2 5ST |
| North Street | OL2 5LQ |
| Oak Avenue | OL2 6TB OL2 6TD |
| Oldham Road | OL2 5PE OL2 5PF |
| Oozewood Road | OL2 5SQ OL2 5XG OL2 5XW OL2 5SJ |
| Parklands | OL2 5YN |
| Pendle Grove | OL2 5HN |
| Pine Grove | OL2 6TL |
| Prince Way | OL2 5SF |
| Queen Street | OL2 5JY |
| Queensgate Drive | OL2 5SD |
| Racefield Hamlet | OL1 2TB |
| Radcliffe Street | OL2 5QR |
| Rainshaw Street | OL2 5NB |
| Richmond Avenue | OL2 5RH |
| Rochdale Lane | OL2 5RB OL2 5RW |
| Rochdale Road | OL2 5RY OL2 5SL OL2 5SN OL2 5SX OL2 5UT OL2 5UW OL2 6SF OL2 6SH OL2 6TR OL2 6TS OL2 6UF OL2 6XF OL2 6XG OL2 5PH OL2 5PT OL2 5QT OL2 5RA OL2 6UE OL2 6XQ |
| Roman Road | OL2 5PQ OL2 5PJ |
| Rothwell Street | OL2 5ND |
| Roy Street | OL2 5PW |
| Royley | OL2 5DY |
| Royley Clough | OL2 5NJ |
| Royley Crescent | OL2 5DX OL2 5DZ |
| Royley Way | OL2 5EA |
| Sandringham Way | OL2 5YH |
| Sandy Lane | OL2 5QP OL2 5RS OL2 5RT |
| Sandy Walk | OL2 5QJ |
| Shepherd Street | OL2 5PB OL2 5PG |
| Spring Garden Street | OL2 5QE OL2 5QS |
| Springfield Lane | OL2 6XH OL2 6XN OL2 6XW |
| Springhill | OL2 5PP |
| Steeple View | OL2 5QU |
| Stottfield | OL2 5EJ |
| Streetbridge | OL2 5NN |
| Tall Trees Close | OL2 5XA |
| Tandle Hill Road | OL2 5UU OL2 5UX |
| Tandlewood Park | OL2 5UZ |
| Taylor Street | OL2 5SR |
| Thorncliffe Avenue | OL2 5RZ |
| Thorncliffe Park | OL2 5RX |
| Thornham Lane | OL2 6UW |
| Thornham Old Road | OL2 5UN |
| Thorp | OL2 5TH |
| Thorp Clough | OL2 5NH |
| Thorp Road | OL2 5FF |
| Thorp View | OL2 5XT |
| Union Street | OL2 5JD |
| Victoria Terrace | OL2 5UQ |
| Victoria Way | OL2 5SB |
| Wensleydale Close | OL2 5TQ |
| Westerdale Drive | OL2 5TY |
| Westminster Avenue | OL2 5XX OL2 5XY |
| Westridge Chase | OL2 5JL |
| Wetherby Drive | OL2 5SZ OL2 5TA |
| Wheatfield Crescent | OL2 5LX |
| Woodland Park | OL2 5UY |
Transport near Royton North

- FAQ
- Price Paid By Year
- Property Type Price
Frequently asked questions about Royton North
What is the average price for a property for sale in Royton North?
The average price for a property for sale in Royton North is £231,443. This amount is 12% higher than the average price in Oldham. There are 2,514 property listings for sale in Royton North.
What streets have the most expensive properties for sale in Royton North?
The streets with the most expensive properties for sale in Royton North are Racefield Hamlet at an average of £1,200,000, Tall Trees Close at an average of £640,000 and Tandle Hill Road at an average of £589,363.
What streets have the most affordable properties for sale in Royton North?
The streets with the most affordable properties for sale in Royton North are Richmond Avenue at an average of £65,000, Flake Lane at an average of £79,900 and Roman Road at an average of £110,000.
Which train stations are available in or near Royton North?
Some of the train stations available in or near Royton North are Mills Hill, Castleton and Rochdale.
Property Price Paid in Royton North by Year
The average sold property price by year was:
| Year | Average Sold Price | Price Change |
Sold Properties
|
|---|---|---|---|
| 2026 | £182,077 | -32% |
9 Properties |
| 2025 | £240,808 | 5% |
120 Properties |
| 2024 | £228,087 | -1% |
142 Properties |
| 2023 | £229,436 | 6% |
101 Properties |
| 2022 | £214,570 | -1% |
129 Properties |
| 2021 | £216,000 | 7% |
166 Properties |
| 2020 | £199,852 | 18% |
126 Properties |
| 2019 | £163,456 | 3% |
142 Properties |
| 2018 | £158,395 | -0,1% |
142 Properties |
| 2017 | £158,575 | 10% |
160 Properties |
| 2016 | £142,833 | 2% |
131 Properties |
| 2015 | £139,585 | -4% |
119 Properties |
| 2014 | £145,095 | 8% |
138 Properties |
| 2013 | £133,292 | 3% |
105 Properties |
| 2012 | £129,496 | -9% |
70 Properties |
| 2011 | £141,430 | 3% |
81 Properties |
| 2010 | £136,510 | -19% |
77 Properties |
| 2009 | £162,111 | 12% |
53 Properties |
| 2008 | £142,172 | -8% |
83 Properties |
| 2007 | £153,655 | 11% |
154 Properties |
| 2006 | £137,461 | 1% |
155 Properties |
| 2005 | £135,891 | 7% |
128 Properties |
| 2004 | £126,641 | 30% |
186 Properties |
| 2003 | £88,906 | 9% |
165 Properties |
| 2002 | £81,321 | 14% |
175 Properties |
| 2001 | £69,762 | 12% |
171 Properties |
| 2000 | £61,202 | 2% |
152 Properties |
| 1999 | £60,085 | 10% |
148 Properties |
| 1998 | £54,263 | -8% |
121 Properties |
| 1997 | £58,725 | 14% |
160 Properties |
| 1996 | £50,702 | 6% |
149 Properties |
| 1995 | £47,592 | - |
107 Properties |
Property Price per Property Type in Royton North
Here you can find historic sold price data in order to help with your property search.
The average Property Paid Price for specific property types in the last three years are:
| Property Type | Average Sold Price | Sold Properties |
|---|---|---|
| Flat | £120,893.00 | 24 Flats |
| Semi Detached House | £248,667.00 | 155 Semi Detached Houses |
| Detached House | £402,402.00 | 42 Detached Houses |
| Terraced House | £183,783.00 | 151 Terraced Houses |