
Houses for sale & to rent in Oldham, England
House Prices in Oldham
Properties in Oldham have
an average house price of
£207k
and had 8,011 Property Transactions
within the last 3 years.¹
Oldham is a location in
England with
89,660 households², where the most expensive property was sold for £1.5M.
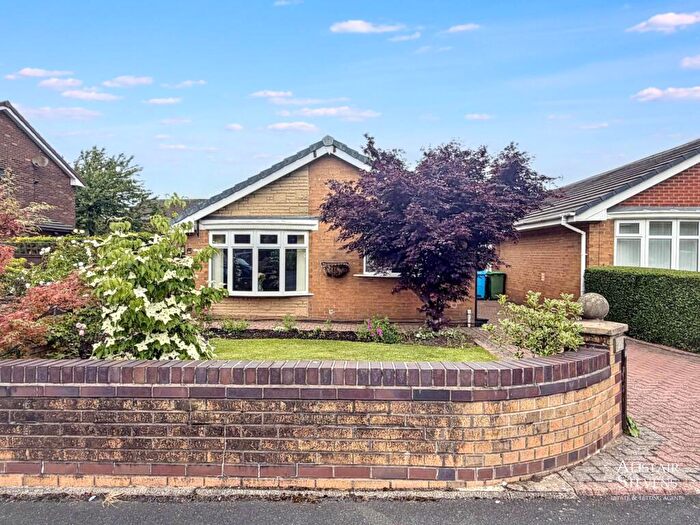
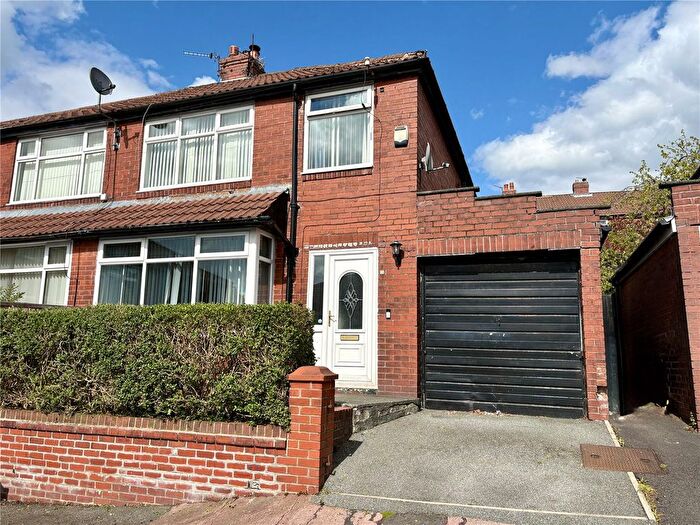
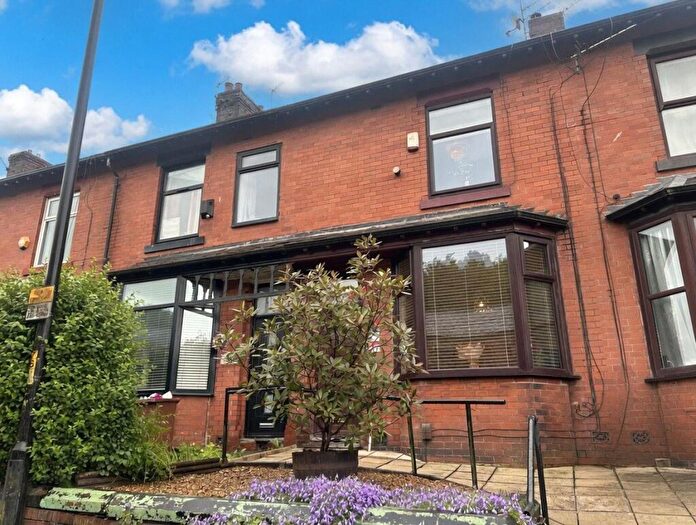
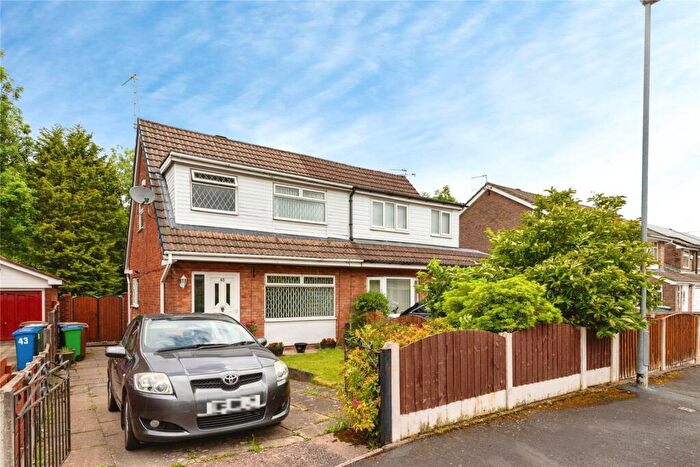
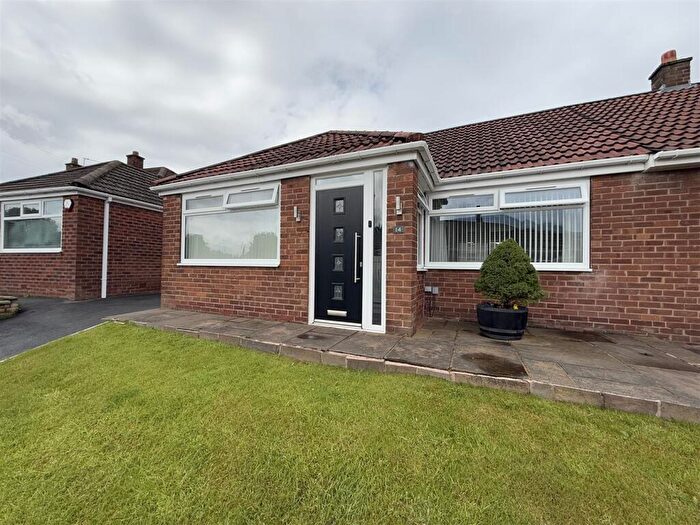
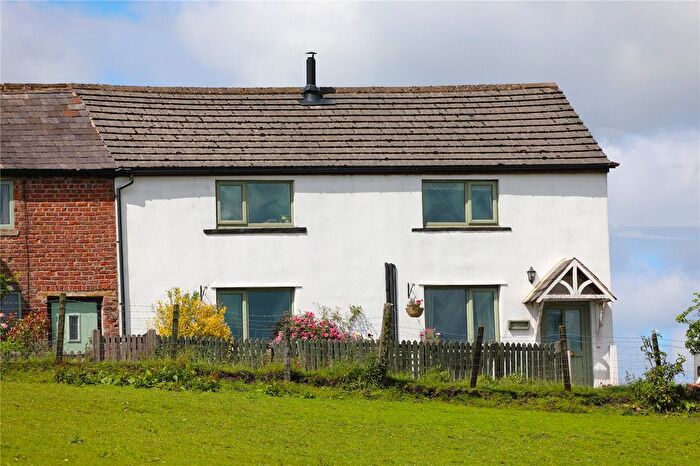
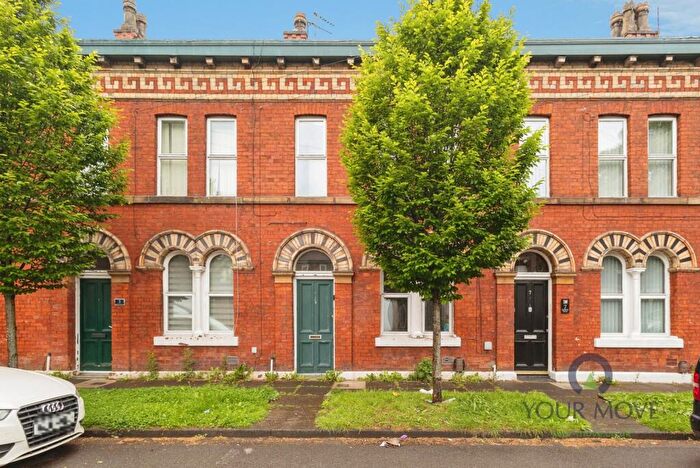
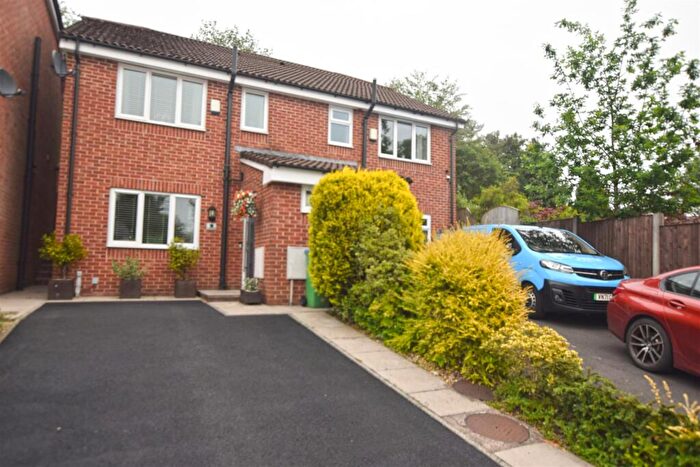
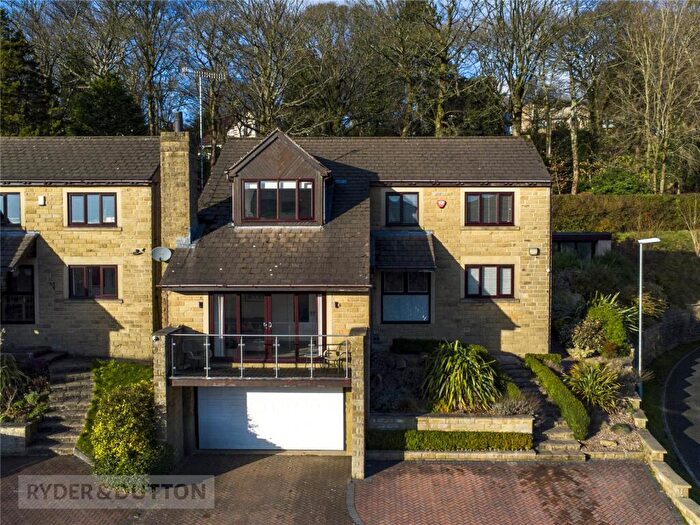
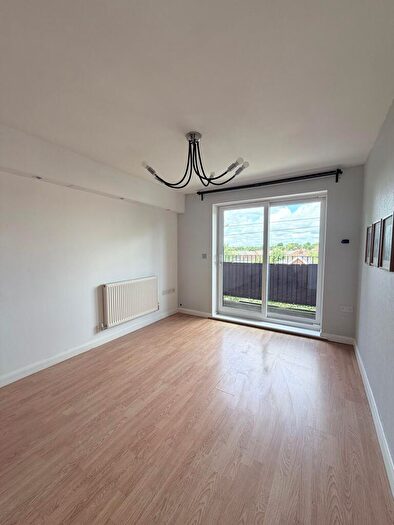
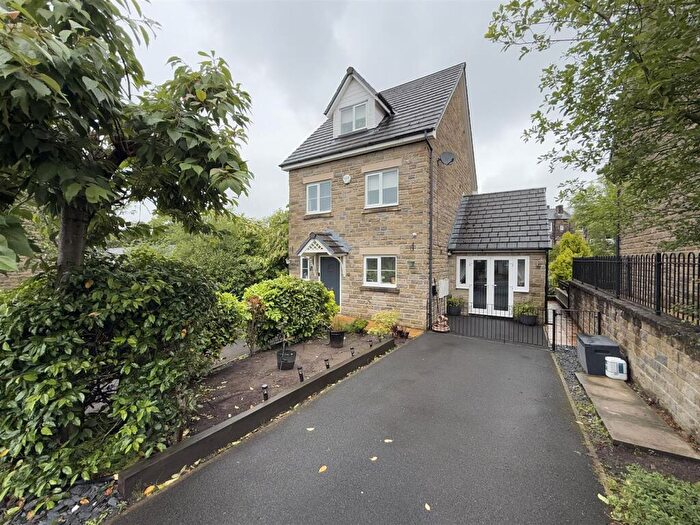
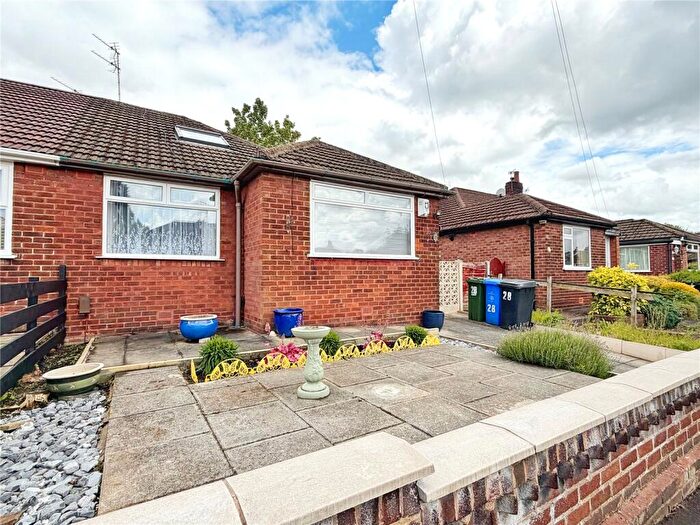
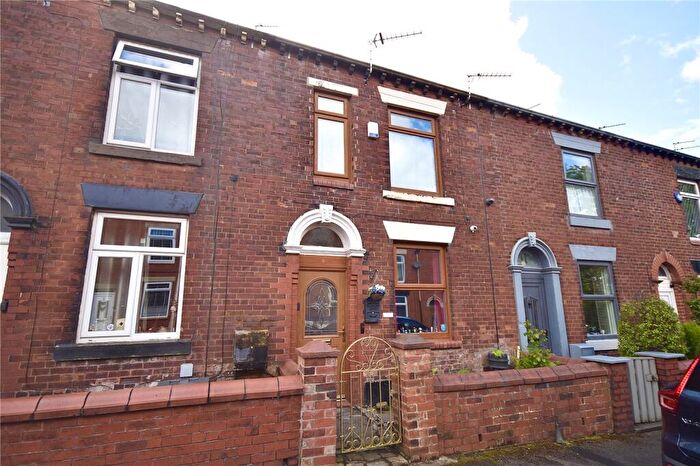
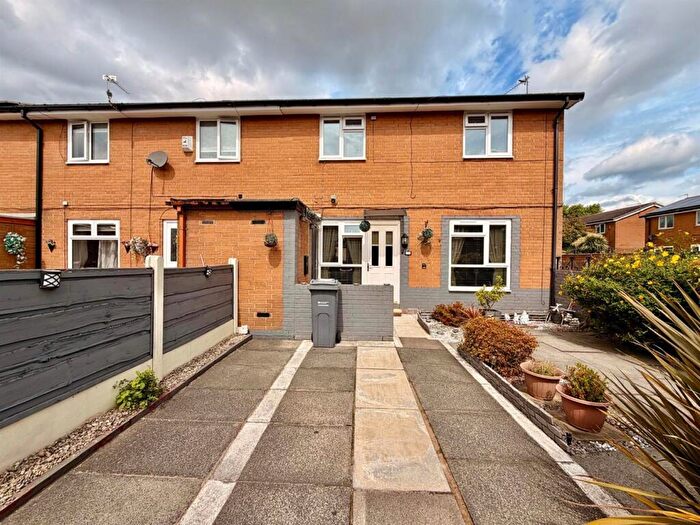
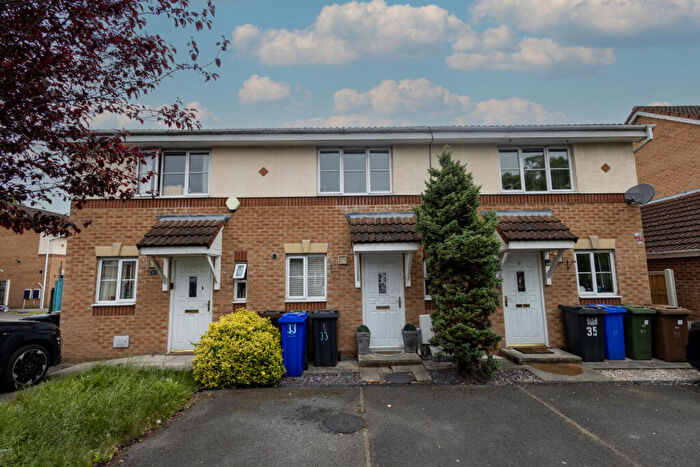
Properties for sale in Oldham
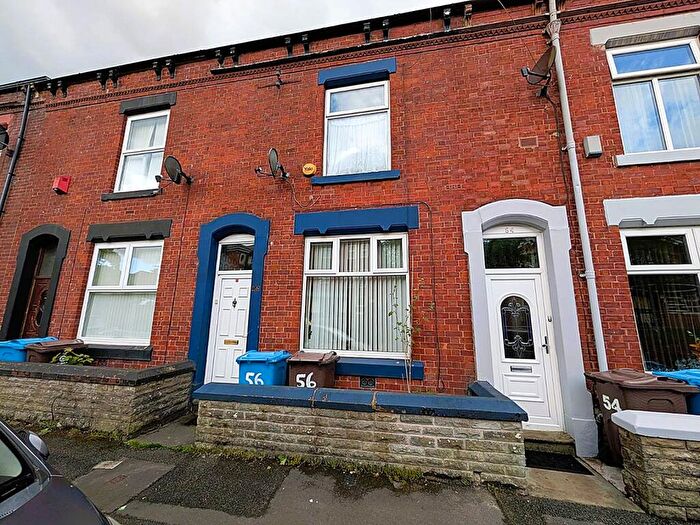

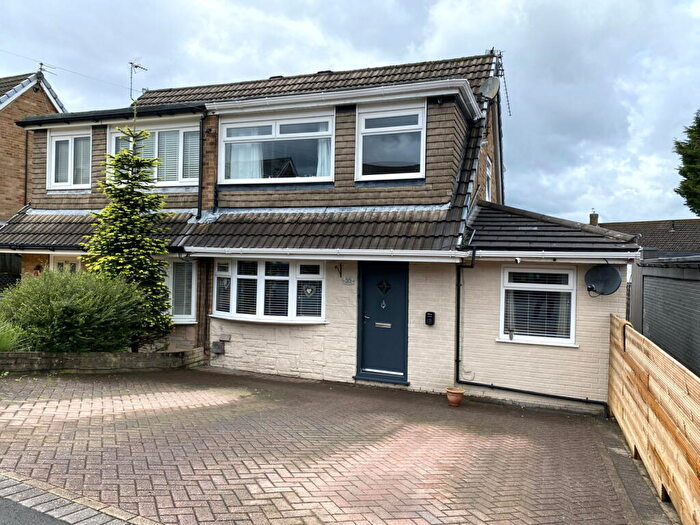
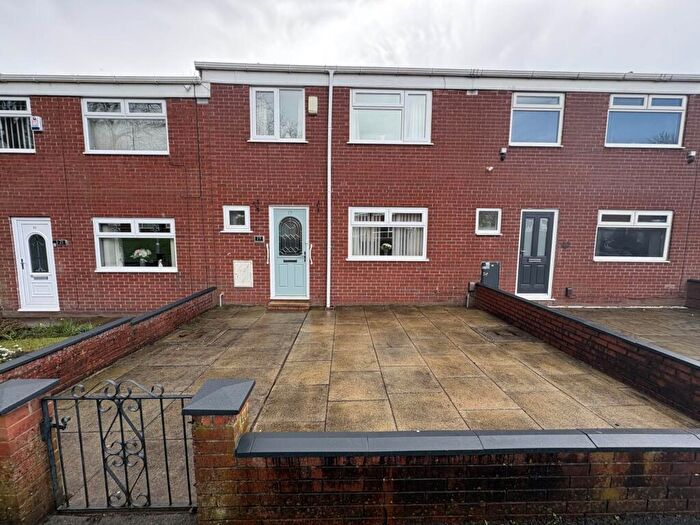
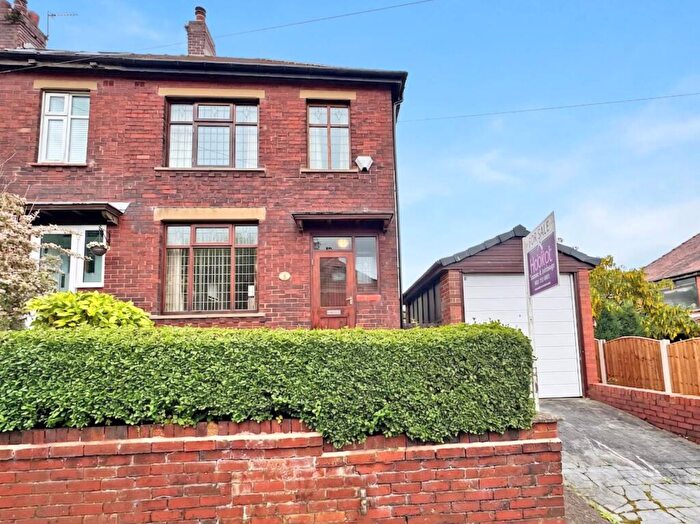
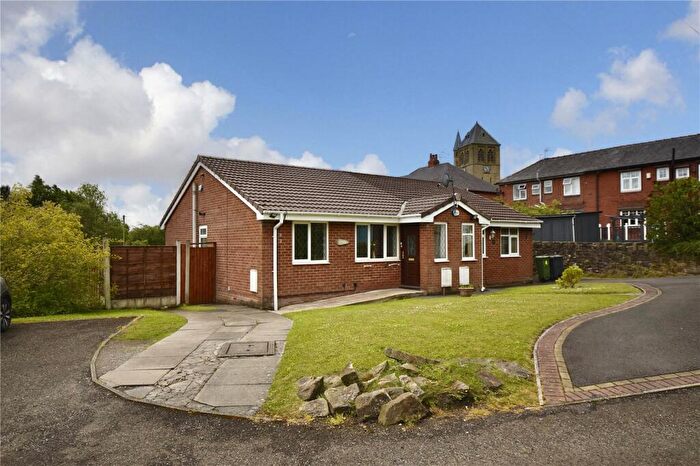
![]()
If you are looking to sell your house, let it out, or receive a property valuation, an expert can help you.
Click the button below to get started.
Towns in Oldham
Navigate through our locations to find the location of your next house in Oldham, England for sale or to rent.
Transport in Oldham
Please see below transportation links in this area:
-
 Mills Hill Station
 -
Moston Station
-
Mossley (Greater Manchester) Station
-
Ashton-Under-Lyne Station
-
Greenfield Station
-
Stalybridge Station
-
Castleton Station
-
Guide Bridge Station
- FAQ
- Price Paid By Year
- Property Type Price
Frequently asked questions about Oldham
What is the average price for a property for sale in Oldham?
The average price for a property for sale in Oldham is £207,114. This amount is 42% lower than the average price in England. There are more than 10,000 property listings for sale in Oldham.
What locations have the most expensive properties for sale in Oldham?
The location with the most expensive properties for sale in Oldham is Oldham at an average of £207,156.
What locations have the most affordable properties for sale in Oldham?
The location with the most affordable properties for sale in Oldham is Manchester at an average of £202,919.
Which train stations are available in or near Oldham?
Some of the train stations available in or near Oldham are Mills Hill, Moston and Mossley (Greater Manchester).
Property Price Paid in Oldham by Year
The average sold property price by year was:
| Year | Average Sold Price | Price Change |
Sold Properties
|
|---|---|---|---|
| 2026 | £216,788 | -1% |
352 Properties |
| 2025 | £219,418 | 6% |
2,630 Properties |
| 2024 | £205,791 | 6% |
2,719 Properties |
| 2023 | £193,188 | -1% |
2,310 Properties |
| 2022 | £195,596 | 5% |
3,121 Properties |
| 2021 | £186,543 | 12% |
3,667 Properties |
| 2020 | £165,056 | 7% |
2,763 Properties |
| 2019 | £153,002 | 4% |
3,323 Properties |
| 2018 | £146,207 | 2% |
3,120 Properties |
| 2017 | £143,609 | 3% |
3,313 Properties |
| 2016 | £138,847 | 5% |
3,081 Properties |
| 2015 | £131,221 | 1% |
2,705 Properties |
| 2014 | £130,125 | 4% |
2,728 Properties |
| 2013 | £124,333 | 3% |
2,097 Properties |
| 2012 | £120,914 | 1% |
1,676 Properties |
| 2011 | £120,242 | -7% |
1,784 Properties |
| 2010 | £128,573 | 5% |
1,944 Properties |
| 2009 | £121,806 | -7% |
1,859 Properties |
| 2008 | £130,489 | -0,5% |
2,472 Properties |
| 2007 | £131,084 | 7% |
4,580 Properties |
| 2006 | £122,412 | 12% |
4,751 Properties |
| 2005 | £107,873 | 13% |
3,931 Properties |
| 2004 | £94,383 | 20% |
4,699 Properties |
| 2003 | £75,380 | 15% |
4,882 Properties |
| 2002 | £64,190 | 13% |
4,854 Properties |
| 2001 | £56,093 | 7% |
4,141 Properties |
| 2000 | £52,228 | 0,5% |
4,034 Properties |
| 1999 | £51,984 | 3% |
4,035 Properties |
| 1998 | £50,392 | 5% |
3,779 Properties |
| 1997 | £47,760 | 5% |
3,549 Properties |
| 1996 | £45,251 | 3% |
3,508 Properties |
| 1995 | £44,061 | - |
2,914 Properties |
Property Price per Property Type in Oldham
Here you can find historic sold price data in order to help with your property search.
The average Property Paid Price for specific property types in the last three years are:
| Property Type | Average Sold Price | Sold Properties |
|---|---|---|
| Semi Detached House | £229,427.00 | 2,726 Semi Detached Houses |
| Terraced House | £158,225.00 | 4,013 Terraced Houses |
| Detached House | £386,876.00 | 885 Detached Houses |
| Flat | £145,808.00 | 387 Flats |