
Houses for sale & to rent in Banbury Neithrop, Banbury
House Prices in Banbury Neithrop
Properties in Banbury Neithrop have an average house price of £258,699.00 and had 228 Property Transactions within the last 3 years¹.
Banbury Neithrop is an area in Banbury, Oxfordshire with 2,139 households², where the most expensive property was sold for £518,000.00.
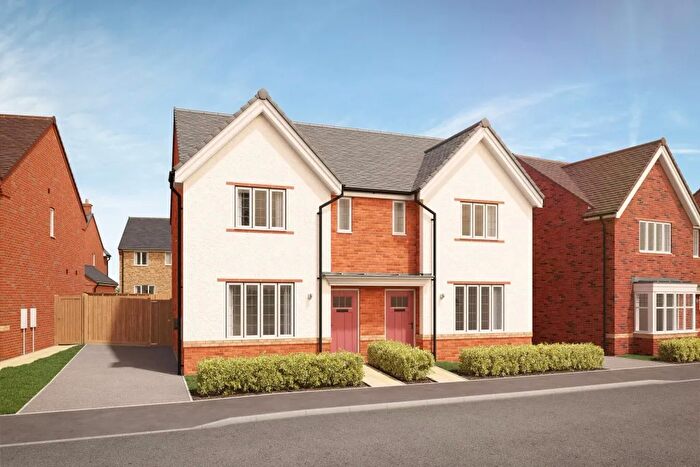
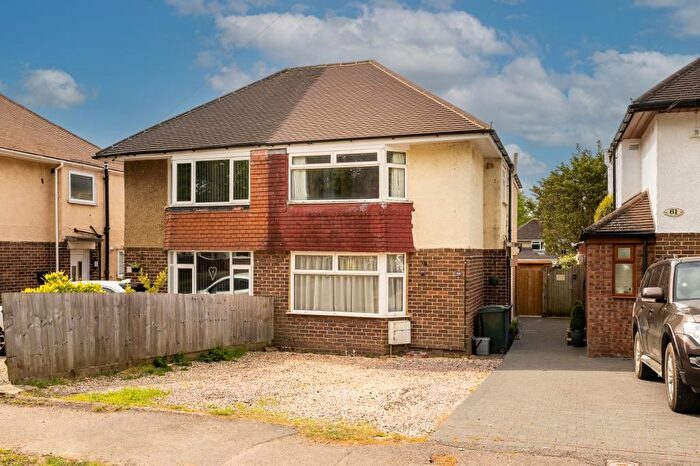
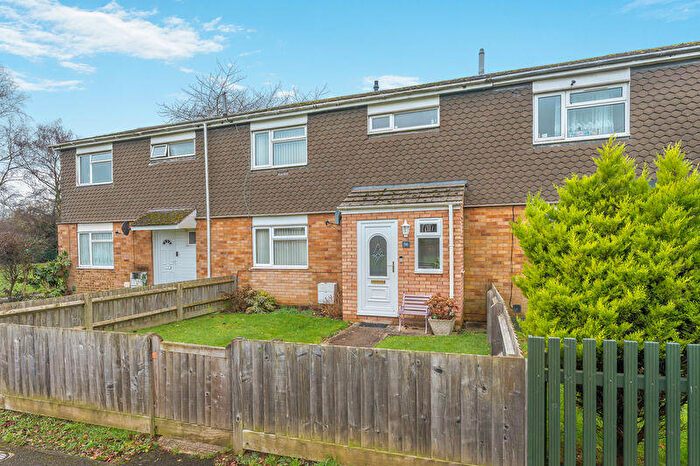
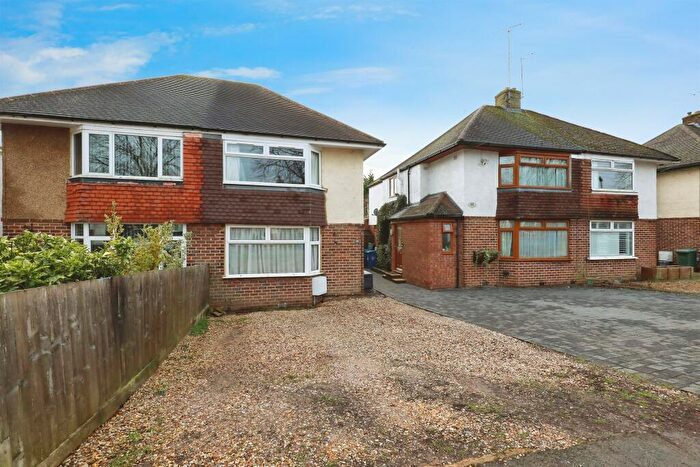
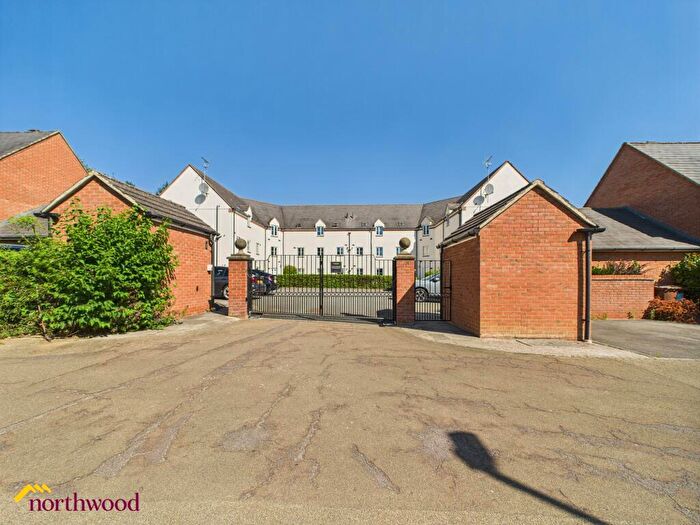
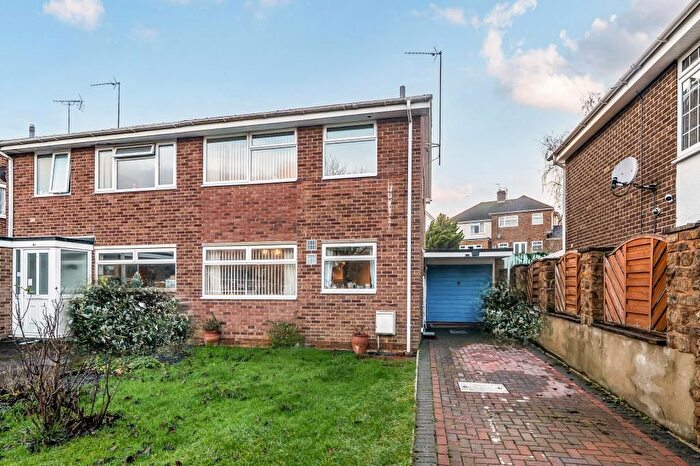
Properties for sale in Banbury Neithrop
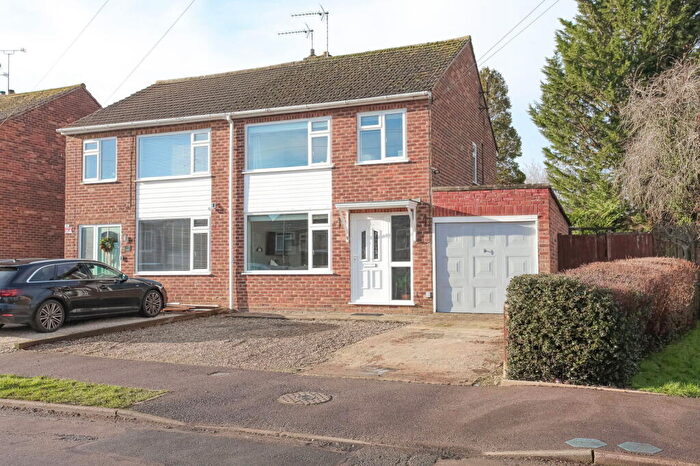
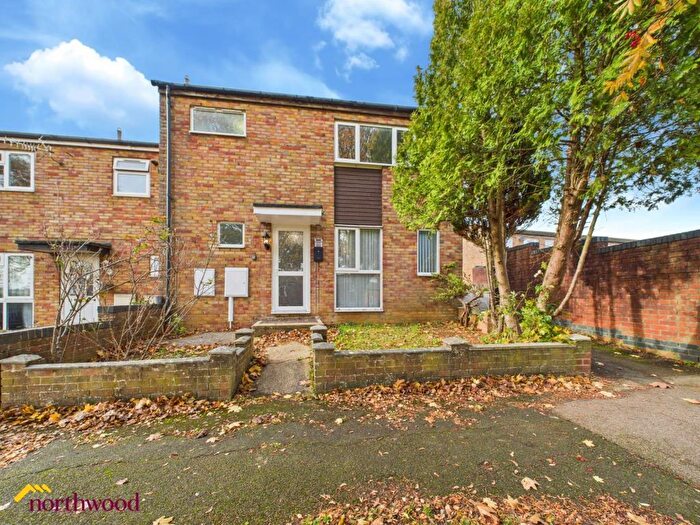
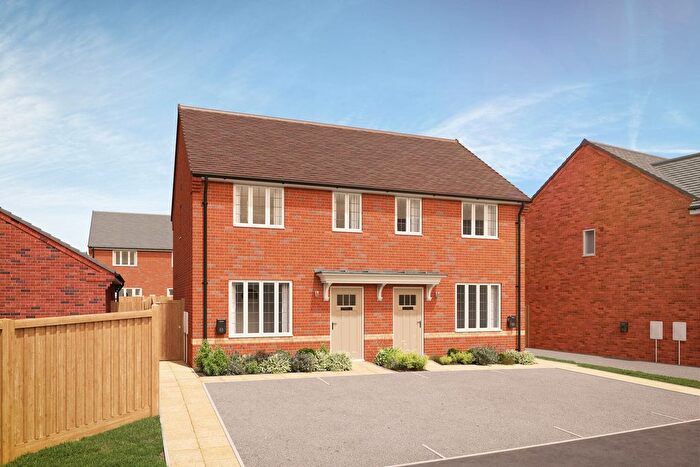
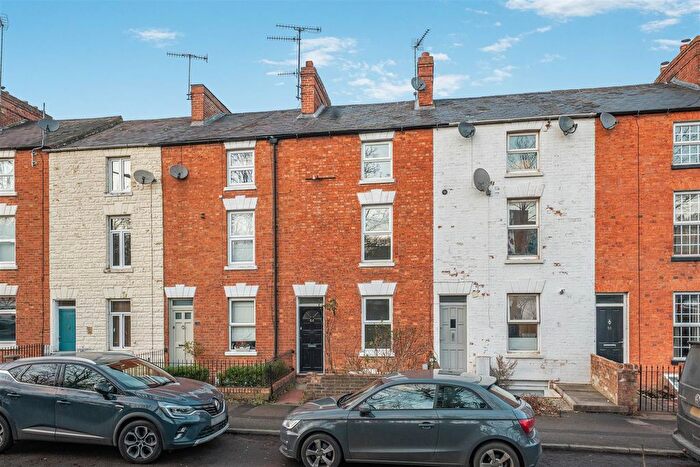
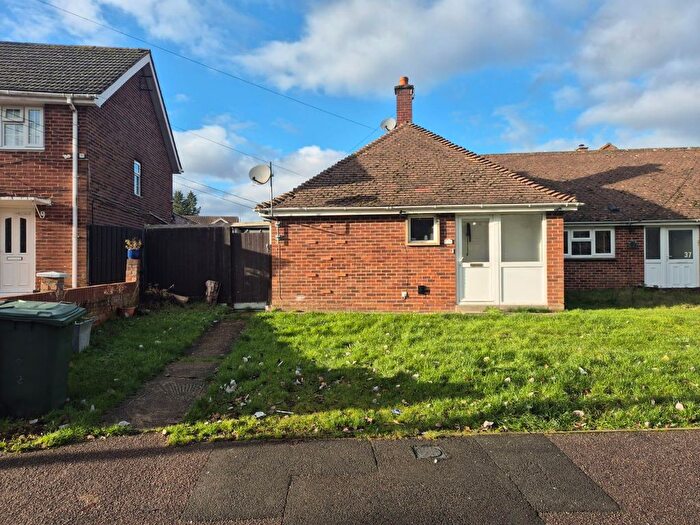

![]()
If you are looking to sell your house, let it out, or receive a property valuation, an expert can help you.
Click the button below to get started.


Roads and Postcodes in Banbury Neithrop
Navigate through our locations to find the location of your next house in Banbury Neithrop, Banbury for sale or to rent.
Transport near Banbury Neithrop
-
 Banbury Station
 -
King's Sutton Station
-
Heyford Station
-
Tackley Station
-
Bicester North Station
-
Charlbury Station
-
Bicester Village Station
- FAQ
- Price Paid By Year
- Property Type Price
Frequently asked questions about Banbury Neithrop
What is the average price for a property for sale in Banbury Neithrop?
The average price for a property for sale in Banbury Neithrop is £258,699. This amount is 26% lower than the average price in Banbury. There are 1,024 property listings for sale in Banbury Neithrop.
What streets have the most expensive properties for sale in Banbury Neithrop?
The streets with the most expensive properties for sale in Banbury Neithrop are Nursery Drive at an average of £335,514, Pinhill Road at an average of £323,500 and Neithrop Avenue at an average of £314,472.
What streets have the most affordable properties for sale in Banbury Neithrop?
The streets with the most affordable properties for sale in Banbury Neithrop are Orchard Way at an average of £168,333, Clarkes Court at an average of £181,400 and Parklands at an average of £189,771.
Which train stations are available in or near Banbury Neithrop?
Some of the train stations available in or near Banbury Neithrop are Banbury, King's Sutton and Heyford.
Property Price Paid in Banbury Neithrop by Year
The average sold property price by year was:
| Year | Average Sold Price | Price Change |
Sold Properties
|
|---|---|---|---|
| 2025 | £258,113 | -2% |
40 Properties |
| 2024 | £262,720 | 2% |
54 Properties |
| 2023 | £256,513 | -0,5% |
54 Properties |
| 2022 | £257,754 | 12% |
80 Properties |
| 2021 | £225,891 | 5% |
74 Properties |
| 2020 | £213,487 | 6% |
47 Properties |
| 2019 | £200,041 | -13% |
62 Properties |
| 2018 | £225,834 | 8% |
68 Properties |
| 2017 | £207,106 | -4% |
76 Properties |
| 2016 | £214,931 | 11% |
78 Properties |
| 2015 | £191,859 | 3% |
96 Properties |
| 2014 | £186,613 | 9% |
83 Properties |
| 2013 | £169,500 | 16% |
68 Properties |
| 2012 | £142,803 | -5% |
51 Properties |
| 2011 | £150,366 | 1% |
62 Properties |
| 2010 | £149,346 | 4% |
45 Properties |
| 2009 | £143,340 | -10% |
57 Properties |
| 2008 | £157,724 | -5% |
59 Properties |
| 2007 | £165,489 | 8% |
115 Properties |
| 2006 | £152,023 | 2% |
126 Properties |
| 2005 | £149,133 | 8% |
156 Properties |
| 2004 | £137,108 | 7% |
132 Properties |
| 2003 | £127,895 | 18% |
124 Properties |
| 2002 | £104,684 | 17% |
140 Properties |
| 2001 | £87,331 | 5% |
136 Properties |
| 2000 | £83,055 | 20% |
122 Properties |
| 1999 | £66,428 | 16% |
111 Properties |
| 1998 | £55,588 | 6% |
136 Properties |
| 1997 | £52,388 | 11% |
123 Properties |
| 1996 | £46,793 | 2% |
106 Properties |
| 1995 | £45,913 | - |
96 Properties |
Property Price per Property Type in Banbury Neithrop
Here you can find historic sold price data in order to help with your property search.
The average Property Paid Price for specific property types in the last three years are:
| Property Type | Average Sold Price | Sold Properties |
|---|---|---|
| Semi Detached House | £285,494.00 | 85 Semi Detached Houses |
| Terraced House | £255,858.00 | 118 Terraced Houses |
| Flat | £148,580.00 | 21 Flats |
| Detached House | £351,250.00 | 4 Detached Houses |