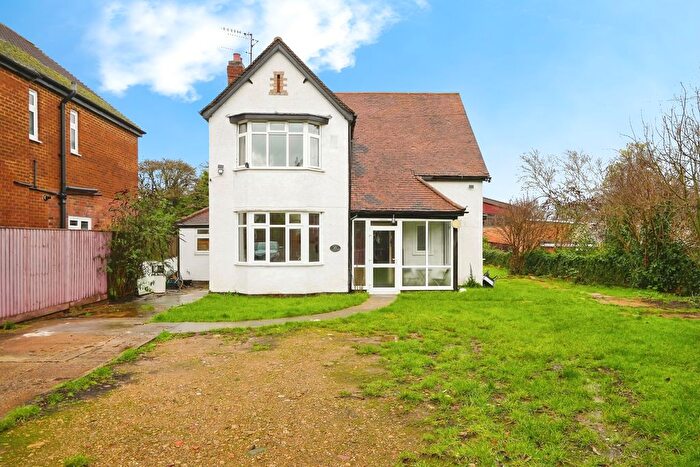
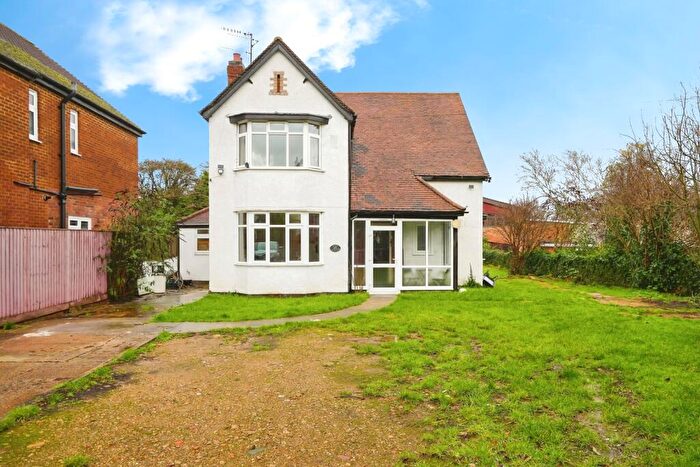
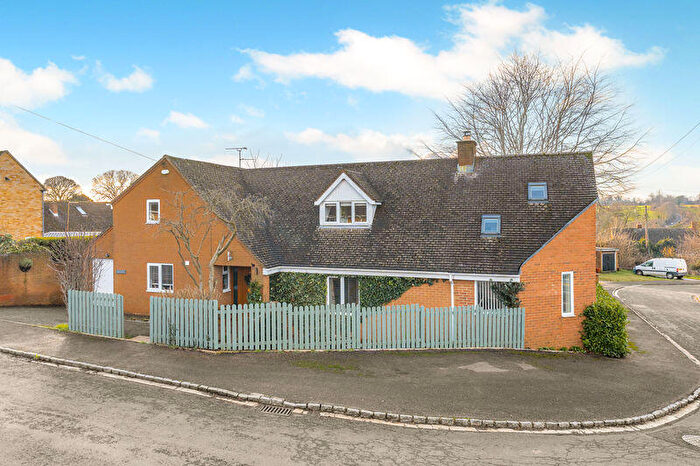
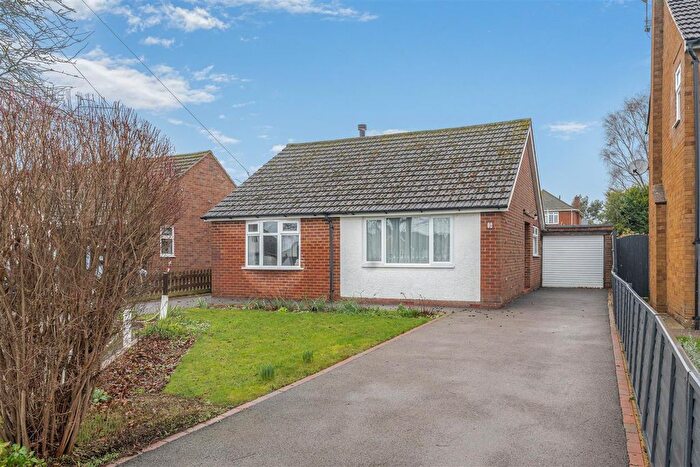
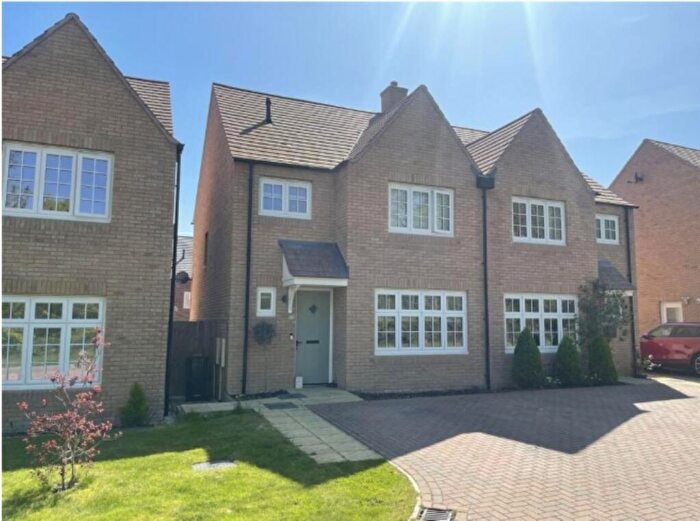
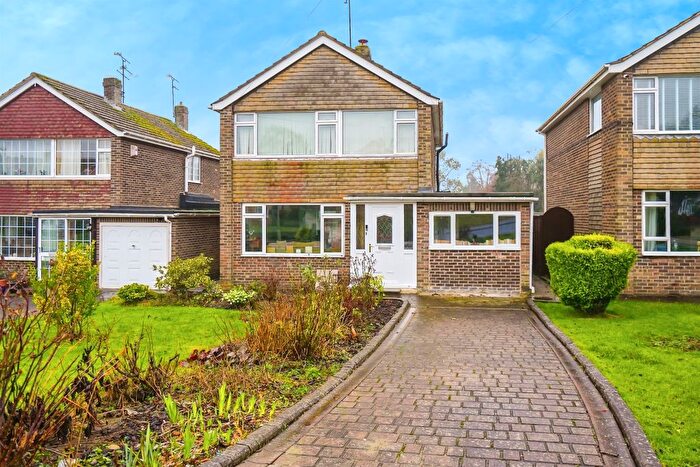
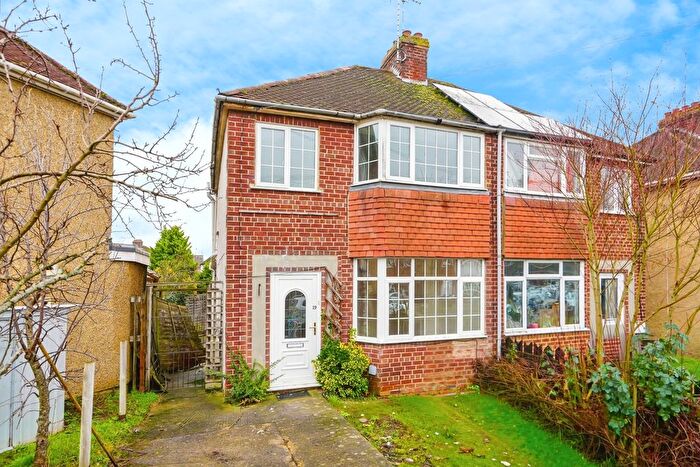
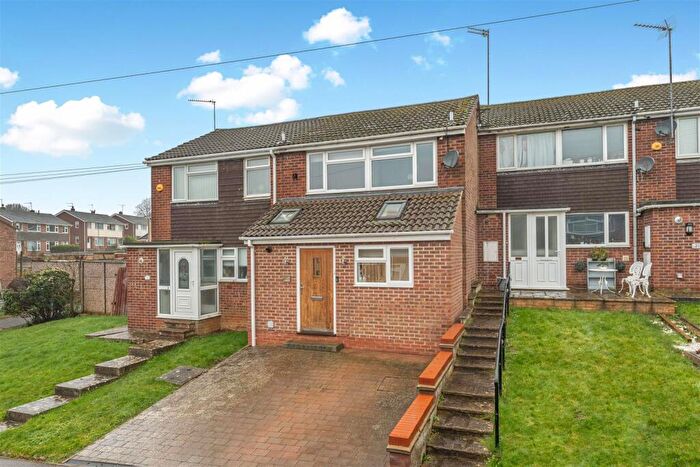
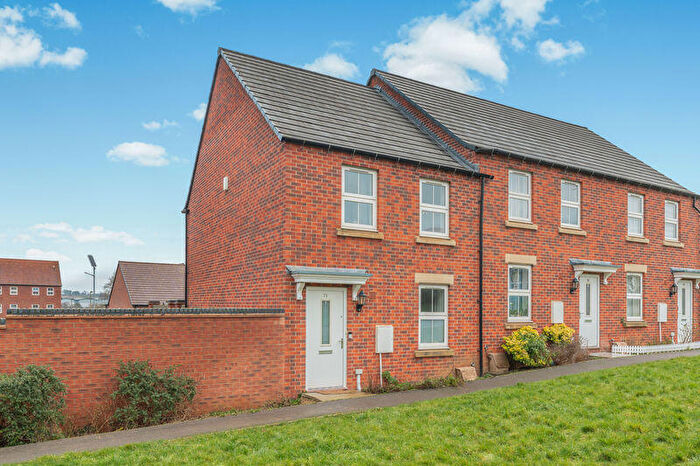
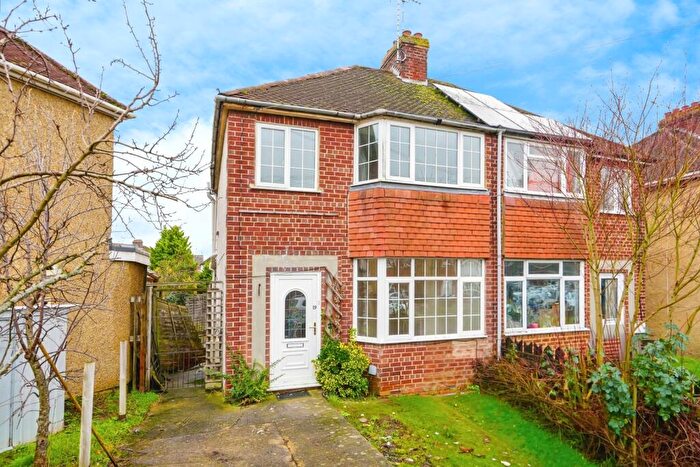
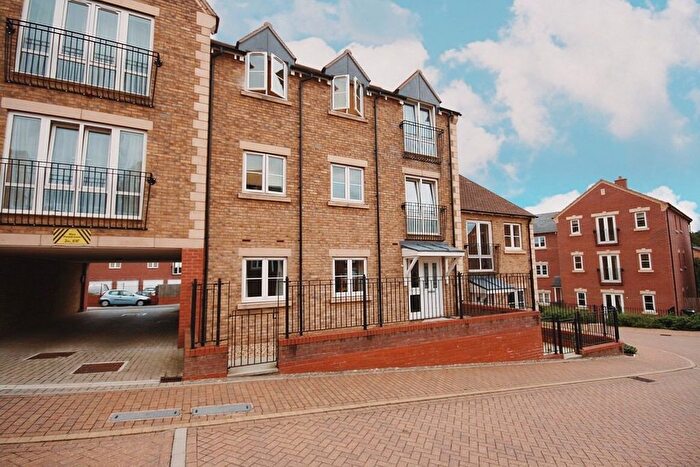
Houses for sale & to rent in Banbury, Oxfordshire
House Prices in Banbury
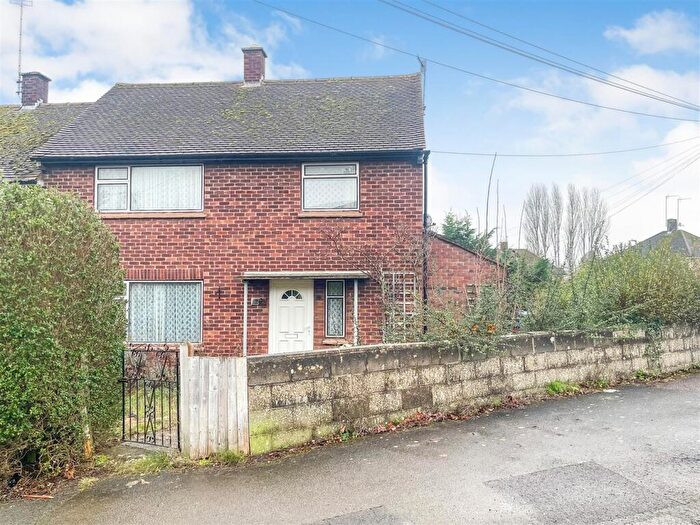
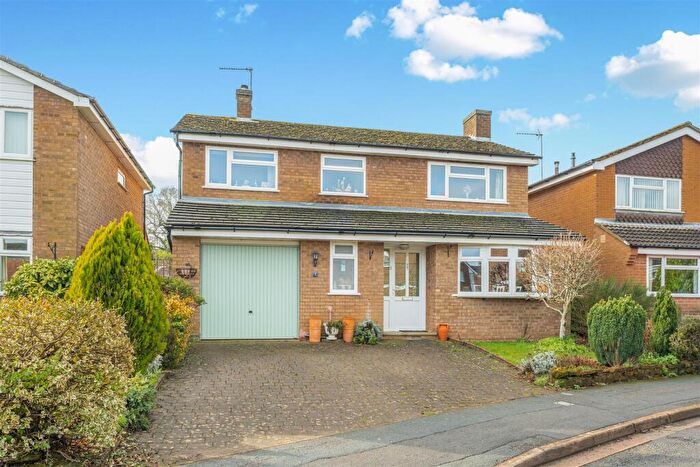
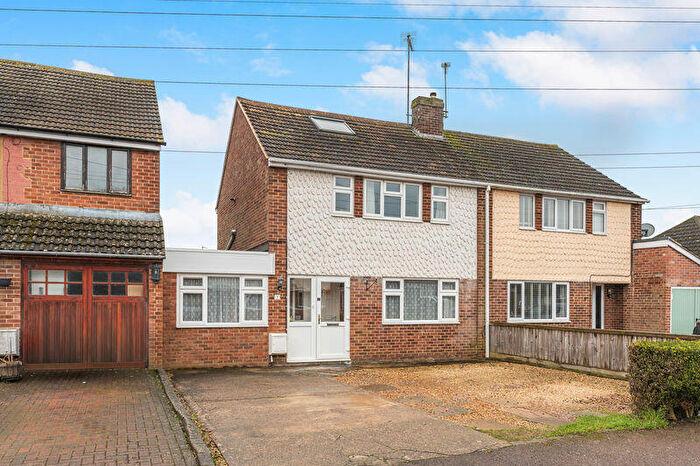
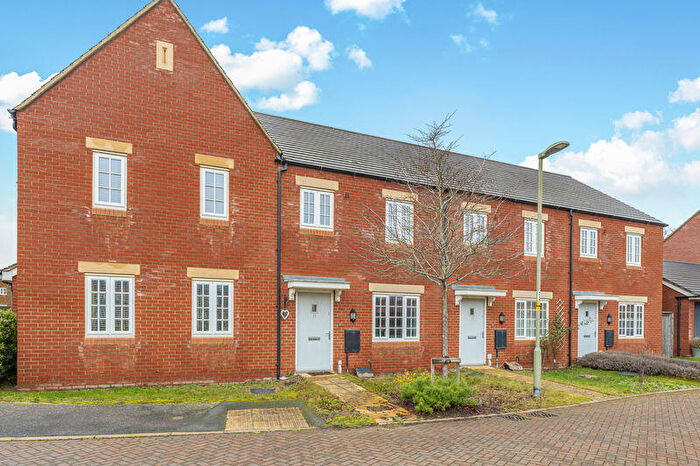
Properties in Banbury have an average house price of £346,157.00 and had 2,846 Property Transactions within the last 3 years.¹
Banbury is an area in Oxfordshire with 28,351 households², where the most expensive property was sold for £2,500,000.00.
Properties for sale in Banbury
Neighbourhoods in Banbury
Navigate through our locations to find the location of your next house in Banbury, Oxfordshire for sale or to rent.
- Adderbury
- Banbury Calthorpe
- Banbury Easington
- Banbury Grimsbury And Castle
- Banbury Hardwick
- Banbury Neithrop
- Banbury Ruscote
- Bloxham And Bodicote
- Cropredy
- Deddington
- Hook Norton
- Sibford
- Wroxton
- Adderbury, Bloxham and Bodicote
- Banbury Calthorpe and Easington
- Cropredy, Sibfords and Wroxton
- Banbury Grimsbury and Hightown
- Banbury Cross and Neithrop
Transport in Banbury
Please see below transportation links in this area:
- FAQ
- Price Paid By Year
- Property Type Price
Frequently asked questions about Banbury
What is the average price for a property for sale in Banbury?
The average price for a property for sale in Banbury is £346,157. This amount is 27% lower than the average price in Oxfordshire. There are more than 10,000 property listings for sale in Banbury.
What locations have the most expensive properties for sale in Banbury?
The locations with the most expensive properties for sale in Banbury are Wroxton at an average of £603,120, Sibford at an average of £602,953 and Hook Norton at an average of £564,517.
What locations have the most affordable properties for sale in Banbury?
The locations with the most affordable properties for sale in Banbury are Banbury Cross and Neithrop at an average of £211,014, Banbury Grimsbury And Castle at an average of £222,603 and Banbury Grimsbury and Hightown at an average of £237,600.
Which train stations are available in or near Banbury?
Some of the train stations available in or near Banbury are Banbury, King's Sutton and Heyford.
Property Price Paid in Banbury by Year
The average sold property price by year was:
| Year | Average Sold Price | Price Change |
Sold Properties
|
|---|---|---|---|
| 2025 | £351,969 | 4% |
905 Properties |
| 2024 | £339,040 | -3% |
1,018 Properties |
| 2023 | £348,308 | -3% |
923 Properties |
| 2022 | £357,208 | 2% |
1,278 Properties |
| 2021 | £351,268 | 7% |
1,678 Properties |
| 2020 | £324,967 | 6% |
1,181 Properties |
| 2019 | £306,656 | -2% |
1,453 Properties |
| 2018 | £314,123 | 3% |
1,474 Properties |
| 2017 | £303,744 | 5% |
1,453 Properties |
| 2016 | £288,678 | 10% |
1,506 Properties |
| 2015 | £260,840 | 1% |
1,360 Properties |
| 2014 | £259,258 | 9% |
1,317 Properties |
| 2013 | £235,899 | 1% |
1,090 Properties |
| 2012 | £233,836 | -5% |
833 Properties |
| 2011 | £246,188 | 5% |
865 Properties |
| 2010 | £234,254 | 11% |
920 Properties |
| 2009 | £208,581 | -7% |
932 Properties |
| 2008 | £222,795 | 4% |
802 Properties |
| 2007 | £214,402 | -1% |
1,754 Properties |
| 2006 | £216,114 | 10% |
1,804 Properties |
| 2005 | £194,665 | 1% |
1,644 Properties |
| 2004 | £192,839 | 8% |
1,608 Properties |
| 2003 | £177,802 | 16% |
1,563 Properties |
| 2002 | £149,892 | 12% |
1,732 Properties |
| 2001 | £132,244 | 11% |
1,792 Properties |
| 2000 | £117,812 | 16% |
1,449 Properties |
| 1999 | £99,462 | 11% |
1,835 Properties |
| 1998 | £88,440 | 9% |
1,577 Properties |
| 1997 | £80,296 | 8% |
1,780 Properties |
| 1996 | £73,556 | 0,1% |
1,493 Properties |
| 1995 | £73,502 | - |
1,259 Properties |
Property Price per Property Type in Banbury
Here you can find historic sold price data in order to help with your property search.
The average Property Paid Price for specific property types in the last three years are:
| Property Type | Average Sold Price | Sold Properties |
|---|---|---|
| Semi Detached House | £323,445.00 | 915 Semi Detached Houses |
| Terraced House | £284,356.00 | 748 Terraced Houses |
| Detached House | £525,054.00 | 790 Detached Houses |
| Flat | £157,046.00 | 393 Flats |

