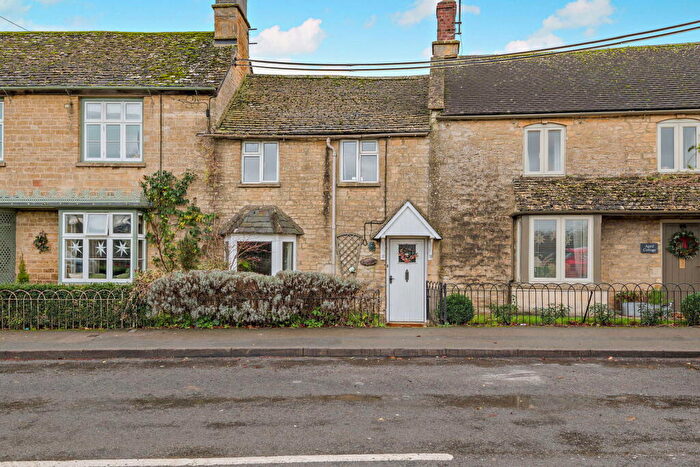
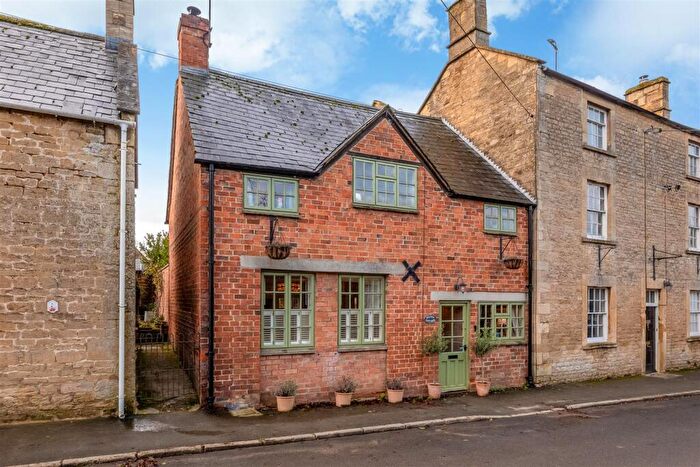
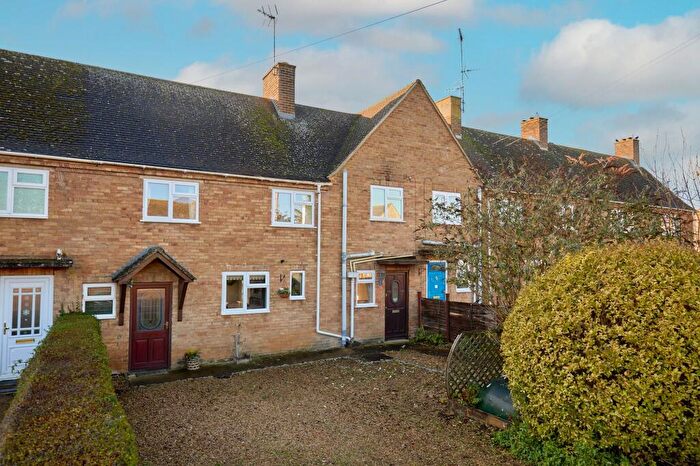
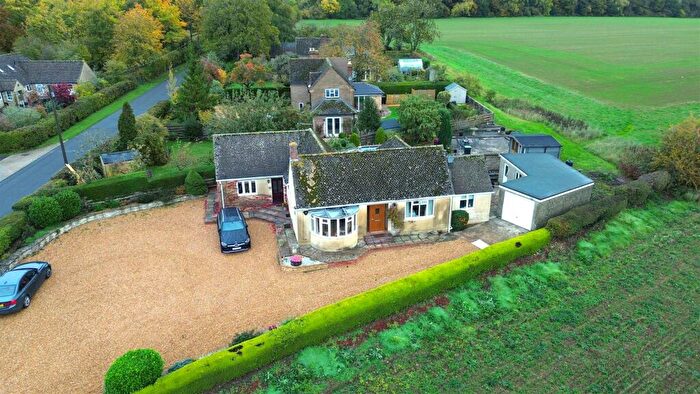
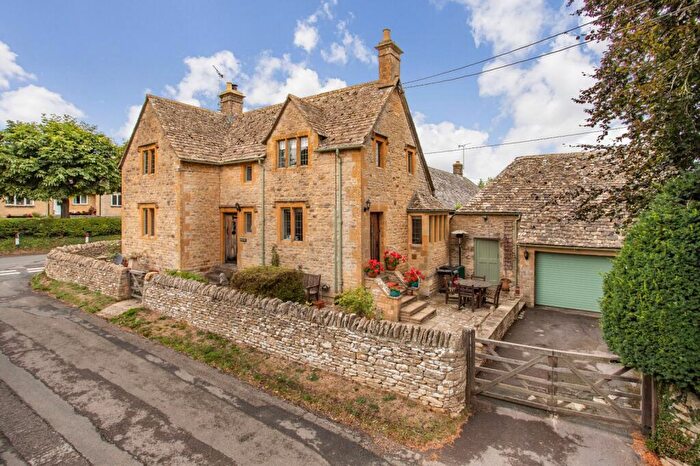
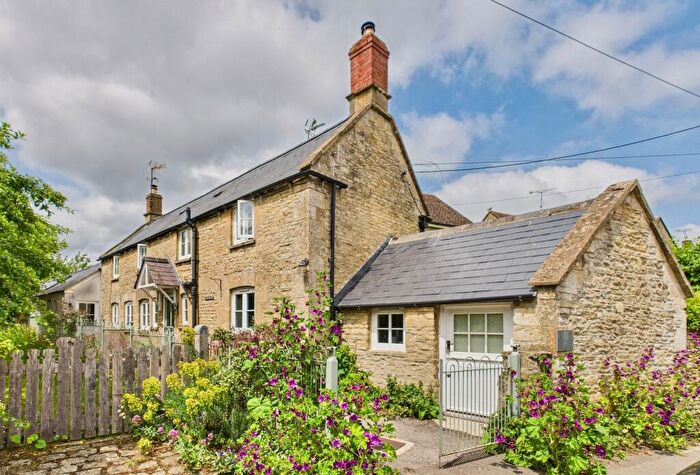
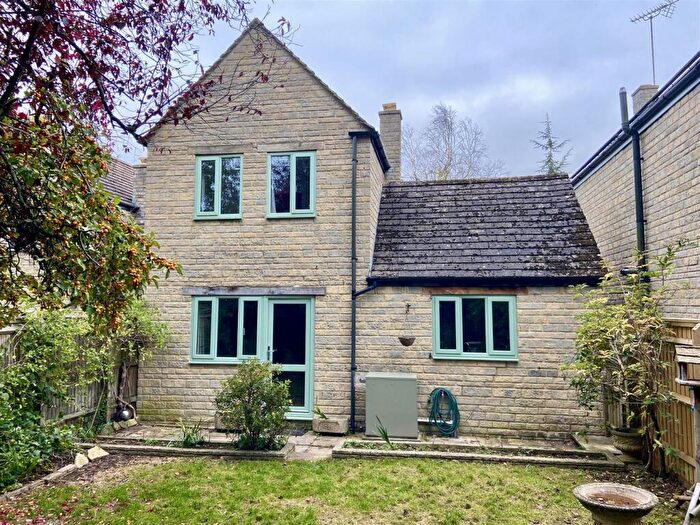
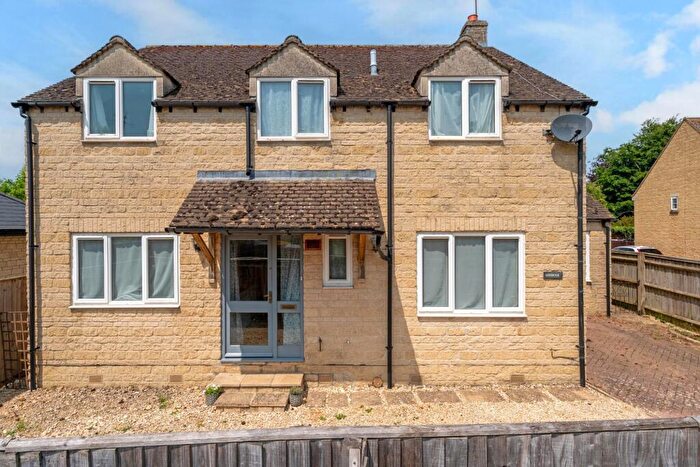
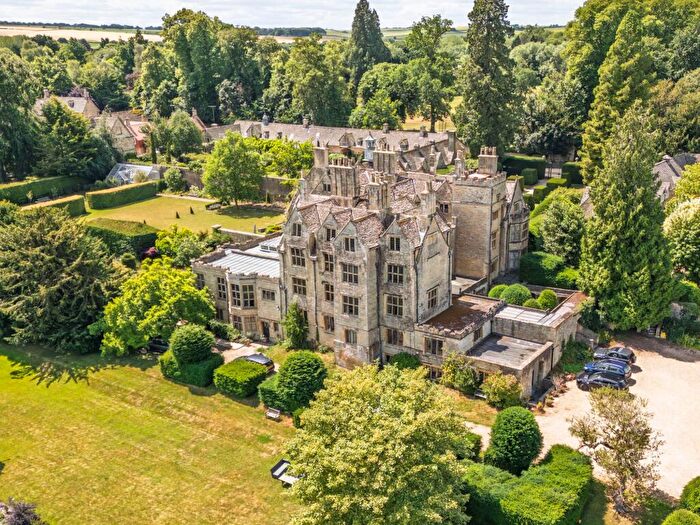
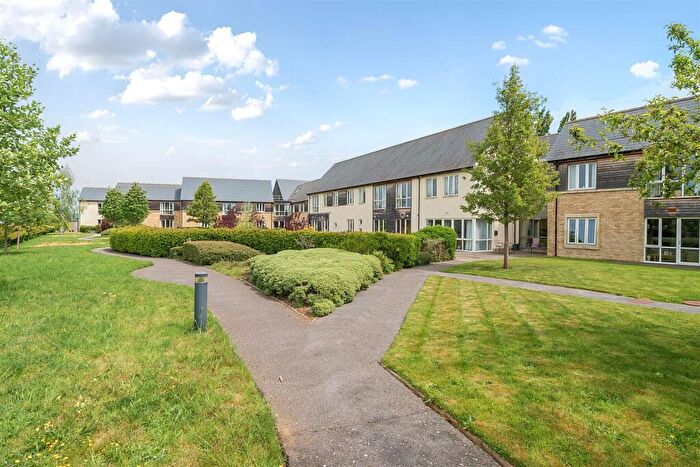
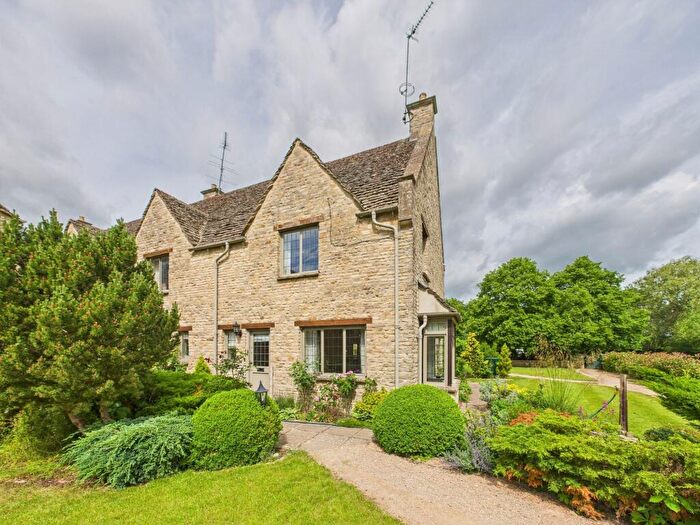
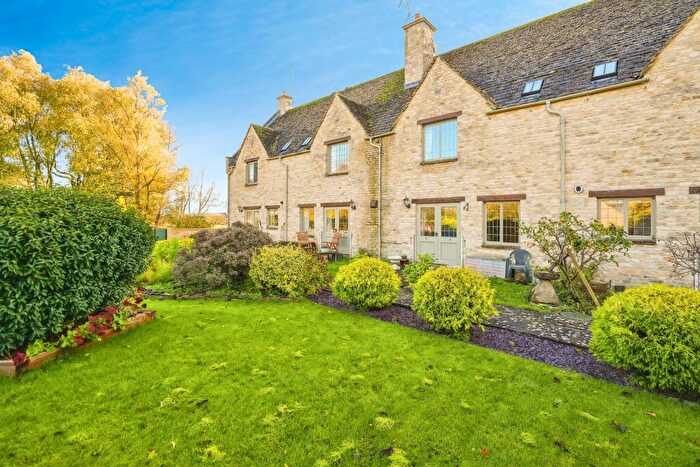
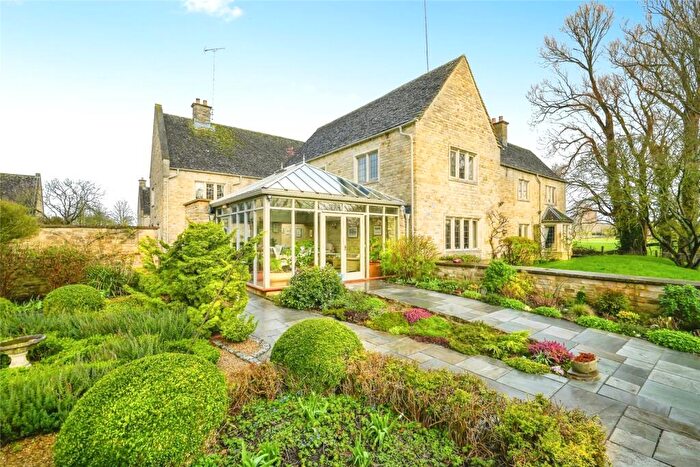
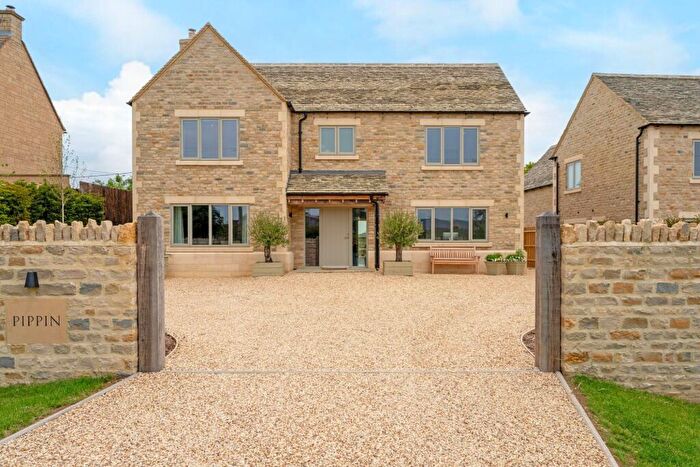
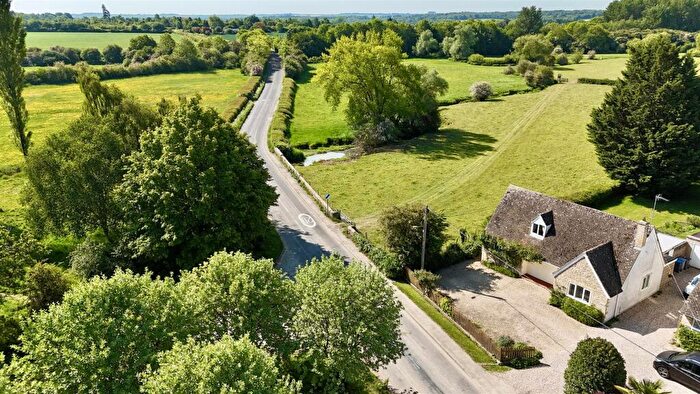
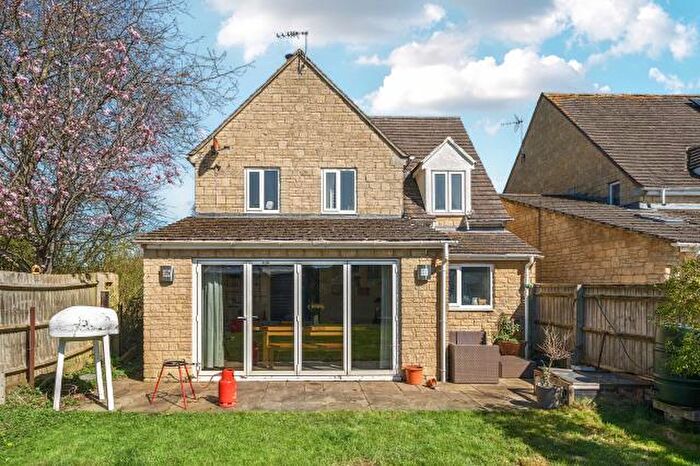
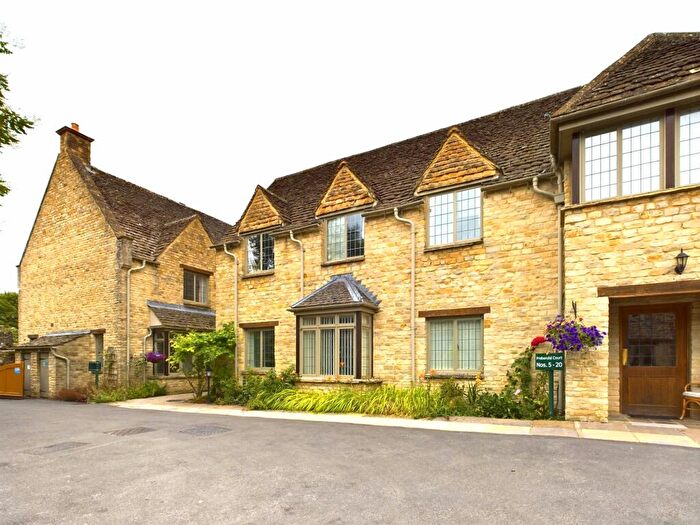
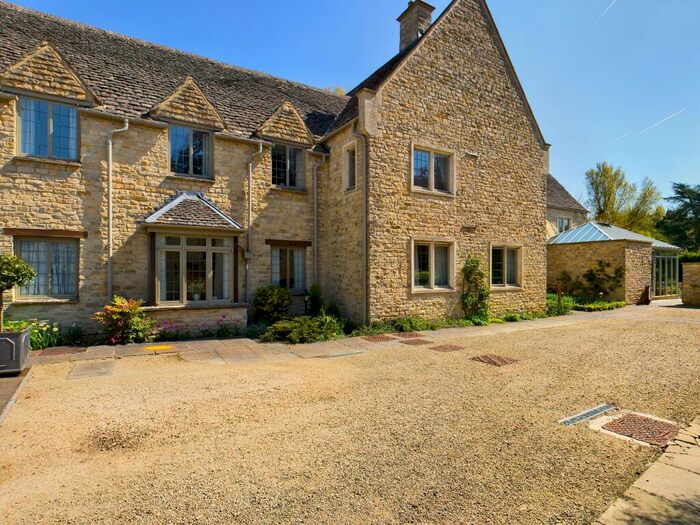
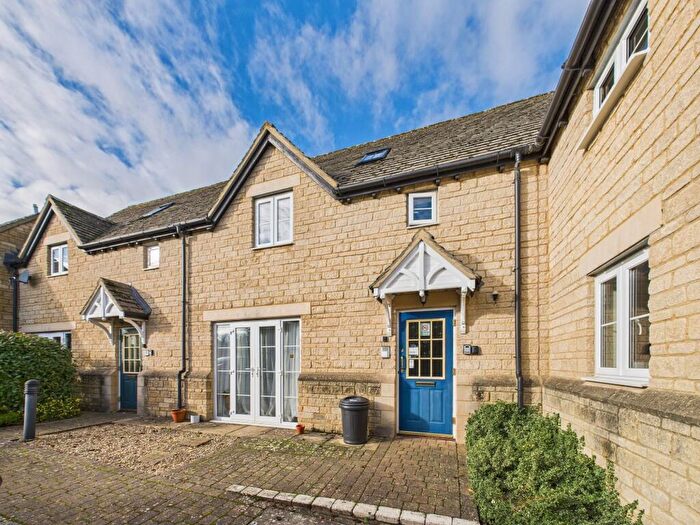
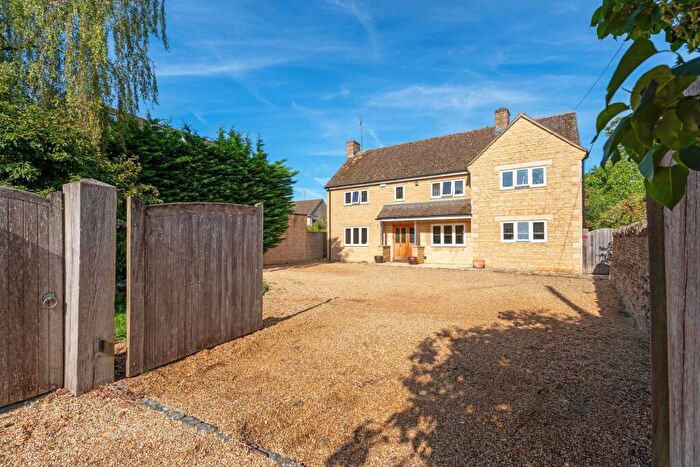
Houses for sale & to rent in Milton-under-wychwood, Chipping Norton
House Prices in Milton-under-wychwood
Properties in Milton-under-wychwood have an average house price of £522,400.00 and had 135 Property Transactions within the last 3 years¹.
Milton-under-wychwood is an area in Chipping Norton, Oxfordshire with 873 households², where the most expensive property was sold for £2,025,000.00.
Properties for sale in Milton-under-wychwood
Previously listed properties in Milton-under-wychwood
Roads and Postcodes in Milton-under-wychwood
Navigate through our locations to find the location of your next house in Milton-under-wychwood, Chipping Norton for sale or to rent.
| Streets | Postcodes |
|---|---|
| Ansell Way | OX7 6LU OX7 6YY OX7 6GZ |
| Bould Cottages | OX7 6RT |
| Brookfield Close | OX7 6JQ |
| Bruern Road | OX7 6HB OX7 6LL |
| Burford Road | OX7 6HY |
| Chestnut Lane | OX7 6RQ |
| Church Meadow | OX7 6JG |
| Church Road | OX7 6LF OX7 6LH OX7 6LJ OX7 6LQ |
| Church Street | OX7 6HF OX7 6HQ |
| Elm Grove | OX7 6EF |
| Far View | OX7 6SB |
| Fettiplace | OX7 6LT |
| Forest Close | OX7 6JD |
| Foxholes Cottages | OX7 6RN |
| Frog Lane | OX7 6JZ |
| Green Lane | OX7 6JY |
| Groves Industrial Estate | OX7 6JF OX7 6JP |
| High Street | OX7 6EN OX7 6ES OX7 6ET OX7 6HL OX7 6LA OX7 6LD OX7 6LE OX7 6EU |
| Idbury Road | OX7 6HW |
| Jubilee Lane | OX7 6EW OX7 6FG |
| Lime Grove | OX7 6SU |
| Lyneham Road | OX7 6LR OX7 6LW OX7 6LN OX7 6LP |
| New Cottages | OX7 6RJ |
| Orchard Ground | OX7 6HG |
| Peartree Close | OX7 6JX |
| Petrie Bungalows | OX7 6RS |
| Petrie Cottages | OX7 6RR OX7 6RZ |
| Poplar Farm Close | OX7 6LX |
| Quarry Ground | OX7 6HN |
| Reade Close | OX7 6LY |
| Shipton Road | OX7 6EE OX7 6JH OX7 6JL OX7 6JR OX7 6JS OX7 6JT OX7 6JU OX7 6JW OX7 6GF OX7 6SZ |
| Stable Yard | OX7 6QB |
| Stow Road | OX7 6HE OX7 6HP OX7 6HR |
| Sunnyview | OX7 6JJ |
| The Green | OX7 6HH OX7 6HJ |
| The Heath | OX7 6LG |
| The Sands | OX7 6EP OX7 6ER |
| The Square | OX7 6JN |
| The Terrace | OX7 6LB |
| Upper Milton | OX7 6EX OX7 6EY OX7 6EZ |
| Wellington Way | OX7 6RG |
| Wildbourne Close | OX7 6SY |
| Willow Close | OX7 6RF |
| Woodlands Close | OX7 6LS |
| Wychwood Close | OX7 6JB |
| Wychwood Drive | OX7 6JA |
| OX7 6HA OX7 6HD OX7 6QA OX7 6RH OX7 6RL OX7 6RP OX7 6RU OX7 6RW OX7 6FQ OX7 6HS OX7 6HT OX7 6HU OX7 6HZ OX7 6PY OX7 6QD OX7 6QE OX7 6QF OX7 6QG OX7 6RX OX7 6SA |
Transport near Milton-under-wychwood
- FAQ
- Price Paid By Year
- Property Type Price
Frequently asked questions about Milton-under-wychwood
What is the average price for a property for sale in Milton-under-wychwood?
The average price for a property for sale in Milton-under-wychwood is £522,400. This amount is 10% lower than the average price in Chipping Norton. There are 412 property listings for sale in Milton-under-wychwood.
What streets have the most expensive properties for sale in Milton-under-wychwood?
The streets with the most expensive properties for sale in Milton-under-wychwood are Idbury Road at an average of £2,025,000, Lyneham Road at an average of £1,745,000 and Bruern Road at an average of £1,187,500.
What streets have the most affordable properties for sale in Milton-under-wychwood?
The streets with the most affordable properties for sale in Milton-under-wychwood are Lime Grove at an average of £112,000, Chestnut Lane at an average of £114,000 and Jubilee Lane at an average of £169,600.
Which train stations are available in or near Milton-under-wychwood?
Some of the train stations available in or near Milton-under-wychwood are Shipton, Kingham and Ascott-Under-Wychwood.
Property Price Paid in Milton-under-wychwood by Year
The average sold property price by year was:
| Year | Average Sold Price | Price Change |
Sold Properties
|
|---|---|---|---|
| 2025 | £579,580 | 18% |
25 Properties |
| 2024 | £476,063 | -16% |
44 Properties |
| 2023 | £550,829 | 6% |
27 Properties |
| 2022 | £518,341 | -9% |
39 Properties |
| 2021 | £563,321 | 24% |
54 Properties |
| 2020 | £427,776 | 16% |
47 Properties |
| 2019 | £357,312 | -4% |
23 Properties |
| 2018 | £371,803 | -29% |
28 Properties |
| 2017 | £480,997 | 21% |
35 Properties |
| 2016 | £379,698 | 6% |
49 Properties |
| 2015 | £355,922 | 14% |
49 Properties |
| 2014 | £307,449 | 8% |
30 Properties |
| 2013 | £281,879 | 8% |
27 Properties |
| 2012 | £259,789 | -11% |
19 Properties |
| 2011 | £288,756 | -1% |
23 Properties |
| 2010 | £290,741 | 16% |
28 Properties |
| 2009 | £243,053 | -24% |
24 Properties |
| 2008 | £300,708 | 2% |
18 Properties |
| 2007 | £294,823 | 9% |
46 Properties |
| 2006 | £267,386 | 2% |
76 Properties |
| 2005 | £262,795 | -3% |
50 Properties |
| 2004 | £271,421 | 14% |
31 Properties |
| 2003 | £232,989 | 1% |
30 Properties |
| 2002 | £229,733 | 12% |
51 Properties |
| 2001 | £202,462 | 4% |
34 Properties |
| 2000 | £194,719 | 17% |
55 Properties |
| 1999 | £161,218 | 7% |
57 Properties |
| 1998 | £150,182 | 22% |
37 Properties |
| 1997 | £116,679 | 22% |
36 Properties |
| 1996 | £90,501 | -4% |
37 Properties |
| 1995 | £94,058 | - |
30 Properties |
Property Price per Property Type in Milton-under-wychwood
Here you can find historic sold price data in order to help with your property search.
The average Property Paid Price for specific property types in the last three years are:
| Property Type | Average Sold Price | Sold Properties |
|---|---|---|
| Semi Detached House | £386,602.00 | 43 Semi Detached Houses |
| Detached House | £802,639.00 | 50 Detached Houses |
| Terraced House | £420,035.00 | 28 Terraced Houses |
| Flat | £143,365.00 | 14 Flats |

