
Houses for sale & to rent in Chipping Norton, Oxfordshire
House Prices in Chipping Norton
Properties in Chipping Norton have an average house price of £588k and had 1,040 Property Transactions within the last 3 years.¹
Chipping Norton is an area in Oxfordshire with 9,512 households², where the most expensive property was sold for £16.5M.
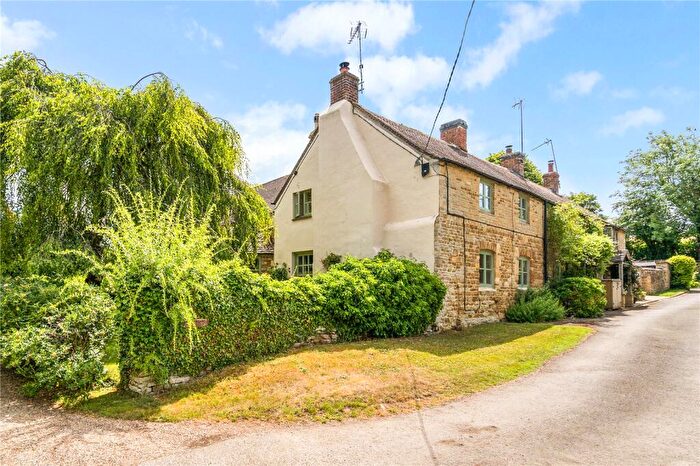
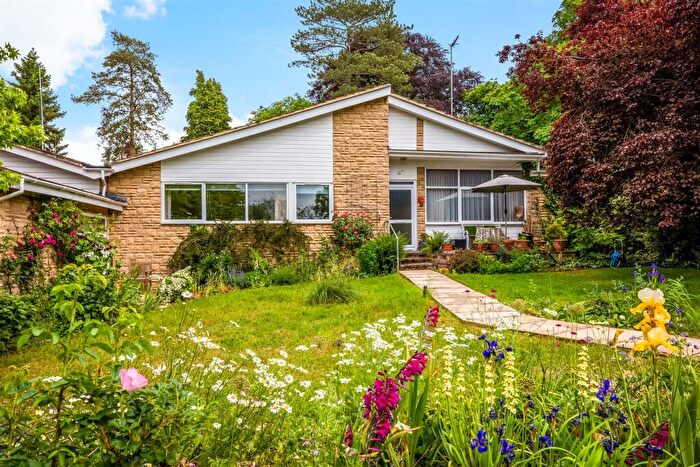
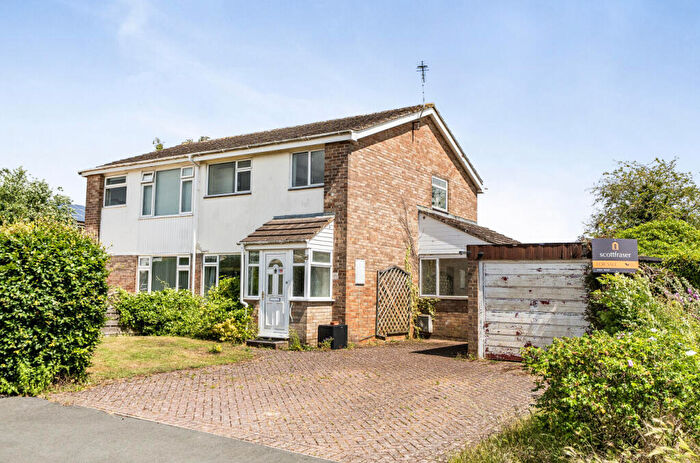
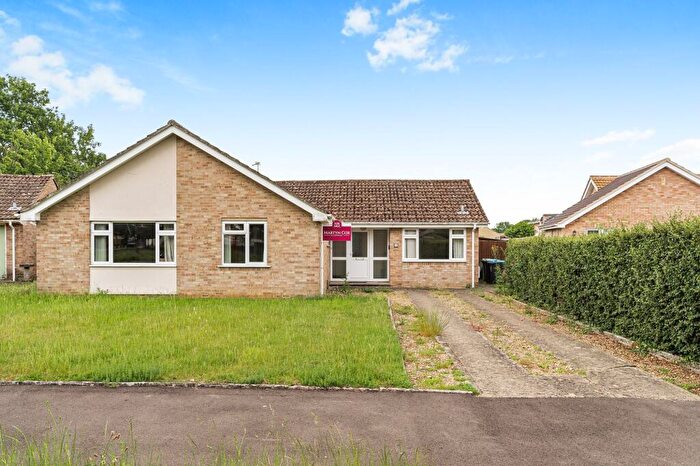
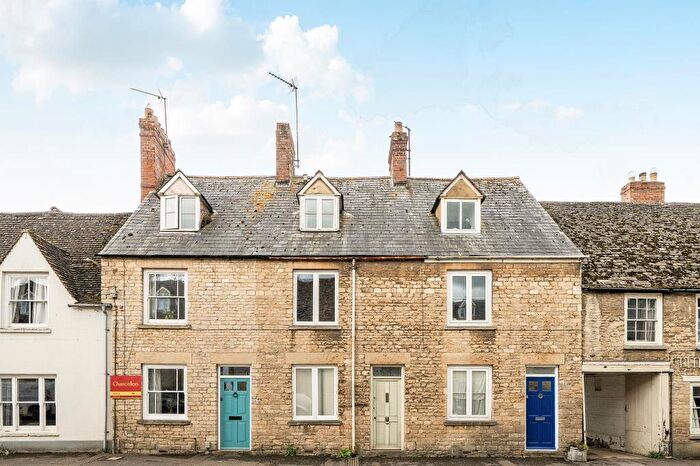
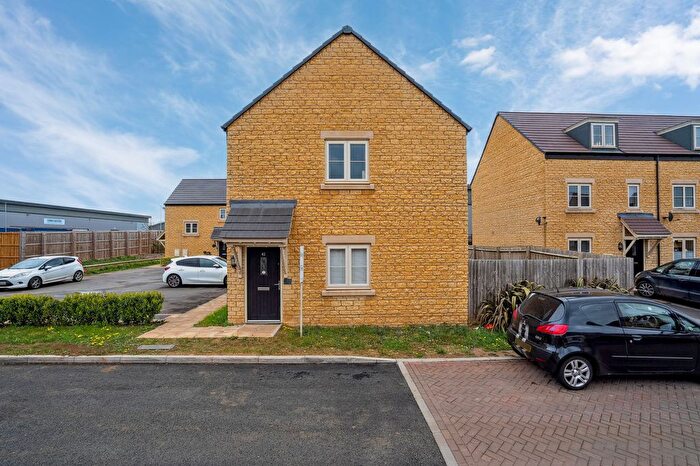
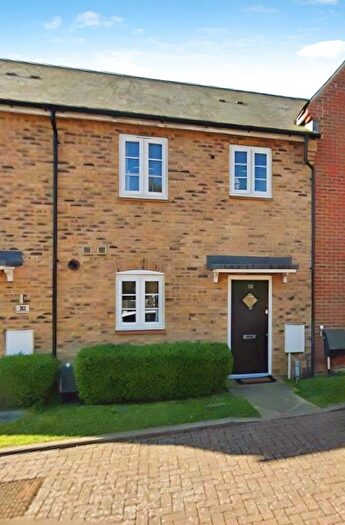
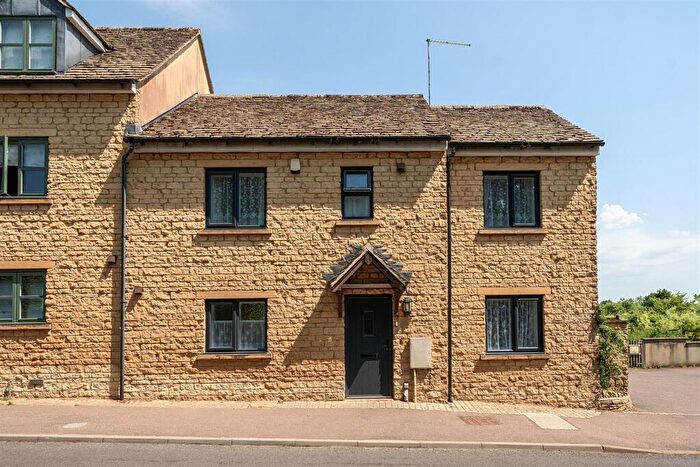
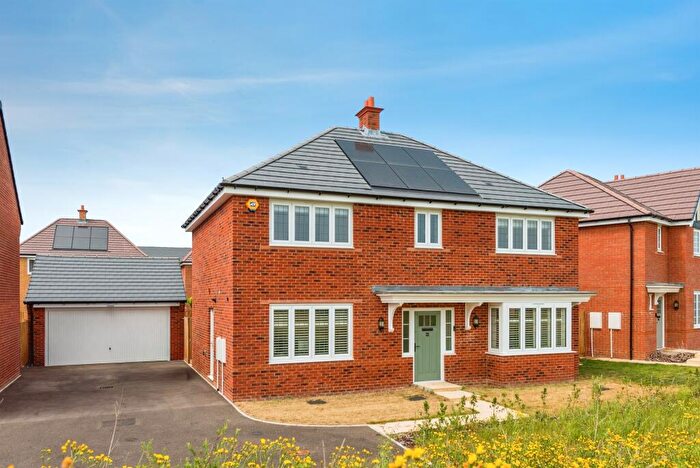
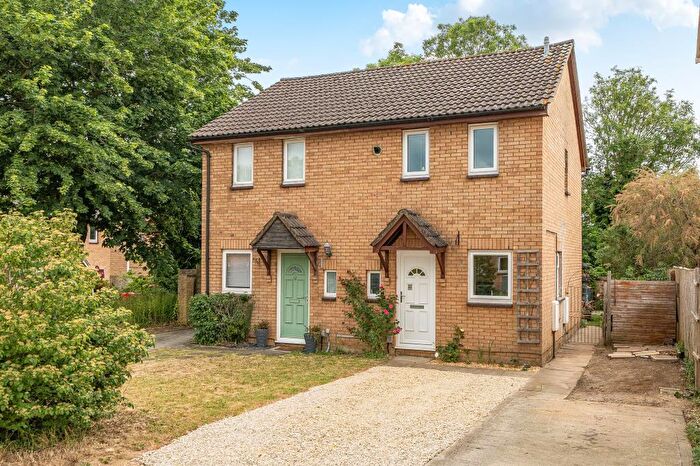
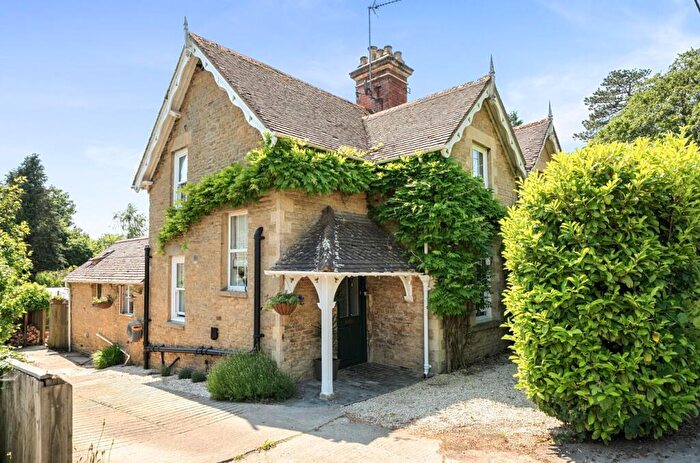
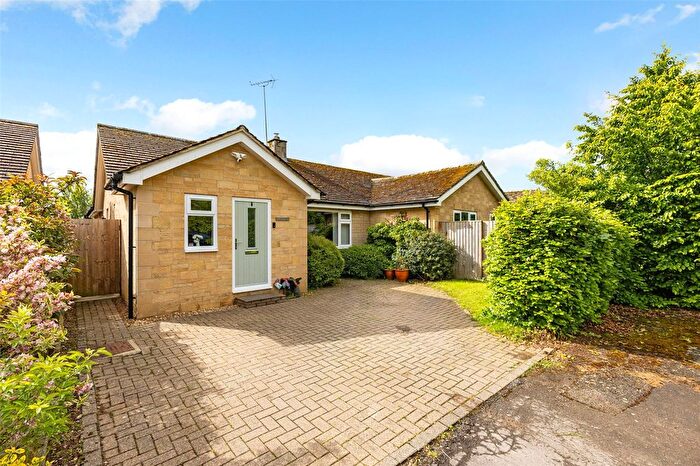
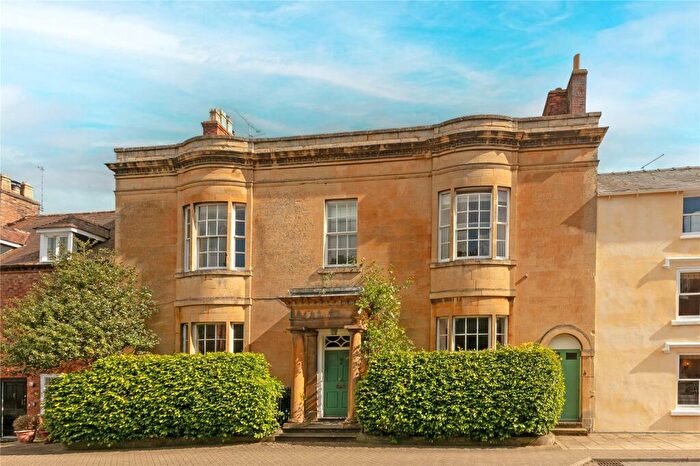
Properties for sale in Chipping Norton
![]()
If you are looking to sell your house, let it out, or receive a property valuation, an expert can help you.
Click the button below to get started.

Neighbourhoods in Chipping Norton
Navigate through our locations to find the location of your next house in Chipping Norton, Oxfordshire for sale or to rent.
Transport in Chipping Norton
Please see below transportation links in this area:

- FAQ
- Price Paid By Year
- Property Type Price
Frequently asked questions about Chipping Norton
What is the average price for a property for sale in Chipping Norton?
The average price for a property for sale in Chipping Norton is £587,909. This amount is 23% higher than the average price in Oxfordshire. There are 9,975 property listings for sale in Chipping Norton.
What locations have the most expensive properties for sale in Chipping Norton?
The locations with the most expensive properties for sale in Chipping Norton are Hailey, Minster Lovell And Leafield at an average of £1,638,545, Kingham, Rollright And Enstone at an average of £908,117 and Chadlington And Churchill at an average of £809,165.
What locations have the most affordable properties for sale in Chipping Norton?
The locations with the most affordable properties for sale in Chipping Norton are Chipping Norton at an average of £372,178, Milton-under-wychwood at an average of £532,063 and The Bartons at an average of £572,458.
Which train stations are available in or near Chipping Norton?
Some of the train stations available in or near Chipping Norton are Charlbury, Ascott-Under-Wychwood and Shipton.
Property Price Paid in Chipping Norton by Year
The average sold property price by year was:
| Year | Average Sold Price | Price Change |
Sold Properties
|
|---|---|---|---|
| 2026 | £727,104 | 21% |
24 Properties |
| 2025 | £572,525 | -9% |
323 Properties |
| 2024 | £622,635 | 11% |
373 Properties |
| 2023 | £552,519 | -1% |
320 Properties |
| 2022 | £559,247 | 4% |
394 Properties |
| 2021 | £535,858 | 14% |
586 Properties |
| 2020 | £460,975 | 7% |
403 Properties |
| 2019 | £429,380 | 2% |
406 Properties |
| 2018 | £421,919 | 3% |
423 Properties |
| 2017 | £411,202 | 5% |
460 Properties |
| 2016 | £389,664 | 7% |
424 Properties |
| 2015 | £362,783 | -3% |
406 Properties |
| 2014 | £372,408 | 13% |
418 Properties |
| 2013 | £325,760 | 3% |
375 Properties |
| 2012 | £316,040 | 4% |
319 Properties |
| 2011 | £303,364 | -18% |
325 Properties |
| 2010 | £358,131 | 23% |
330 Properties |
| 2009 | £274,033 | -10% |
298 Properties |
| 2008 | £300,278 | -4% |
270 Properties |
| 2007 | £313,436 | 5% |
525 Properties |
| 2006 | £296,907 | 10% |
652 Properties |
| 2005 | £267,128 | -1% |
392 Properties |
| 2004 | £269,078 | 6% |
454 Properties |
| 2003 | £252,438 | 11% |
447 Properties |
| 2002 | £223,965 | 10% |
536 Properties |
| 2001 | £200,665 | 11% |
502 Properties |
| 2000 | £179,590 | 14% |
465 Properties |
| 1999 | £154,186 | 16% |
576 Properties |
| 1998 | £129,537 | 9% |
425 Properties |
| 1997 | £117,662 | 17% |
478 Properties |
| 1996 | £97,904 | 2% |
501 Properties |
| 1995 | £96,363 | - |
378 Properties |
Property Price per Property Type in Chipping Norton
Here you can find historic sold price data in order to help with your property search.
The average Property Paid Price for specific property types in the last three years are:
| Property Type | Average Sold Price | Sold Properties |
|---|---|---|
| Semi Detached House | £486,232.00 | 269 Semi Detached Houses |
| Detached House | £890,721.00 | 382 Detached Houses |
| Terraced House | £420,523.00 | 262 Terraced Houses |
| Flat | £237,764.00 | 127 Flats |