Houses for sale & to rent in Craven, Faringdon
House Prices in Craven
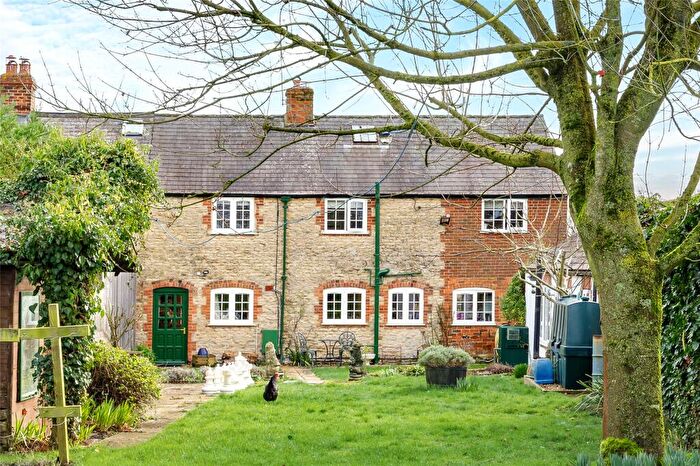
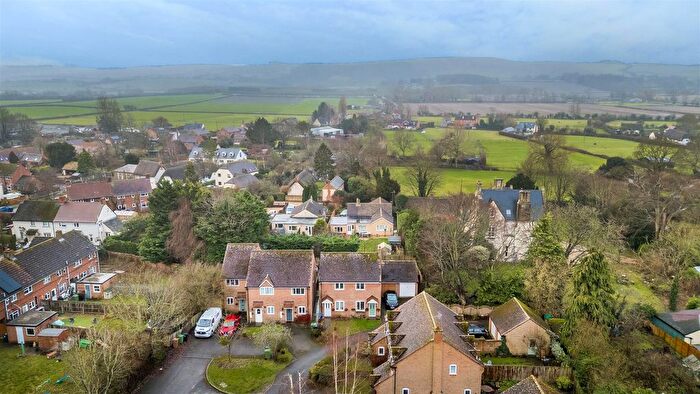
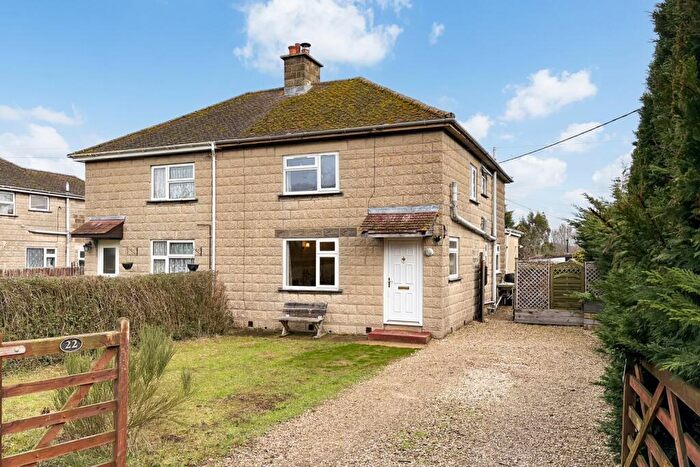
Properties in Craven have an average house price of £507,033.00 and had 41 Property Transactions within the last 3 years¹.
Craven is an area in Faringdon, Oxfordshire with 467 households², where the most expensive property was sold for £1,100,000.00.
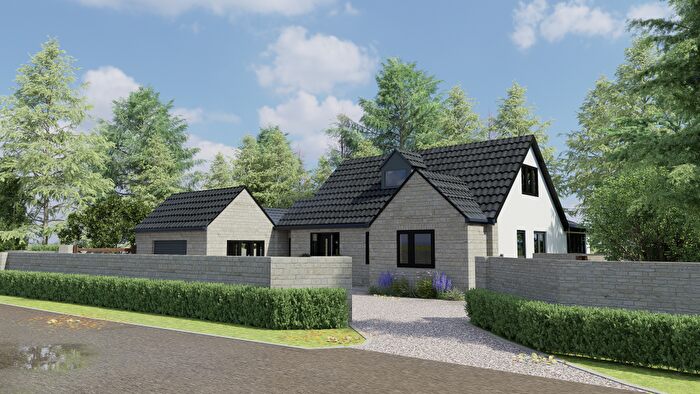
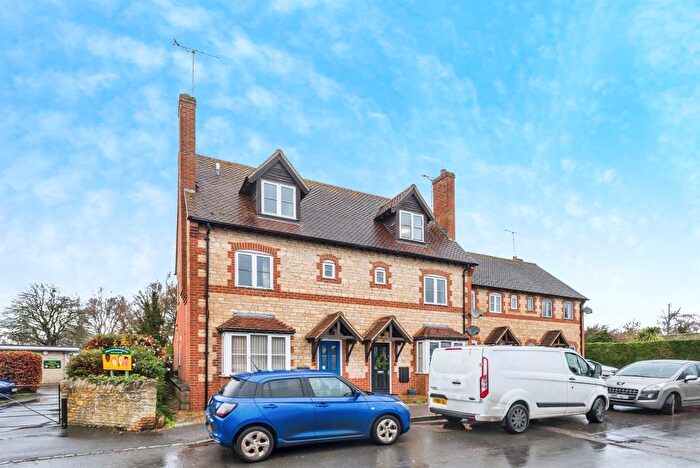
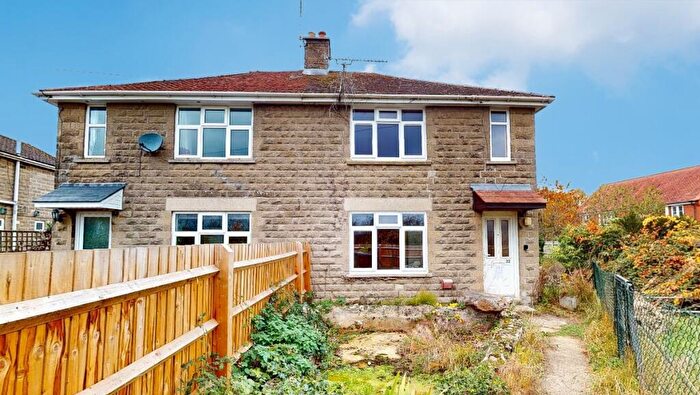
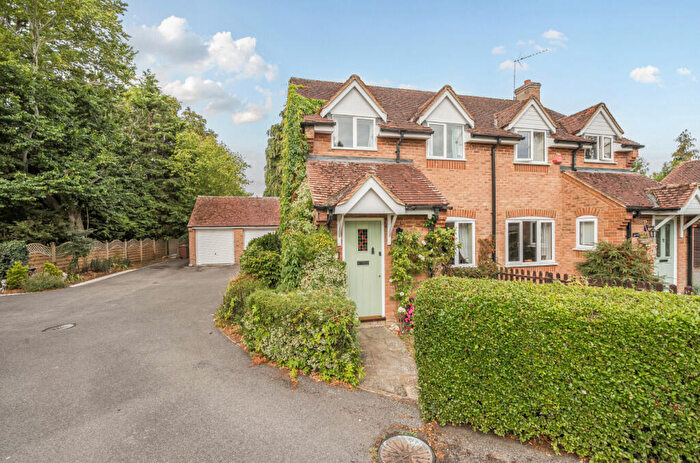
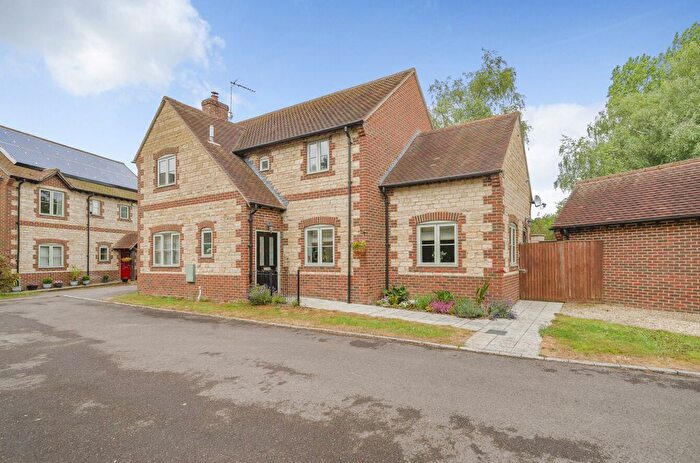
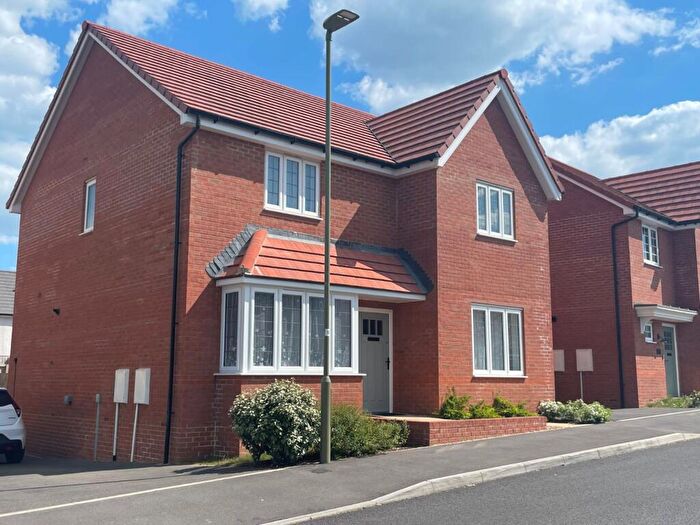
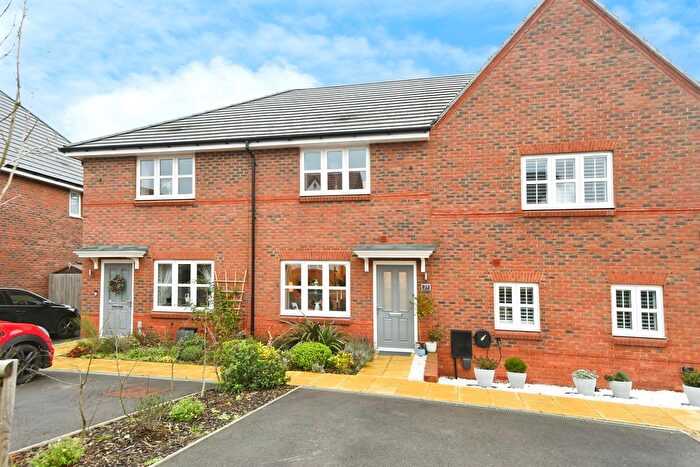
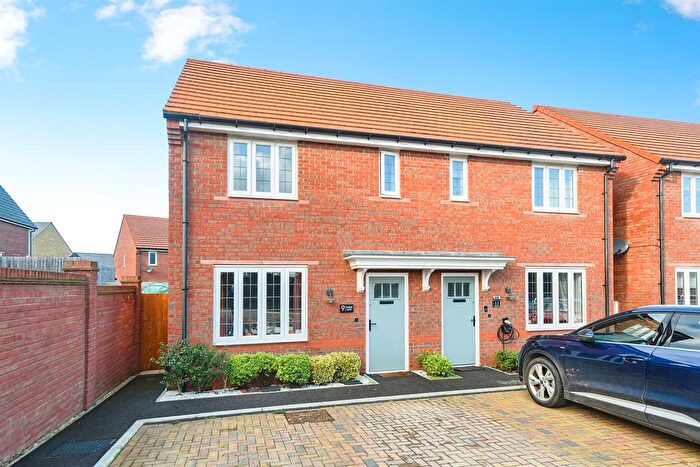
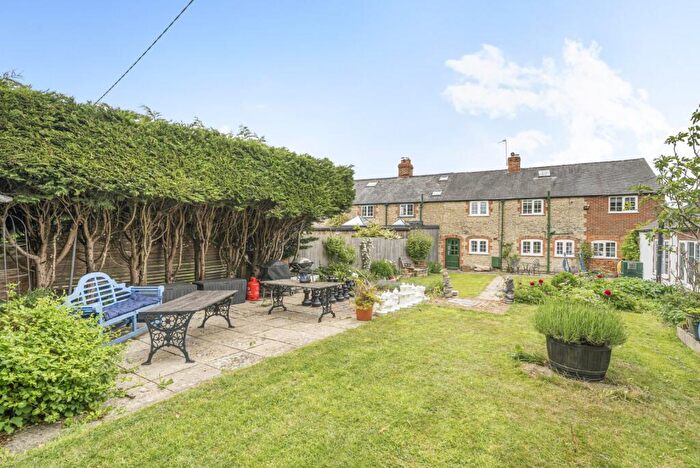
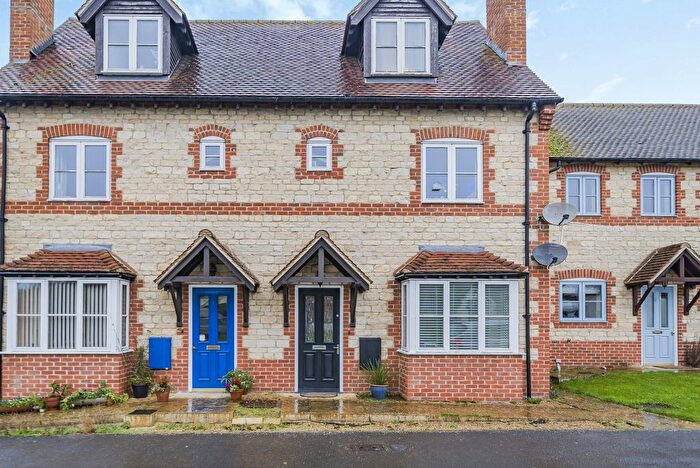
Properties for sale in Craven
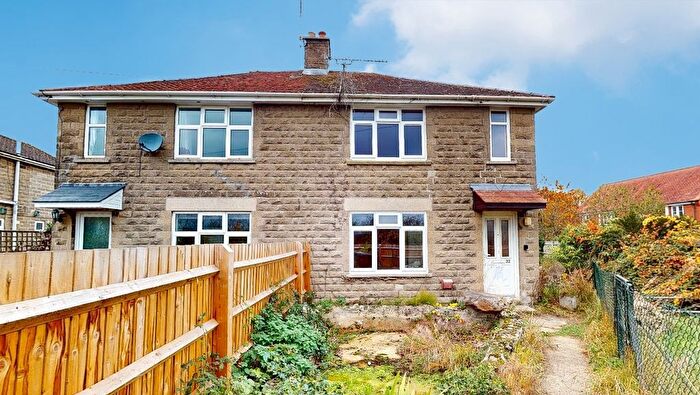
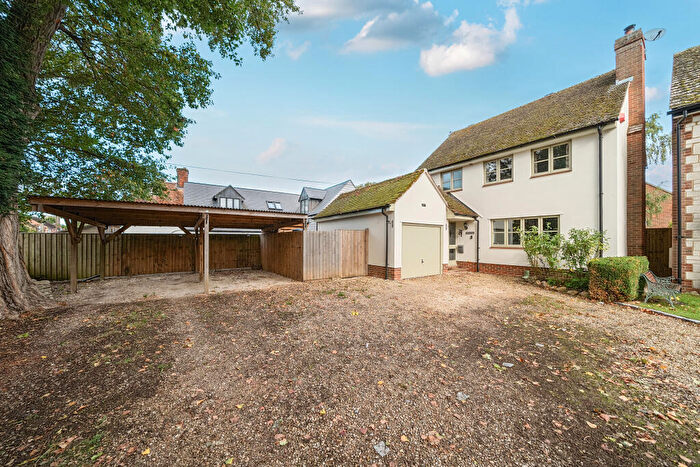
Previously listed properties in Craven
Roads and Postcodes in Craven
Navigate through our locations to find the location of your next house in Craven, Faringdon for sale or to rent.
| Streets | Postcodes |
|---|---|
| Bakers Square | SN7 7NT |
| Broad Street | SN7 7RA |
| Chapel Lane | SN7 7PE SN7 7RY |
| Church Lane | SN7 7PB |
| Colliers Cottages | SN7 7QF |
| Craven Common | SN7 7RN |
| Elmside | SN7 7PA |
| Fawler Road | SN7 7SD |
| Fernham Farm Cottages | SN7 7NX |
| Fernham Road | SN7 7PW |
| Freemans Close | SN7 7SH |
| Green Lane | SN7 7SA |
| High Street | SN7 7NY SN7 7RP |
| Hill View | SN7 7RZ |
| Hobbs Hill | SN7 7NU |
| Lower Common | SN7 7SQ |
| Manor Farm Close | SN7 7XQ |
| Manor Farm Cottages | SN7 7QE |
| New Buildings | SN7 7SF |
| Packers Lane | SN7 7RT |
| Patricks Orchard | SN7 7RL |
| Shotover Corner | SN7 7RH SN7 7RJ |
| Silver Street | SN7 7NZ |
| The Green | SN7 7SB |
| The Lane | SN7 7QP |
| Upper Common | SN7 7RU |
| Waylands | SN7 7RR |
| White Horse | SN7 7SE |
| Woolstone Corner | SN7 7RF |
| SN7 7PP SN7 7PR SN7 7QD SN7 7QL SN7 7QR SN7 7QS SN7 7RE SN7 7RQ SN7 7SG SN7 8NR |
Transport near Craven
-
Swindon Station
-
Hungerford Station
-
Didcot Parkway Station
-
Appleford Station
-
Culham Station
-
Radley Station
- FAQ
- Price Paid By Year
- Property Type Price
Frequently asked questions about Craven
What is the average price for a property for sale in Craven?
The average price for a property for sale in Craven is £507,033. This amount is 30% higher than the average price in Faringdon. There are 107 property listings for sale in Craven.
What streets have the most expensive properties for sale in Craven?
The streets with the most expensive properties for sale in Craven are Hobbs Hill at an average of £975,000, Silver Street at an average of £865,000 and High Street at an average of £762,500.
What streets have the most affordable properties for sale in Craven?
The streets with the most affordable properties for sale in Craven are The Lane at an average of £255,000, Freemans Close at an average of £302,500 and Hill View at an average of £342,333.
Which train stations are available in or near Craven?
Some of the train stations available in or near Craven are Swindon, Hungerford and Didcot Parkway.
Property Price Paid in Craven by Year
The average sold property price by year was:
| Year | Average Sold Price | Price Change |
Sold Properties
|
|---|---|---|---|
| 2025 | £493,666 | -2% |
18 Properties |
| 2024 | £501,250 | -6% |
10 Properties |
| 2023 | £529,990 | -54% |
13 Properties |
| 2022 | £816,916 | 39% |
12 Properties |
| 2021 | £496,832 | 13% |
16 Properties |
| 2020 | £433,437 | -93% |
16 Properties |
| 2019 | £838,000 | 50% |
10 Properties |
| 2018 | £417,450 | -14% |
10 Properties |
| 2017 | £477,677 | -1% |
12 Properties |
| 2016 | £480,818 | 15% |
16 Properties |
| 2015 | £409,326 | -20% |
13 Properties |
| 2014 | £490,969 | -4% |
18 Properties |
| 2013 | £510,730 | 17% |
13 Properties |
| 2012 | £423,604 | 22% |
12 Properties |
| 2011 | £328,925 | -49% |
14 Properties |
| 2010 | £488,571 | 17% |
16 Properties |
| 2009 | £404,750 | 32% |
18 Properties |
| 2008 | £273,937 | -31% |
8 Properties |
| 2007 | £359,848 | -4% |
31 Properties |
| 2006 | £374,326 | 20% |
26 Properties |
| 2005 | £299,928 | -23% |
21 Properties |
| 2004 | £369,305 | 20% |
18 Properties |
| 2003 | £296,339 | 15% |
19 Properties |
| 2002 | £250,953 | -3% |
24 Properties |
| 2001 | £258,509 | 1% |
21 Properties |
| 2000 | £256,250 | 29% |
4 Properties |
| 1999 | £183,162 | 17% |
12 Properties |
| 1998 | £151,508 | 21% |
19 Properties |
| 1997 | £120,152 | -18% |
16 Properties |
| 1996 | £142,155 | -3% |
31 Properties |
| 1995 | £146,670 | - |
12 Properties |
Property Price per Property Type in Craven
Here you can find historic sold price data in order to help with your property search.
The average Property Paid Price for specific property types in the last three years are:
| Property Type | Average Sold Price | Sold Properties |
|---|---|---|
| Semi Detached House | £405,581.00 | 16 Semi Detached Houses |
| Detached House | £629,977.00 | 19 Detached Houses |
| Terraced House | £388,250.00 | 6 Terraced Houses |

