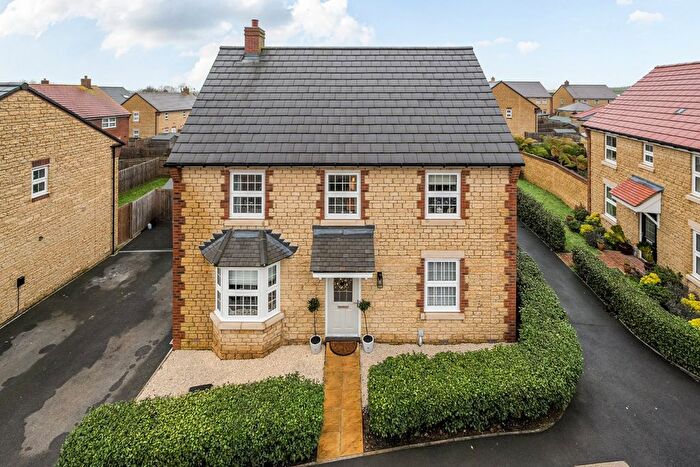
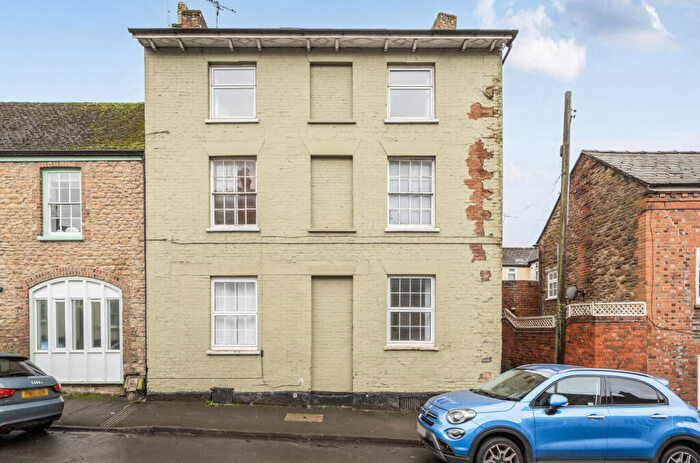
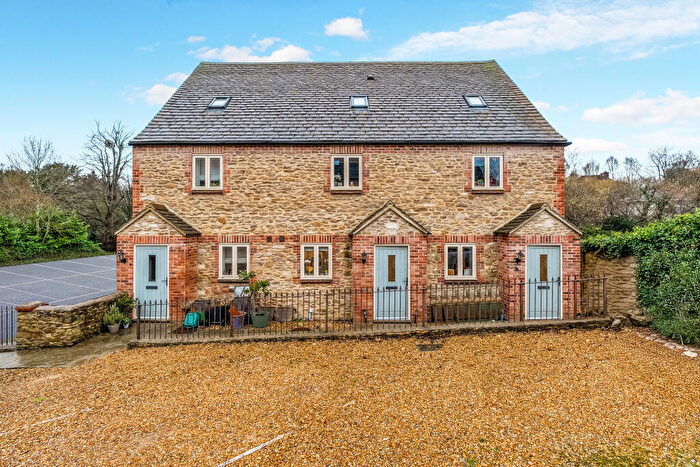
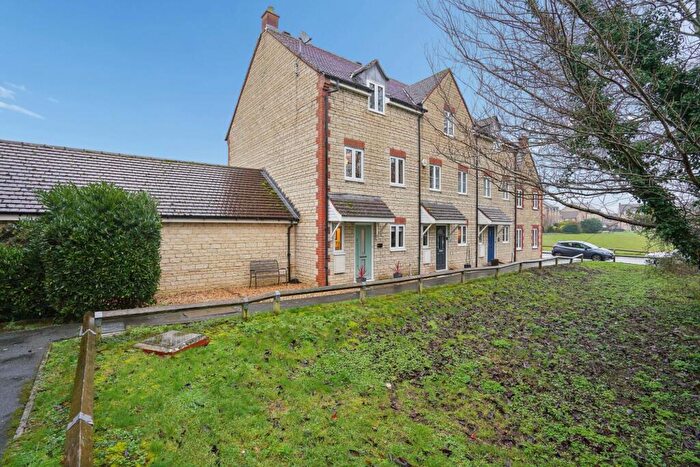
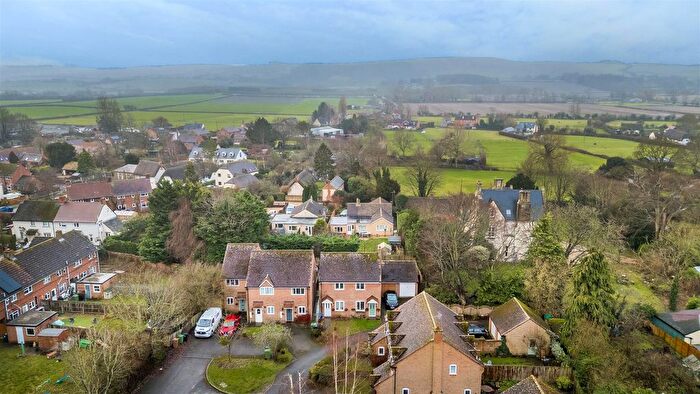
Houses for sale & to rent in Stanford, Faringdon
House Prices in Stanford
Properties in Stanford have an average house price of £462,124.00 and had 100 Property Transactions within the last 3 years¹.
Stanford is an area in Faringdon, Oxfordshire with 1,026 households², where the most expensive property was sold for £1,625,000.00.
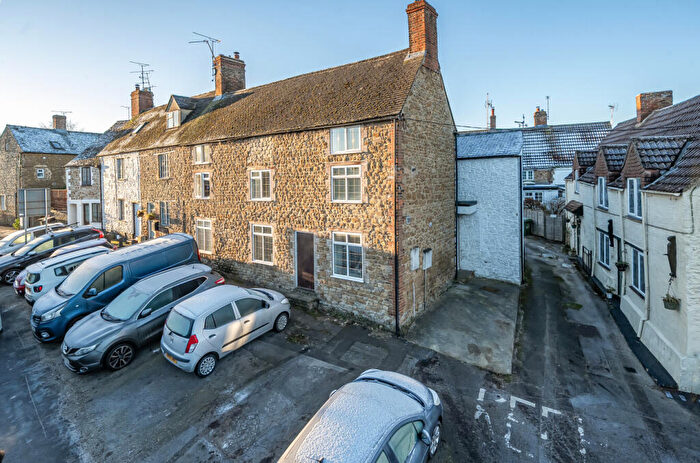
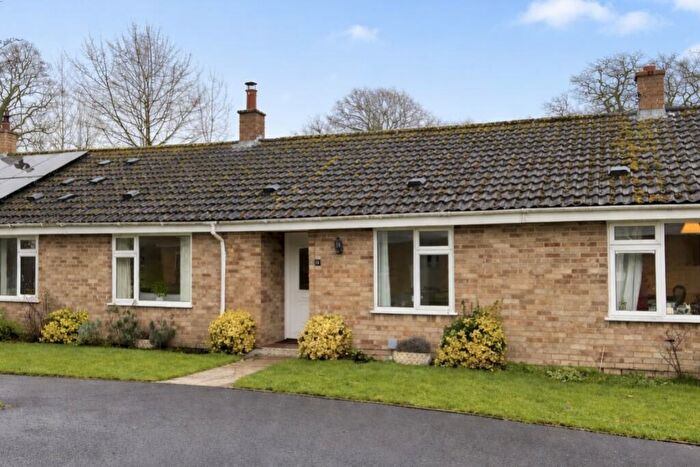
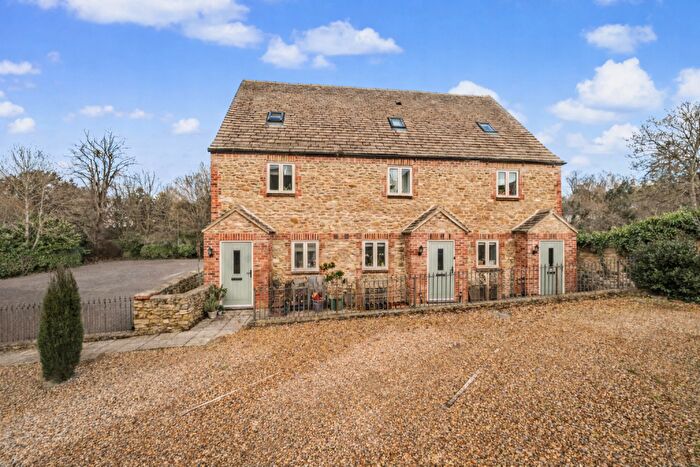
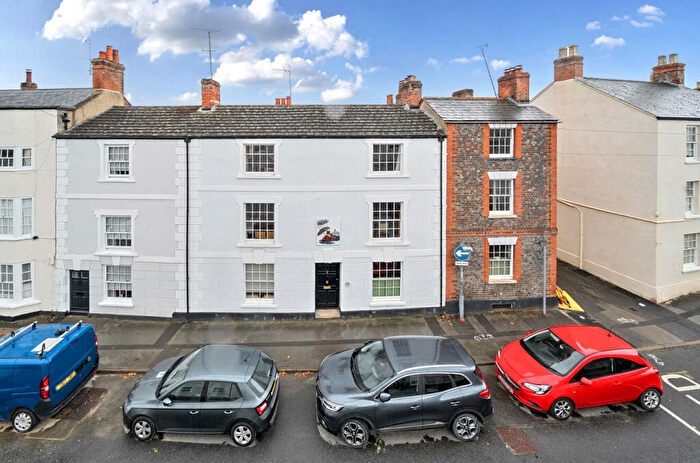
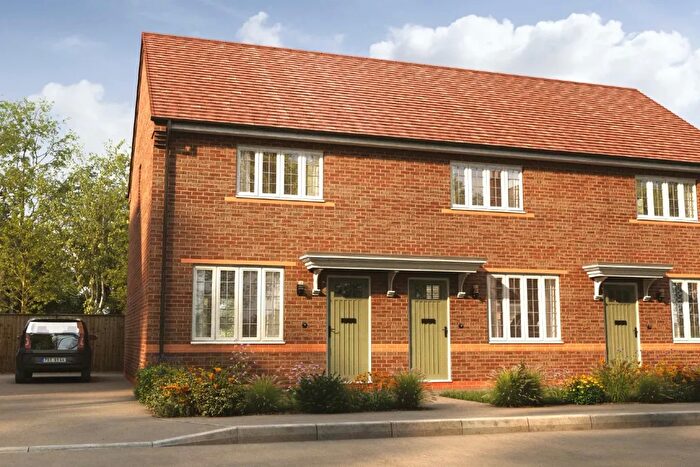
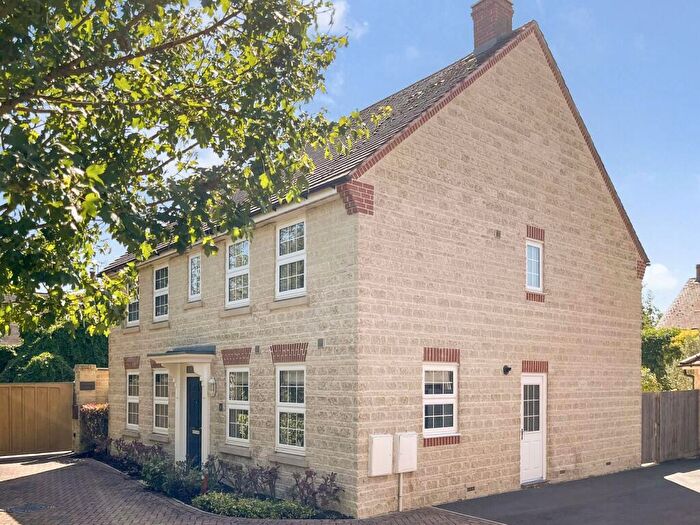
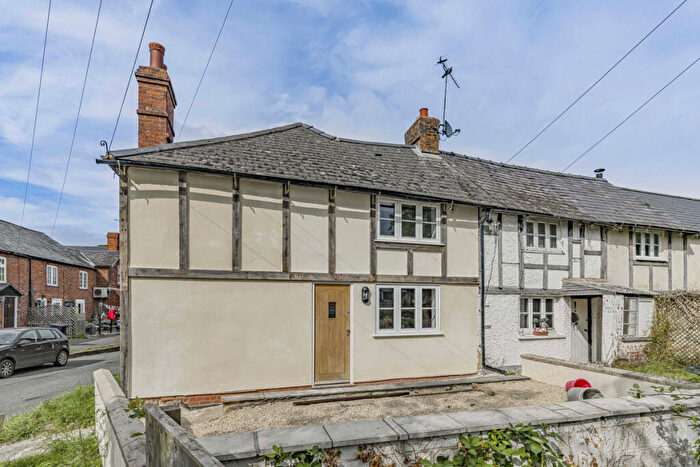
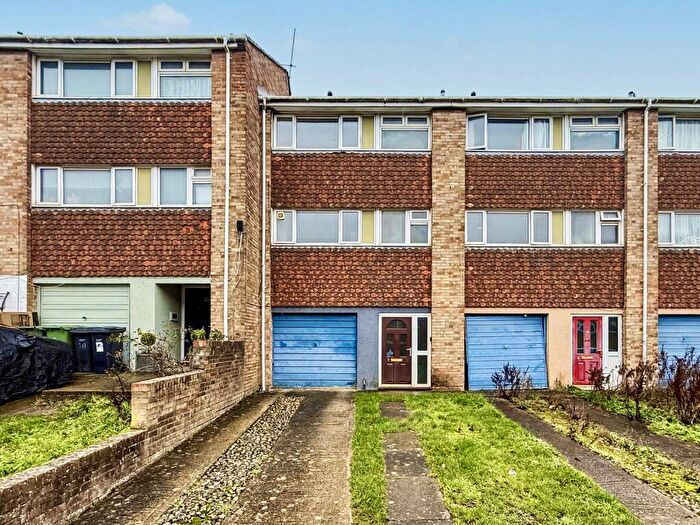
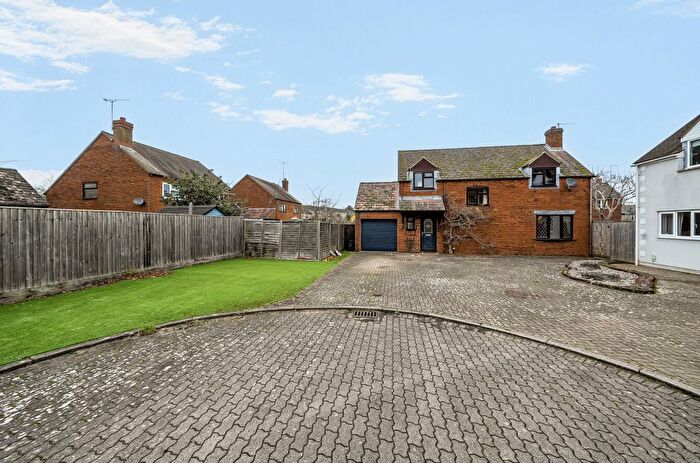
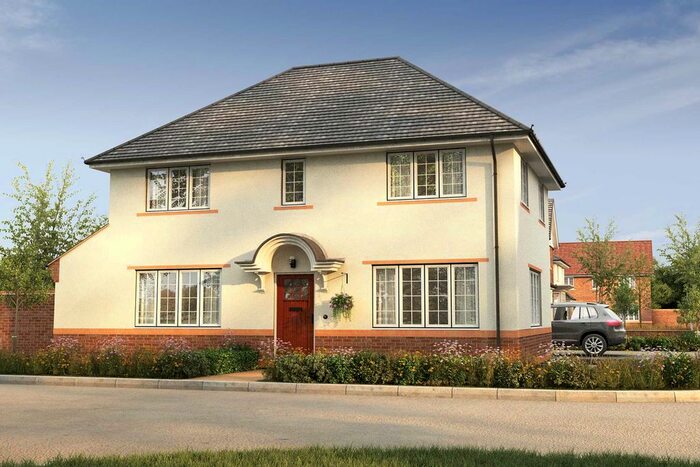
Properties for sale in Stanford
Roads and Postcodes in Stanford
Navigate through our locations to find the location of your next house in Stanford, Faringdon for sale or to rent.
| Streets | Postcodes |
|---|---|
| Bow Road | SN7 8JB |
| Bowling Green Cottages | SN7 8HB |
| Brick Kiln Rise | SN7 8FP |
| Castle Crescent | SN7 7PX |
| Chapel Road | SN7 8LE |
| Church Green | SN7 8HU SN7 8LQ |
| Church Path | SN7 8LS |
| Church Street | SN7 7QA |
| Cottage Road | SN7 8HX |
| Council Houses | SN7 7PY |
| Cowderoy Place | SN7 8PG |
| Croft Meadow | SN7 8FG |
| Englefield Close | SN7 8FT |
| Faringdon Road | SN7 8HQ SN7 8NN SN7 8NP SN7 8LD |
| Farm Piece | SN7 8FA |
| Fawkner Way | SN7 8FF |
| Fernham Road | SN7 7PU SN7 7RD |
| Fox Cover View | SN7 7SL |
| Frogmore Lane | SN7 8LG |
| Frys Meadow | SN7 8FN |
| Gainfield | SN7 8QJ |
| Glebe Road | SN7 8NB |
| Hatford Road | SN7 8HF |
| Hawkins Avenue | SN7 8FY |
| Heigham Court | SN7 8FE |
| High Street | SN7 8LH SN7 8NQ SN7 8NL |
| Horsecroft | SN7 8LL |
| Hunters Field | SN7 8LR SN7 8LX SN7 8LZ SN7 8ND |
| Jacksmeadow | SN7 7GN |
| Joyces Road | SN7 8HJ SN7 8HT |
| Kiln Close | SN7 8FJ |
| Knolles Drive | SN7 8FD |
| Manor Crescent | SN7 8NA |
| Manor Green | SN7 8LU |
| Marlborough Lane | SN7 8NH |
| Mawkes Close | SN7 8FB |
| Neville Way | SN7 8LY |
| Nursery End | SN7 8PH |
| Ock Meadow | SN7 8LN |
| Park Lane | SN7 8PF |
| Parsons Grove | SN7 8GD |
| Penstones Court | SN7 8SW |
| Perrys Road | SN7 8HS |
| Popplestone Close | SN7 8FW |
| Sandy Lane | SN7 8JH |
| Sheards Lane | SN7 8LW |
| Shellingford Cross Roads | SN7 8HE |
| Southdown Court | SN7 8LB |
| Spencers Close | SN7 8NG |
| St Denys Close | SN7 8NJ |
| Stanford In The Vale | SN7 8NS |
| Stanford Road | SN7 8EZ |
| The Walls | SN7 8LP |
| Treadwells | SN7 8UA |
| Tyrell Close | SN7 8EY |
| Upper Crale | SN7 8HP |
| Upper Green | SN7 8HY |
| Van Diemans | SN7 8HL SN7 8HN SN7 8HW SN7 8HZ SN7 8HH |
| Wallis Gardens | SN7 8FZ |
| Warwick Close | SN7 8LT |
| Whistler Way | SN7 8FQ |
| White Horse Business Park | SN7 8NY |
| Whitfield | SN7 8FL |
| Wolters Place | SN7 8GB |
| Woolstone Road | SN7 7RG |
| Wordsworth Close | SN7 8JA |
| SN7 7PT SN7 8EX SN7 8HA SN7 8JE SN7 8JF SN7 7PS SN7 7PZ SN7 7QH SN7 7QJ SN7 7QN SN7 7QW SN7 7RB SN7 8HD SN7 8JG SN7 8JQ SN7 7ZB SN7 8FR SN7 8FS SN7 8FX |
Transport near Stanford
-
Appleford Station
-
Didcot Parkway Station
-
Culham Station
-
Swindon Station
-
Radley Station
-
Oxford Station
-
Hanborough Station
-
Combe Station
- FAQ
- Price Paid By Year
- Property Type Price
Frequently asked questions about Stanford
What is the average price for a property for sale in Stanford?
The average price for a property for sale in Stanford is £462,124. This amount is 19% higher than the average price in Faringdon. There are 1,059 property listings for sale in Stanford.
What streets have the most expensive properties for sale in Stanford?
The streets with the most expensive properties for sale in Stanford are Upper Green at an average of £1,450,000, Fernham Road at an average of £962,500 and Church Green at an average of £780,333.
What streets have the most affordable properties for sale in Stanford?
The streets with the most affordable properties for sale in Stanford are Manor Crescent at an average of £225,400, Treadwells at an average of £266,666 and Knolles Drive at an average of £267,500.
Which train stations are available in or near Stanford?
Some of the train stations available in or near Stanford are Appleford, Didcot Parkway and Culham.
Property Price Paid in Stanford by Year
The average sold property price by year was:
| Year | Average Sold Price | Price Change |
Sold Properties
|
|---|---|---|---|
| 2025 | £476,534 | 6% |
29 Properties |
| 2024 | £448,178 | -4% |
39 Properties |
| 2023 | £466,062 | 23% |
32 Properties |
| 2022 | £358,710 | -34% |
44 Properties |
| 2021 | £479,072 | 20% |
52 Properties |
| 2020 | £384,907 | -3% |
52 Properties |
| 2019 | £396,773 | 5% |
32 Properties |
| 2018 | £377,666 | 6% |
51 Properties |
| 2017 | £354,325 | -13% |
40 Properties |
| 2016 | £399,847 | 22% |
69 Properties |
| 2015 | £312,433 | 15% |
72 Properties |
| 2014 | £266,078 | 2% |
58 Properties |
| 2013 | £261,423 | -28% |
39 Properties |
| 2012 | £333,925 | 32% |
27 Properties |
| 2011 | £227,751 | -33% |
26 Properties |
| 2010 | £301,796 | 18% |
40 Properties |
| 2009 | £248,380 | -14% |
42 Properties |
| 2008 | £282,183 | 11% |
27 Properties |
| 2007 | £252,535 | -9% |
59 Properties |
| 2006 | £275,601 | 14% |
73 Properties |
| 2005 | £235,891 | -5% |
48 Properties |
| 2004 | £247,438 | 9% |
83 Properties |
| 2003 | £225,239 | 7% |
98 Properties |
| 2002 | £208,496 | 14% |
77 Properties |
| 2001 | £178,463 | 11% |
51 Properties |
| 2000 | £158,551 | 24% |
41 Properties |
| 1999 | £120,130 | -15% |
54 Properties |
| 1998 | £138,581 | 27% |
71 Properties |
| 1997 | £101,292 | 1% |
54 Properties |
| 1996 | £100,473 | 4% |
43 Properties |
| 1995 | £96,249 | - |
49 Properties |
Property Price per Property Type in Stanford
Here you can find historic sold price data in order to help with your property search.
The average Property Paid Price for specific property types in the last three years are:
| Property Type | Average Sold Price | Sold Properties |
|---|---|---|
| Semi Detached House | £362,108.00 | 32 Semi Detached Houses |
| Detached House | £631,731.00 | 43 Detached Houses |
| Terraced House | £300,457.00 | 23 Terraced Houses |
| Flat | £275,000.00 | 2 Flats |

