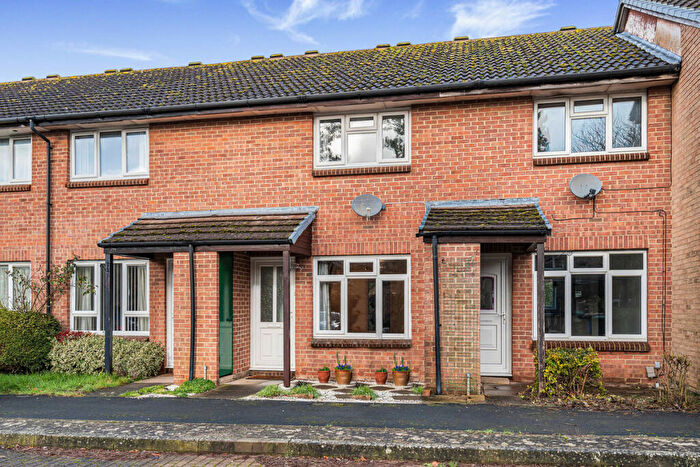
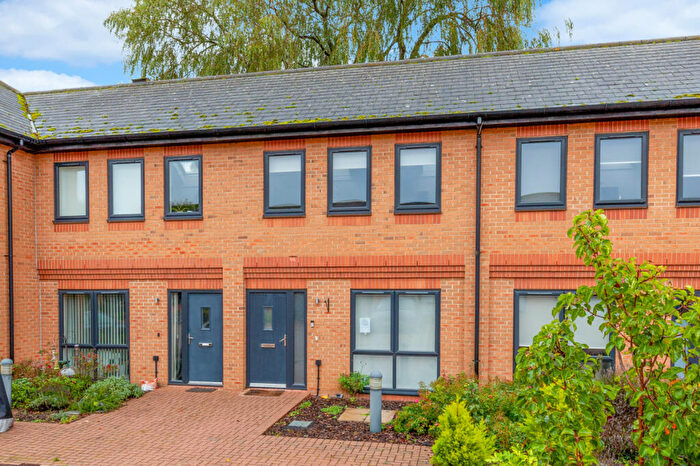
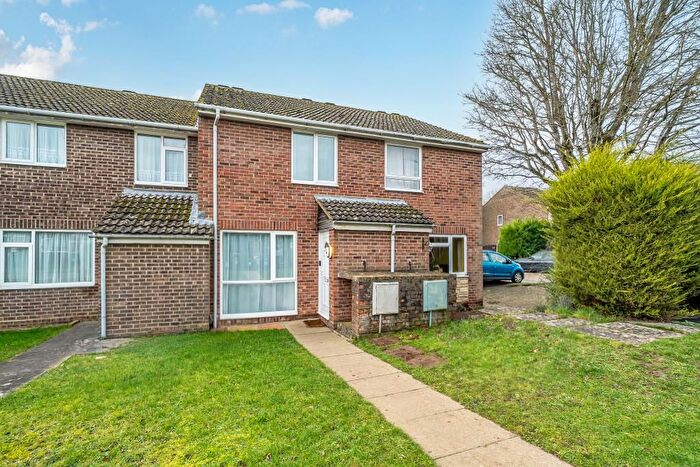
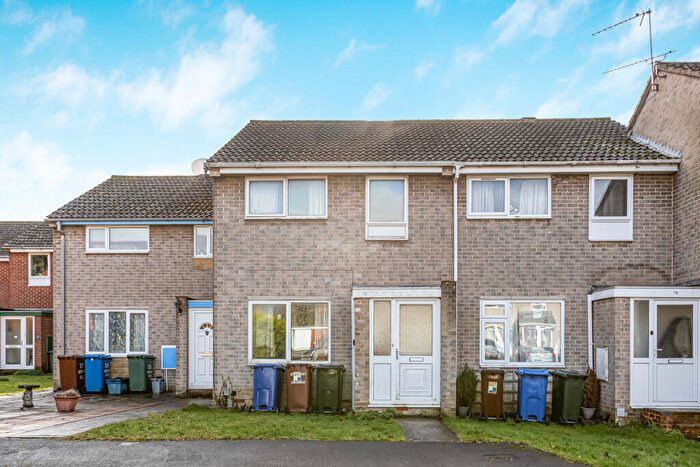
Houses for sale & to rent in Kidlington North, Kidlington
House Prices in Kidlington North
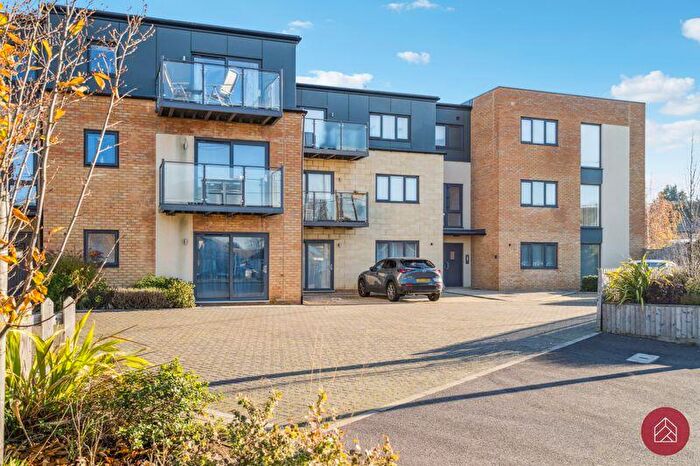
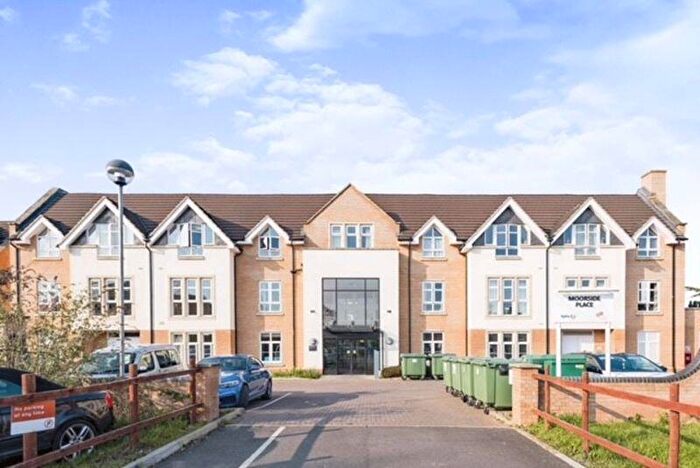
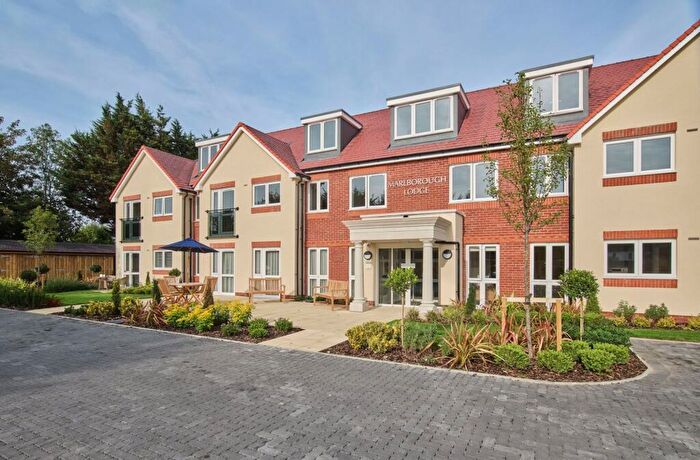
Properties in Kidlington North have an average house price of £366,321.00 and had 193 Property Transactions within the last 3 years¹.
Kidlington North is an area in Kidlington, Oxfordshire with 2,252 households², where the most expensive property was sold for £825,500.00.
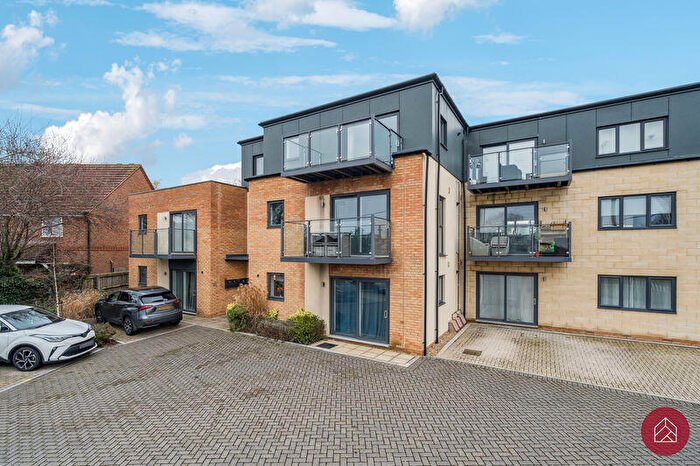
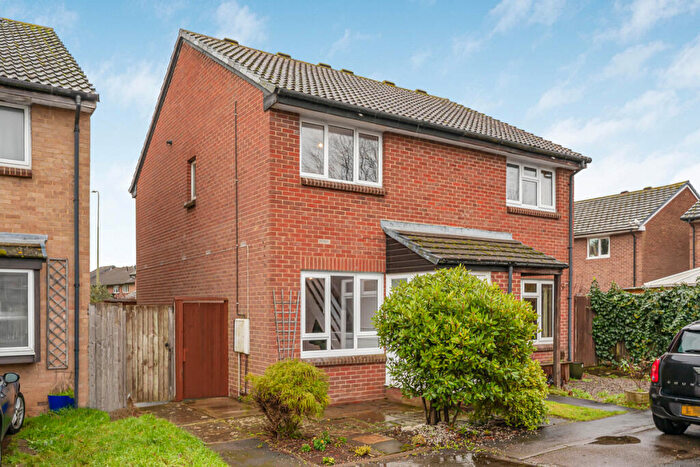
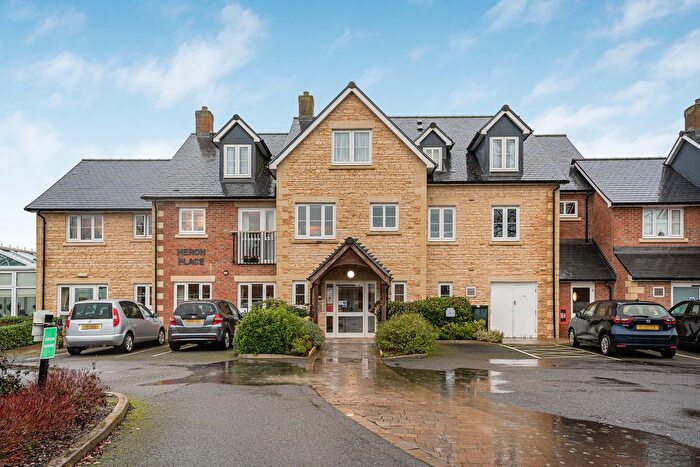
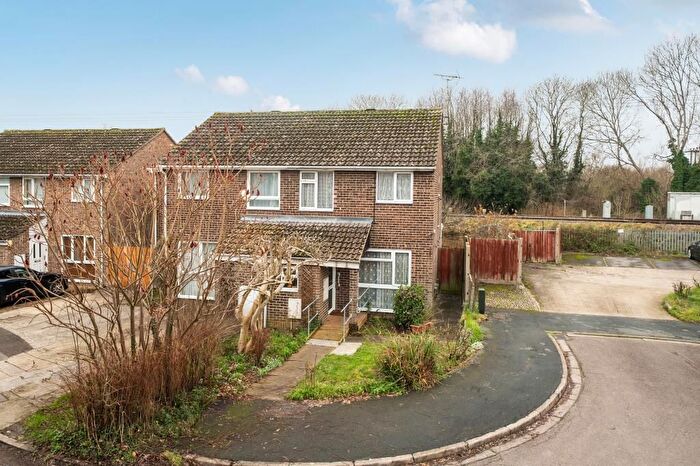
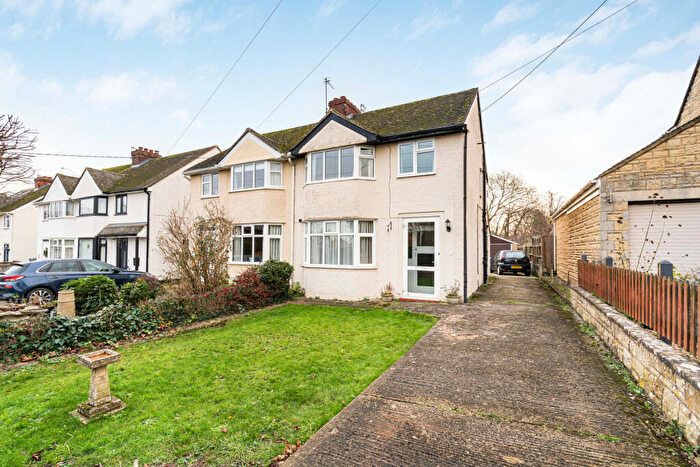
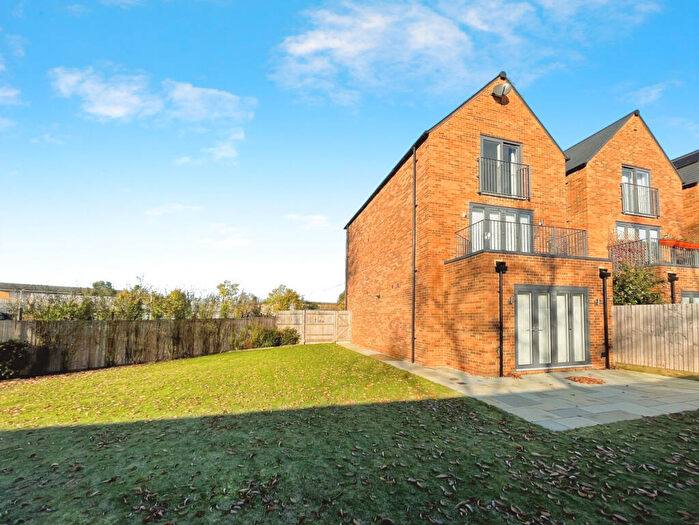
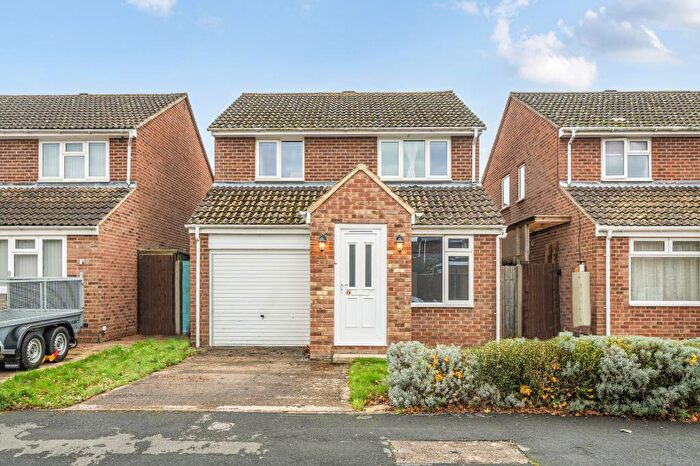
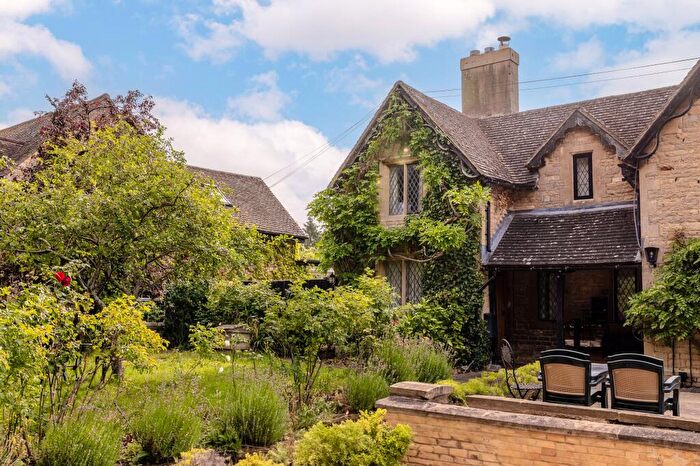
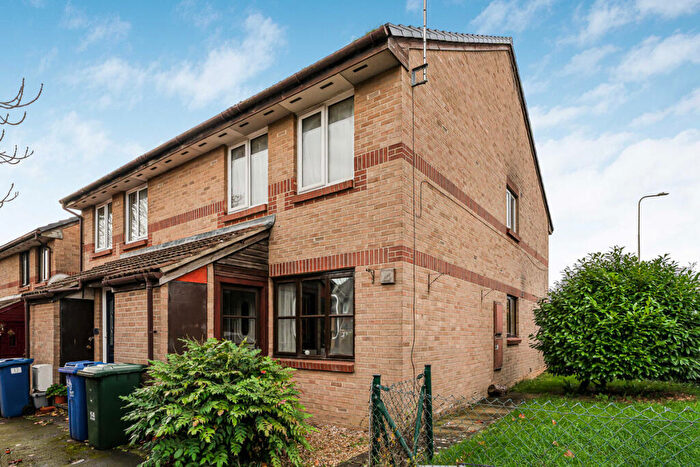
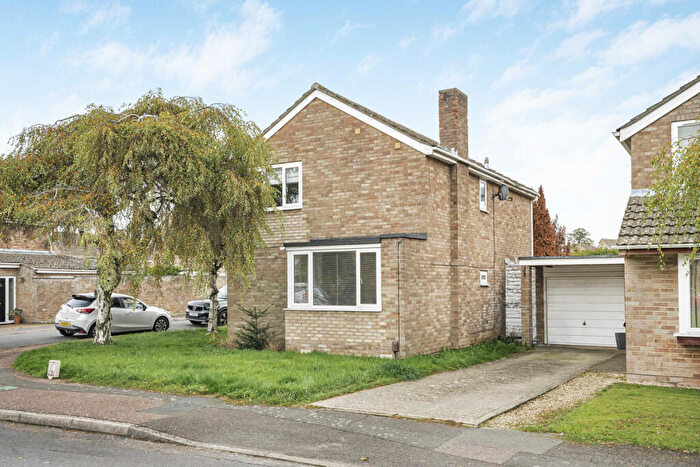
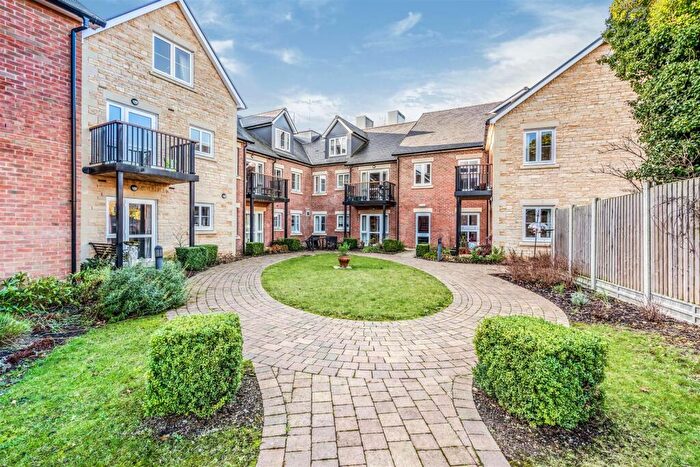
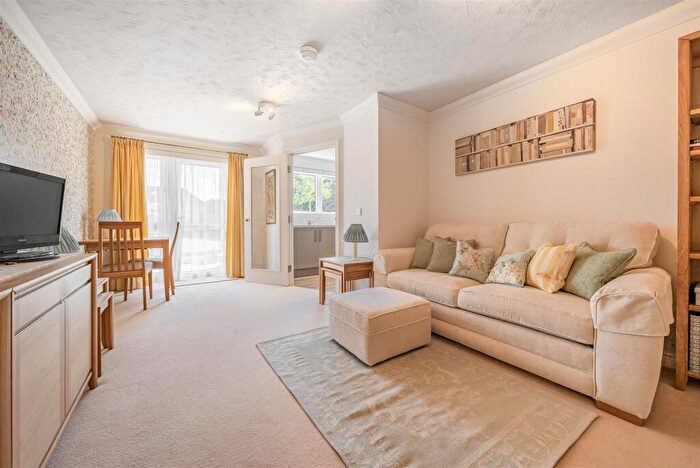
Properties for sale in Kidlington North
Roads and Postcodes in Kidlington North
Navigate through our locations to find the location of your next house in Kidlington North, Kidlington for sale or to rent.
| Streets | Postcodes |
|---|---|
| Andersons Close | OX5 1ST |
| Ashmead Way | OX5 2FT |
| Axtell Close | OX5 1TW |
| Banbury Road | OX5 1AH OX5 1AJ OX5 1AL OX5 2BG OX5 2BT OX5 2BU OX5 2BX OX5 2BY |
| Bankside | OX5 1JE |
| Barn Close | OX5 1SW |
| Ben Close | OX5 2YH |
| Benmead Road | OX5 2AX OX5 2BZ OX5 2DA OX5 2DB |
| Blandford Road | OX5 2BN |
| Briar Close | OX5 2DD |
| Briar End | OX5 2YB |
| Chamberlain Place | OX5 1SG OX5 1SQ |
| Charlbury Close | OX5 2BW |
| Chorefields | OX5 1SX OX5 1SY |
| Church Street | OX5 2BA OX5 2BB |
| Cots Green | OX5 1UX |
| Deaufort Close | OX5 2BQ |
| Evenlode Crescent | OX5 1RF |
| Farm Close | OX5 2BE |
| Flatford Place | OX5 1TG OX5 1TH OX5 1TJ OX5 1TQ |
| Foresters Way | OX5 2PQ |
| Foxdown Close | OX5 2YE |
| Franklin Close | OX5 2PT |
| Freeborn Close | OX5 2BH |
| Greystones Court | OX5 1AR |
| Helwys Place | OX5 2XU |
| High Street | OX5 2DH OX5 2DR |
| Home Close | OX5 2EA |
| Lambs Close | OX5 2YD |
| Langford Lane | OX5 1HT |
| Lee Close | OX5 2XZ |
| Lyne Road | OX5 1AD |
| Manor Way | OX5 2BD OX5 2BL |
| Marlborough Avenue | OX5 2AN OX5 2AP OX5 2AW |
| Mead Way | OX5 2BJ |
| Meadow View | OX5 2XY |
| Mill End | OX5 2EG |
| Mill Street | OX5 2EB OX5 2EE |
| Park Avenue | OX5 2AS |
| Partridge Place | OX5 1SL |
| Petre Place | OX5 2EN |
| Postern Terrace | OX5 1AQ |
| Roundham Close | OX5 1SZ |
| Rowles Way | OX5 1LA |
| Rutters Close | OX5 1SN |
| Spindlers | OX5 2YP |
| St Marys Close | OX5 2AY |
| The Closes | OX5 2DP |
| The Homestead | OX5 1SS |
| The Moorlands | OX5 2XX |
| The Moors | OX5 2AA OX5 2AD OX5 2AE OX5 2AF OX5 2AG OX5 2AH OX5 2AJ OX5 2AQ OX5 2XT |
| The Phelps | OX5 1SP OX5 1SU OX5 1TL |
| The Ridings | OX5 1UA |
| Thorne Close | OX5 1SJ |
| Vicarage Road | OX5 2EL |
| Watermead | OX5 2XJ |
| Webbs Way | OX5 2EW |
| Wilsdon Way | OX5 1TN OX5 1TX OX5 1TY OX5 1TZ |
| Wise Avenue | OX5 2AT OX5 2AU |
| Woodlands | OX5 2ER |
Transport near Kidlington North
- FAQ
- Price Paid By Year
- Property Type Price
Frequently asked questions about Kidlington North
What is the average price for a property for sale in Kidlington North?
The average price for a property for sale in Kidlington North is £366,321. This amount is 16% lower than the average price in Kidlington. There are 898 property listings for sale in Kidlington North.
What streets have the most expensive properties for sale in Kidlington North?
The streets with the most expensive properties for sale in Kidlington North are Briar Close at an average of £637,500, Briar End at an average of £584,000 and Church Street at an average of £548,750.
What streets have the most affordable properties for sale in Kidlington North?
The streets with the most affordable properties for sale in Kidlington North are Evenlode Crescent at an average of £215,250, Wilsdon Way at an average of £256,031 and Thorne Close at an average of £261,250.
Which train stations are available in or near Kidlington North?
Some of the train stations available in or near Kidlington North are Oxford Parkway, Islip and Hanborough.
Property Price Paid in Kidlington North by Year
The average sold property price by year was:
| Year | Average Sold Price | Price Change |
Sold Properties
|
|---|---|---|---|
| 2025 | £380,703 | 5% |
58 Properties |
| 2024 | £361,133 | 1% |
80 Properties |
| 2023 | £358,700 | -3% |
55 Properties |
| 2022 | £370,368 | -1% |
79 Properties |
| 2021 | £372,621 | 11% |
115 Properties |
| 2020 | £331,887 | -9% |
59 Properties |
| 2019 | £362,022 | -11% |
80 Properties |
| 2018 | £400,038 | 14% |
78 Properties |
| 2017 | £343,033 | -3% |
74 Properties |
| 2016 | £353,482 | 0,2% |
89 Properties |
| 2015 | £352,845 | 20% |
101 Properties |
| 2014 | £282,766 | 6% |
113 Properties |
| 2013 | £266,556 | 5% |
90 Properties |
| 2012 | £253,677 | 4% |
90 Properties |
| 2011 | £244,675 | -5% |
80 Properties |
| 2010 | £257,592 | 11% |
84 Properties |
| 2009 | £230,049 | 7% |
84 Properties |
| 2008 | £212,888 | -18% |
70 Properties |
| 2007 | £251,818 | 15% |
110 Properties |
| 2006 | £214,930 | 4% |
114 Properties |
| 2005 | £207,275 | 1% |
130 Properties |
| 2004 | £206,059 | 8% |
143 Properties |
| 2003 | £188,725 | 15% |
135 Properties |
| 2002 | £160,254 | 20% |
152 Properties |
| 2001 | £128,713 | 7% |
119 Properties |
| 2000 | £119,445 | 17% |
141 Properties |
| 1999 | £99,383 | 4% |
151 Properties |
| 1998 | £94,916 | 8% |
151 Properties |
| 1997 | £87,107 | 16% |
156 Properties |
| 1996 | £73,403 | -3% |
145 Properties |
| 1995 | £75,808 | - |
118 Properties |
Property Price per Property Type in Kidlington North
Here you can find historic sold price data in order to help with your property search.
The average Property Paid Price for specific property types in the last three years are:
| Property Type | Average Sold Price | Sold Properties |
|---|---|---|
| Semi Detached House | £384,400.00 | 53 Semi Detached Houses |
| Detached House | £527,553.00 | 49 Detached Houses |
| Terraced House | £319,899.00 | 58 Terraced Houses |
| Flat | £179,469.00 | 33 Flats |

