
Houses for sale & to rent in Kidlington, Oxfordshire
House Prices in Kidlington
Properties in Kidlington have an average house price of £436k and had 870 Property Transactions within the last 3 years.¹
Kidlington is an area in Oxfordshire with 9,460 households², where the most expensive property was sold for £3.15M.
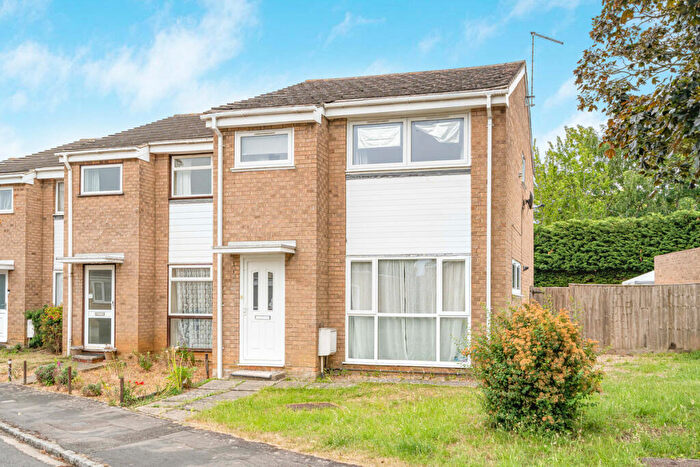
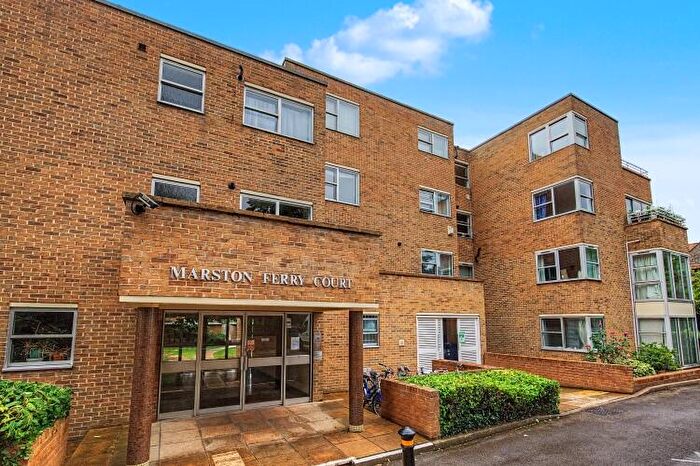
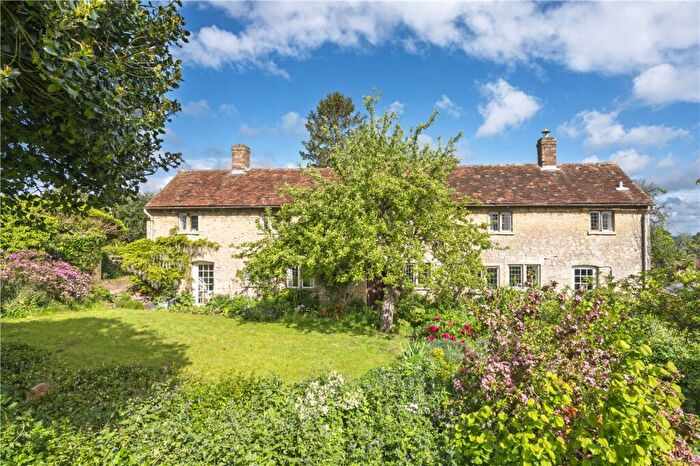
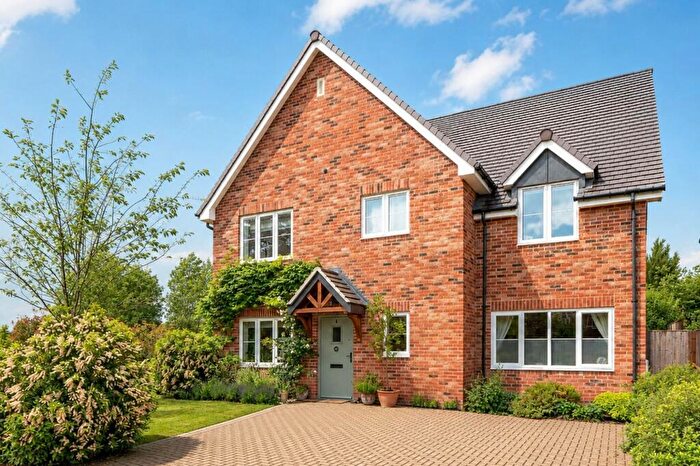
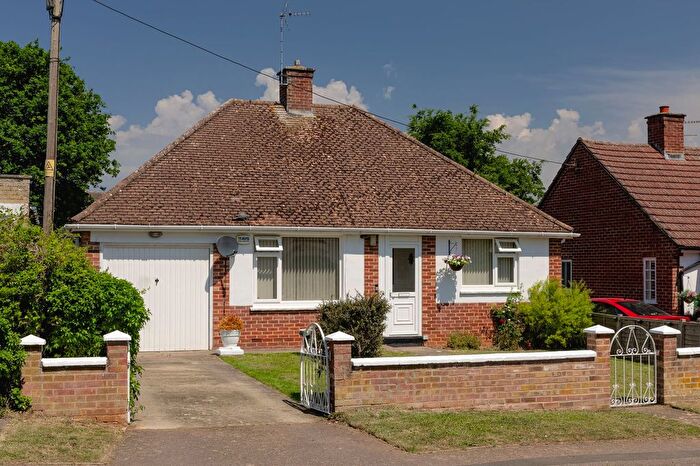
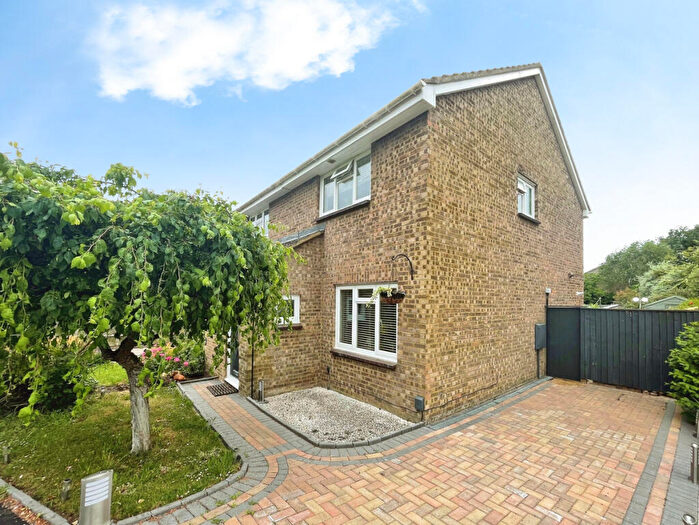
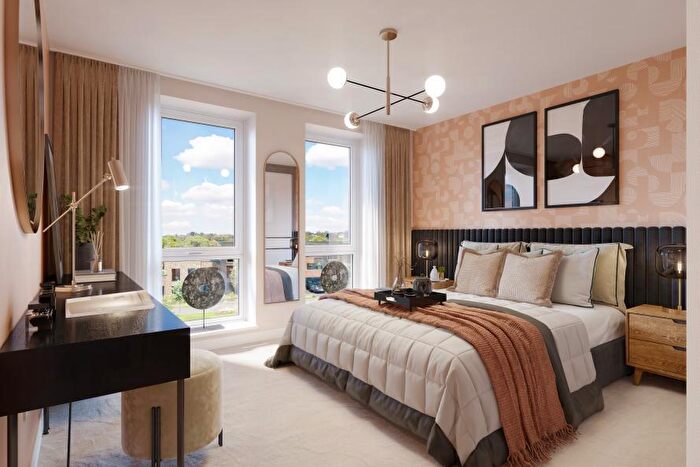
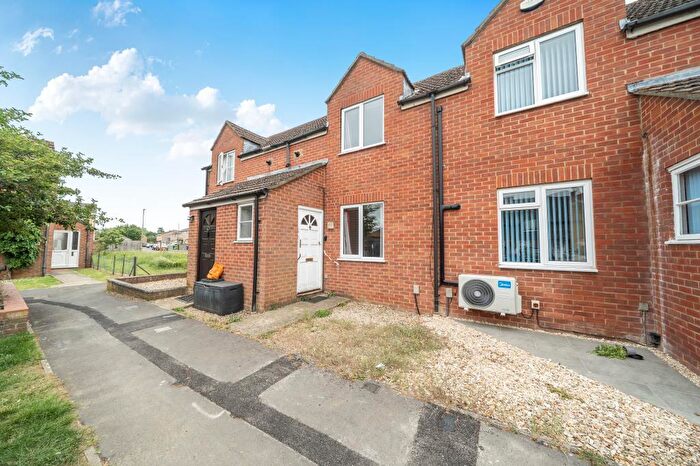
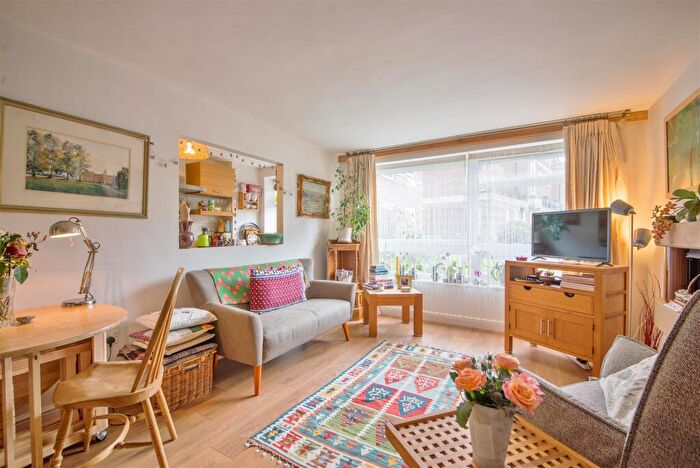
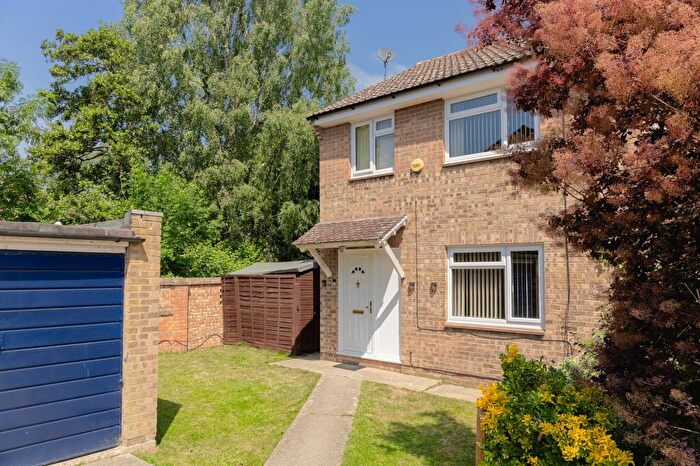
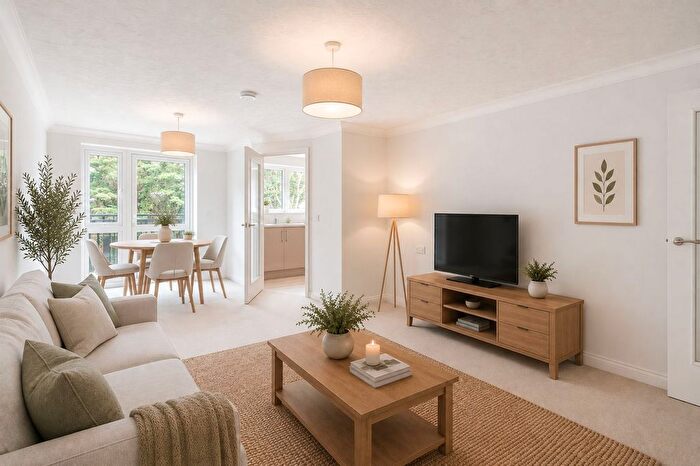
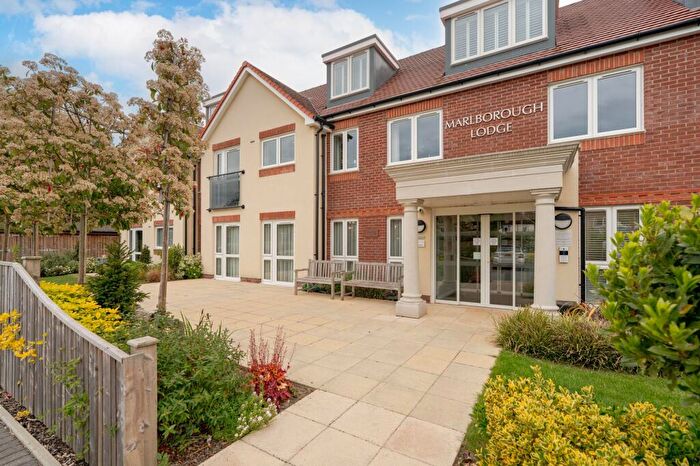
Properties for sale in Kidlington

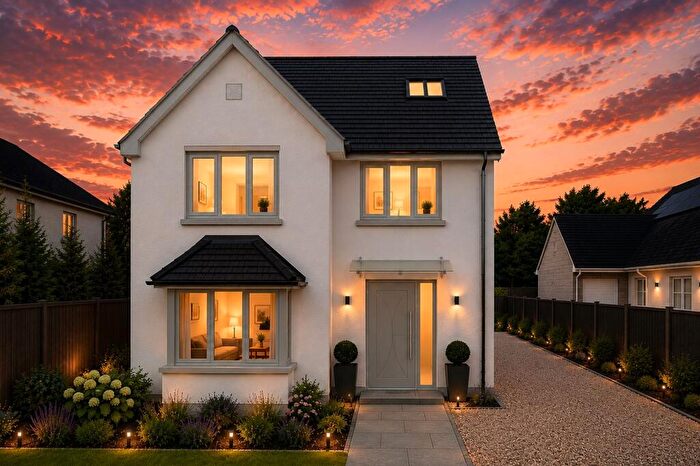
![]()
If you are looking to sell your house, let it out, or receive a property valuation, an expert can help you.
Click the button below to get started.

Neighbourhoods in Kidlington
Navigate through our locations to find the location of your next house in Kidlington, Oxfordshire for sale or to rent.
Transport in Kidlington
Please see below transportation links in this area:

- FAQ
- Price Paid By Year
- Property Type Price
Frequently asked questions about Kidlington
What is the average price for a property for sale in Kidlington?
The average price for a property for sale in Kidlington is £435,656. This amount is 9% lower than the average price in Oxfordshire. There are more than 10,000 property listings for sale in Kidlington.
What locations have the most expensive properties for sale in Kidlington?
The locations with the most expensive properties for sale in Kidlington are Otmoor at an average of £663,010, Kirtlington at an average of £594,423 and Launton and Otmoor at an average of £461,625.
What locations have the most affordable properties for sale in Kidlington?
The locations with the most affordable properties for sale in Kidlington are Kidlington West at an average of £329,187, Kidlington North at an average of £365,836 and Kidlington South at an average of £404,725.
Which train stations are available in or near Kidlington?
Some of the train stations available in or near Kidlington are Oxford Parkway, Islip and Tackley.
Property Price Paid in Kidlington by Year
The average sold property price by year was:
| Year | Average Sold Price | Price Change |
Sold Properties
|
|---|---|---|---|
| 2026 | £486,640 | 9% |
24 Properties |
| 2025 | £441,240 | 4% |
273 Properties |
| 2024 | £424,164 | -3% |
300 Properties |
| 2023 | £438,220 | 1% |
273 Properties |
| 2022 | £434,837 | 3% |
342 Properties |
| 2021 | £422,875 | 1% |
487 Properties |
| 2020 | £419,897 | 3% |
288 Properties |
| 2019 | £405,818 | 1% |
327 Properties |
| 2018 | £402,139 | 8% |
350 Properties |
| 2017 | £369,311 | -2% |
359 Properties |
| 2016 | £377,706 | 5% |
409 Properties |
| 2015 | £359,987 | 8% |
394 Properties |
| 2014 | £329,693 | 10% |
411 Properties |
| 2013 | £295,924 | 1% |
364 Properties |
| 2012 | £292,940 | 1% |
306 Properties |
| 2011 | £291,182 | 0,5% |
366 Properties |
| 2010 | £289,791 | 10% |
340 Properties |
| 2009 | £260,662 | -4% |
309 Properties |
| 2008 | £271,015 | -5% |
282 Properties |
| 2007 | £283,704 | 7% |
409 Properties |
| 2006 | £264,148 | 12% |
432 Properties |
| 2005 | £231,932 | 1% |
414 Properties |
| 2004 | £229,153 | 10% |
438 Properties |
| 2003 | £205,821 | 3% |
438 Properties |
| 2002 | £200,197 | 16% |
493 Properties |
| 2001 | £168,594 | 10% |
480 Properties |
| 2000 | £151,433 | 22% |
396 Properties |
| 1999 | £117,579 | 11% |
466 Properties |
| 1998 | £105,209 | 12% |
441 Properties |
| 1997 | £93,054 | 10% |
433 Properties |
| 1996 | £83,855 | -2% |
443 Properties |
| 1995 | £85,338 | - |
388 Properties |
Property Price per Property Type in Kidlington
Here you can find historic sold price data in order to help with your property search.
The average Property Paid Price for specific property types in the last three years are:
| Property Type | Average Sold Price | Sold Properties |
|---|---|---|
| Semi Detached House | £406,831.00 | 344 Semi Detached Houses |
| Detached House | £622,986.00 | 243 Detached Houses |
| Terraced House | £354,230.00 | 179 Terraced Houses |
| Flat | £233,445.00 | 104 Flats |