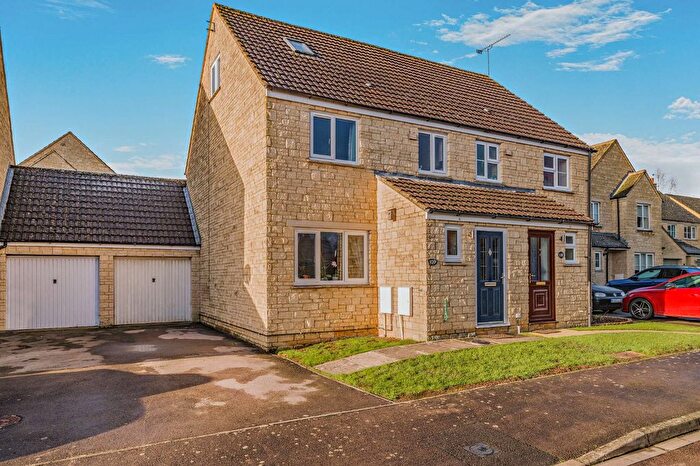
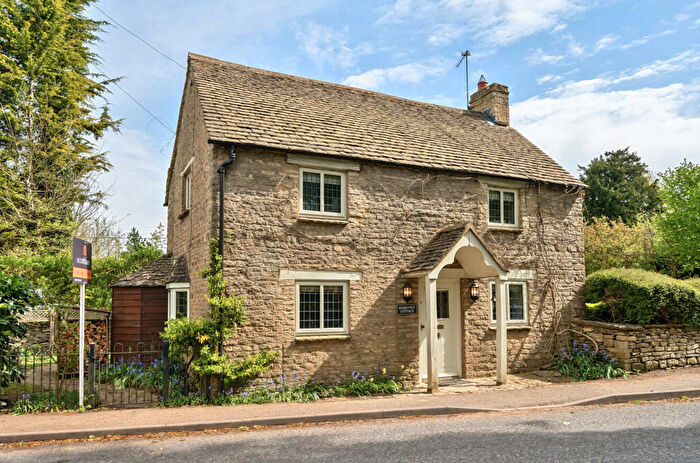
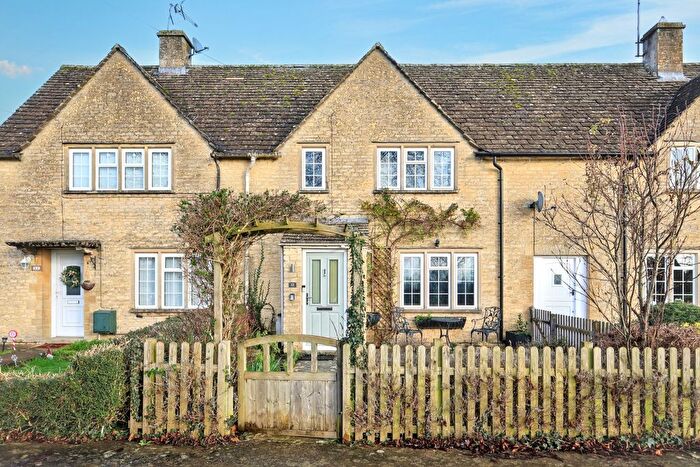
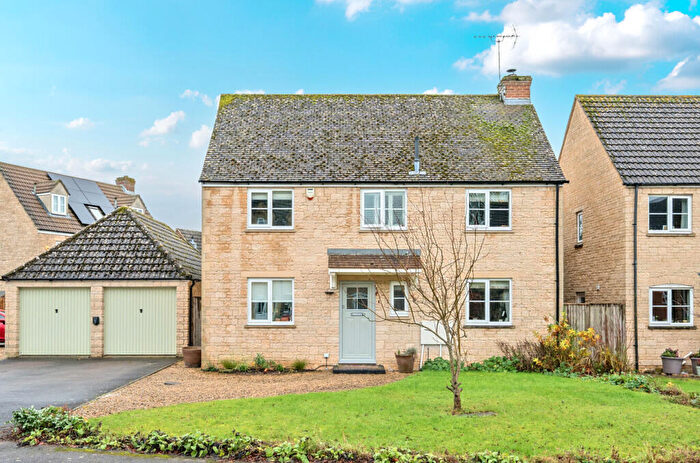
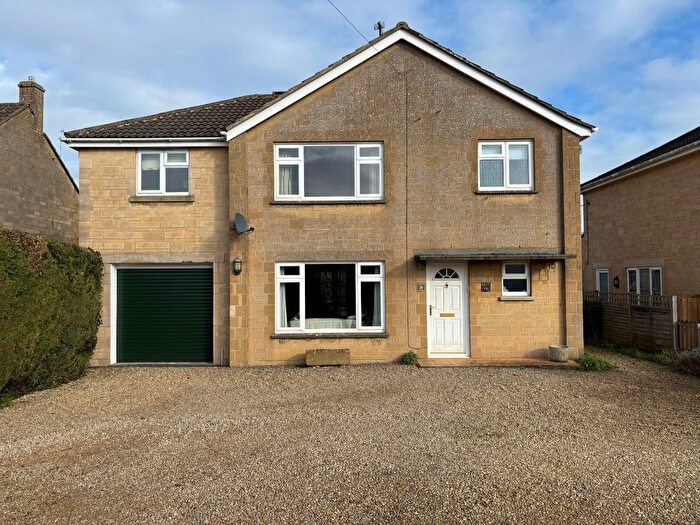
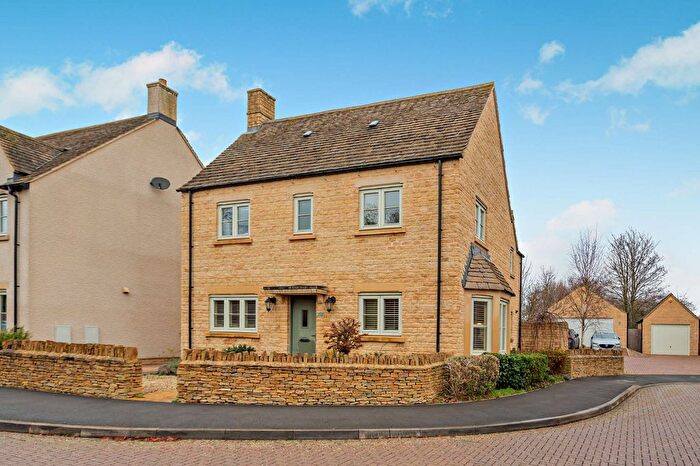
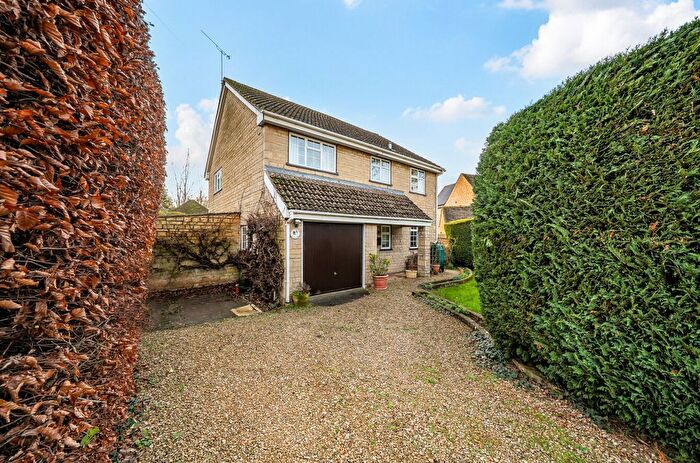
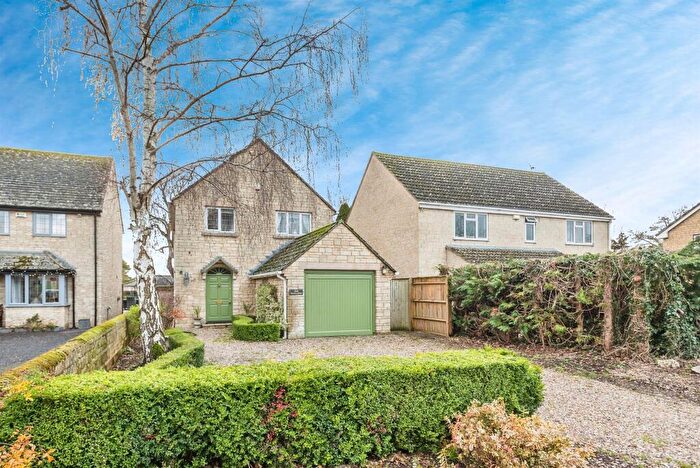
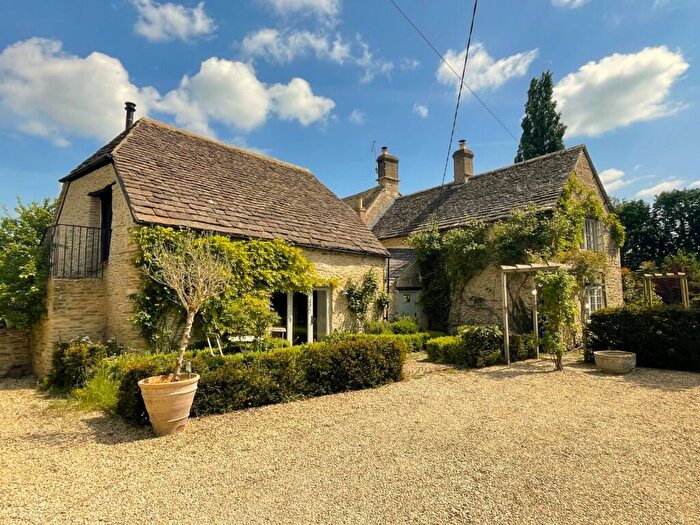
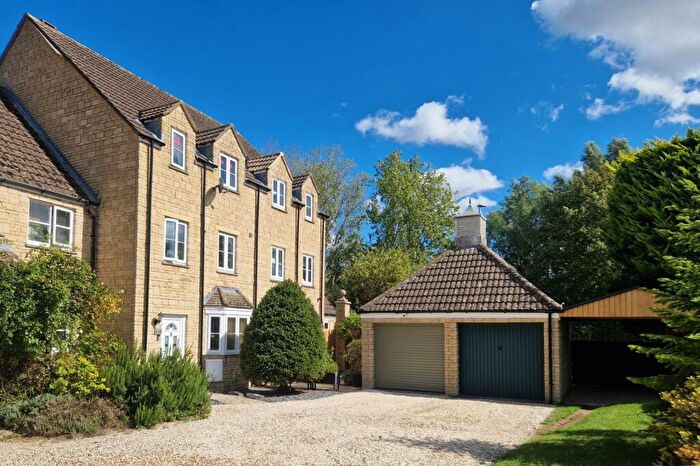
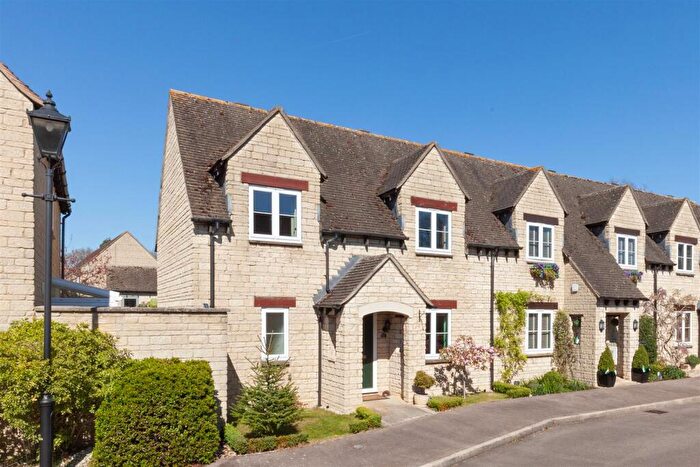
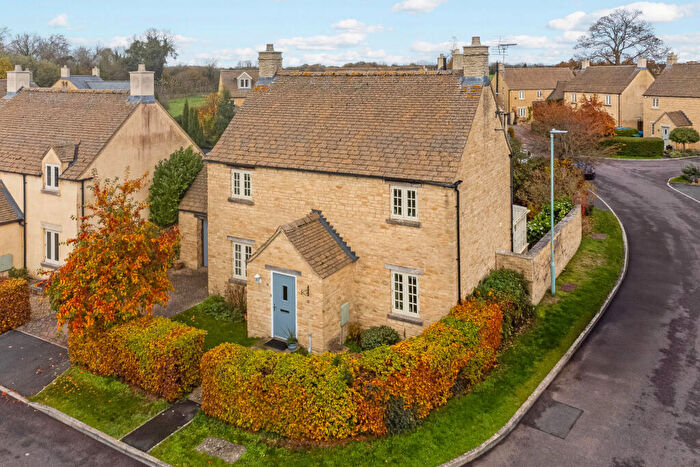
Houses for sale & to rent in Alvescot And Filkins, Lechlade
House Prices in Alvescot And Filkins
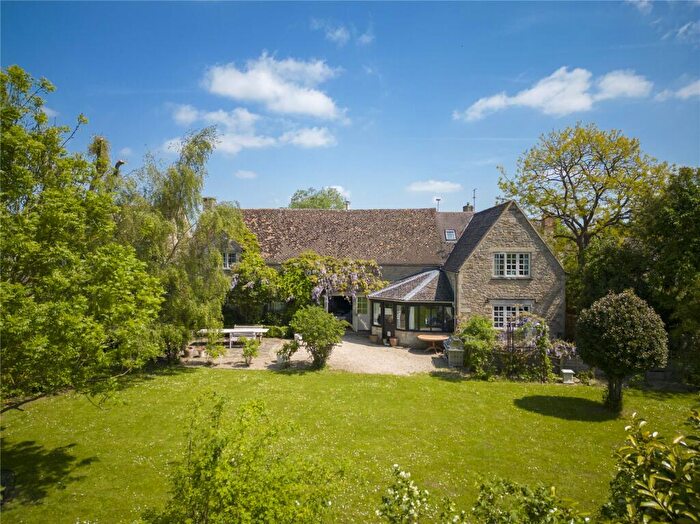
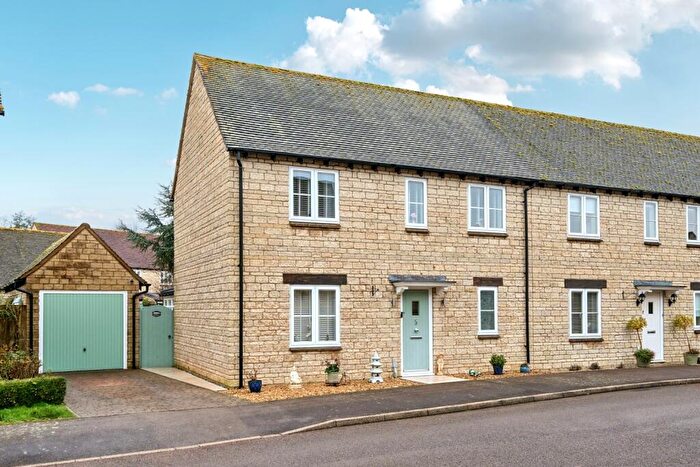
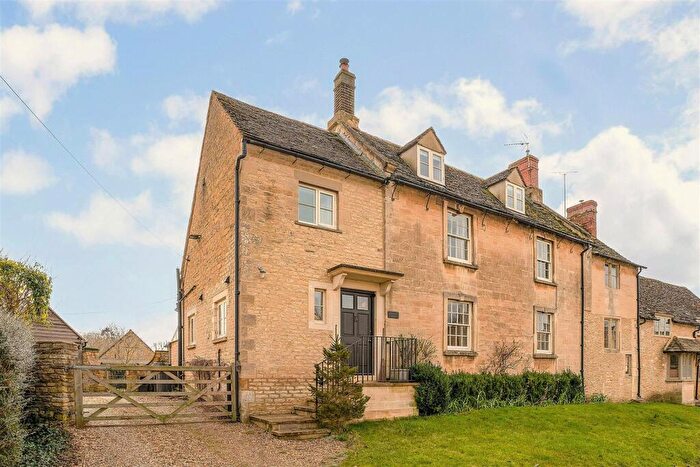
Properties in Alvescot And Filkins have an average house price of £743,624.00 and had 25 Property Transactions within the last 3 years¹.
Alvescot And Filkins is an area in Lechlade, Oxfordshire with 482 households², where the most expensive property was sold for £1,550,000.00.
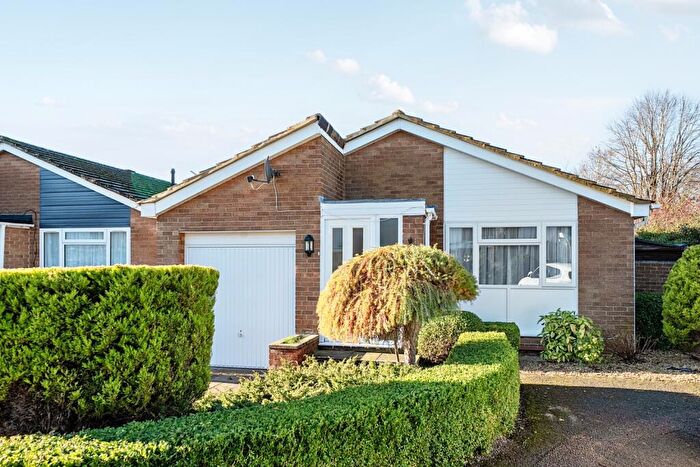
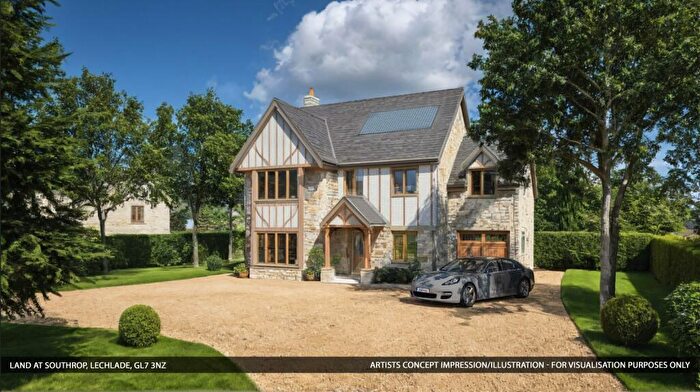
Properties for sale in Alvescot And Filkins
Roads and Postcodes in Alvescot And Filkins
Navigate through our locations to find the location of your next house in Alvescot And Filkins, Lechlade for sale or to rent.
| Streets | Postcodes |
|---|---|
| Bakery Lane | GL7 3LL |
| Broadwell Road | GL7 3LP |
| Broughton Poggs | GL7 3JH |
| Bulls Close | GL7 3HY |
| Burford Road | GL7 3JW |
| Calcroft Lane | GL7 3RH |
| Church Lane | GL7 3LG |
| Church Row | GL7 3LR |
| Cross Tree Lane | GL7 3JL |
| Hazells Lane | GL7 3HX |
| High Street | GL7 3HU GL7 3JB |
| Hooks Close | GL7 3LT |
| Hyetts Gardens | GL7 3JN |
| Langford Downs Farm Cottages | GL7 3QL |
| Lechlade Road | GL7 3LD GL7 3LE GL7 3LA |
| Leys View | GL7 3LH |
| New Cottages | GL7 3HF |
| Rouses Lane | GL7 3JE |
| Saxons Close | GL7 3JD GL7 3JF |
| Station Road | GL7 3LJ |
| The Elms | GL7 3LB |
| The Gardens | GL7 3LW |
| The Gassons | GL7 3HZ |
| The Row | GL7 3QW |
| The Wickets | GL7 3LS |
| GL7 3HD GL7 3HE GL7 3HG GL7 3HJ GL7 3HQ GL7 3JG GL7 3JJ GL7 3JQ GL7 3LF GL7 3LN GL7 3LQ GL7 3QJ GL7 3QN GL7 3QP GL7 3QQ GL7 3QR GL7 3QS GL7 3QT GL7 3QU GL7 3QX GL7 3HH GL7 3JA GL7 3QY GL7 3QZ GL7 3RA GL7 3RB GL7 3RD GL7 3RE GL7 3RF GL7 3RG |
Transport near Alvescot And Filkins
-
Shipton Station
-
Ascott-Under-Wychwood Station
-
Finstock Station
-
Kingham Station
-
Charlbury Station
-
Swindon Station
-
Combe Station
-
Hanborough Station
- FAQ
- Price Paid By Year
- Property Type Price
Frequently asked questions about Alvescot And Filkins
What is the average price for a property for sale in Alvescot And Filkins?
The average price for a property for sale in Alvescot And Filkins is £743,624. There are 565 property listings for sale in Alvescot And Filkins.
What streets have the most expensive properties for sale in Alvescot And Filkins?
The streets with the most expensive properties for sale in Alvescot And Filkins are Cross Tree Lane at an average of £729,100, The Gardens at an average of £690,000 and The Row at an average of £485,000.
What streets have the most affordable properties for sale in Alvescot And Filkins?
The streets with the most affordable properties for sale in Alvescot And Filkins are Hazells Lane at an average of £282,500 and The Elms at an average of £360,000.
Which train stations are available in or near Alvescot And Filkins?
Some of the train stations available in or near Alvescot And Filkins are Shipton, Ascott-Under-Wychwood and Finstock.
Property Price Paid in Alvescot And Filkins by Year
The average sold property price by year was:
| Year | Average Sold Price | Price Change |
Sold Properties
|
|---|---|---|---|
| 2025 | £1,000,000 | 23% |
1 Property |
| 2024 | £768,200 | 10% |
13 Properties |
| 2023 | £691,273 | 5% |
11 Properties |
| 2022 | £658,285 | 9% |
7 Properties |
| 2021 | £597,000 | -19% |
19 Properties |
| 2020 | £707,555 | -18% |
18 Properties |
| 2019 | £835,416 | 22% |
12 Properties |
| 2018 | £653,739 | 19% |
24 Properties |
| 2017 | £532,588 | 11% |
17 Properties |
| 2016 | £476,200 | -6% |
10 Properties |
| 2015 | £506,187 | 17% |
16 Properties |
| 2014 | £421,035 | -10% |
20 Properties |
| 2013 | £464,636 | -13% |
22 Properties |
| 2012 | £523,857 | 13% |
19 Properties |
| 2011 | £456,833 | -24% |
6 Properties |
| 2010 | £565,928 | 37% |
14 Properties |
| 2009 | £357,057 | -62% |
13 Properties |
| 2008 | £578,368 | 19% |
8 Properties |
| 2007 | £467,415 | 2% |
19 Properties |
| 2006 | £460,191 | 1% |
30 Properties |
| 2005 | £454,672 | 20% |
21 Properties |
| 2004 | £362,271 | 15% |
23 Properties |
| 2003 | £308,746 | -3% |
32 Properties |
| 2002 | £318,390 | 33% |
30 Properties |
| 2001 | £213,308 | -15% |
29 Properties |
| 2000 | £244,411 | 0,2% |
18 Properties |
| 1999 | £243,933 | 23% |
17 Properties |
| 1998 | £188,815 | 12% |
22 Properties |
| 1997 | £165,619 | 7% |
22 Properties |
| 1996 | £153,330 | 22% |
15 Properties |
| 1995 | £118,984 | - |
13 Properties |
Property Price per Property Type in Alvescot And Filkins
Here you can find historic sold price data in order to help with your property search.
The average Property Paid Price for specific property types in the last three years are:
| Property Type | Average Sold Price | Sold Properties |
|---|---|---|
| Semi Detached House | £474,333.00 | 6 Semi Detached Houses |
| Detached House | £958,854.00 | 13 Detached Houses |
| Terraced House | £546,583.00 | 6 Terraced Houses |

