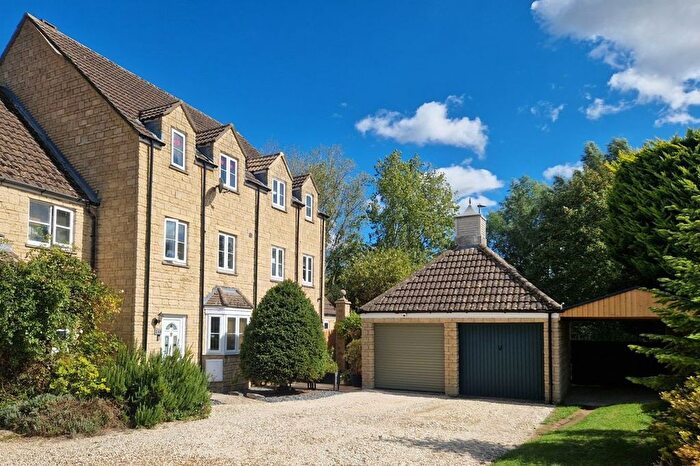
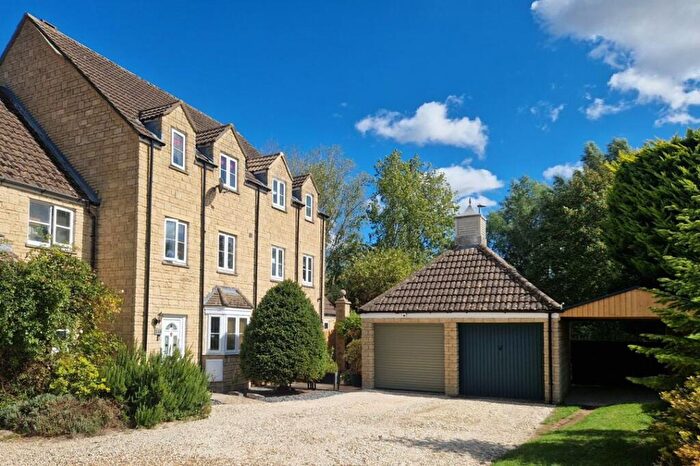
Houses for sale & to rent in Kempsford-lechlade, Lechlade
House Prices in Kempsford-lechlade
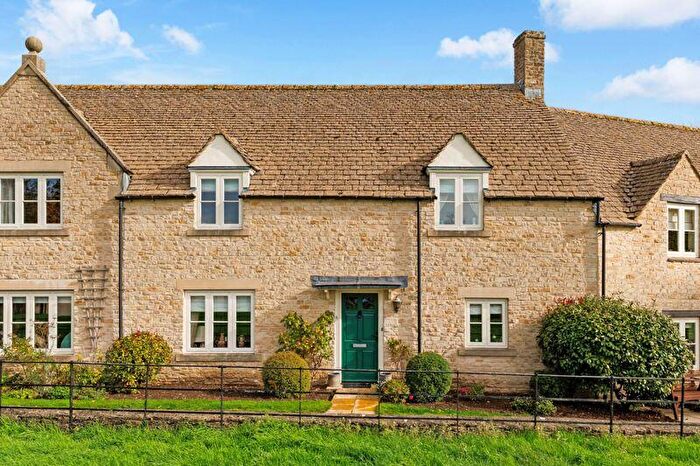
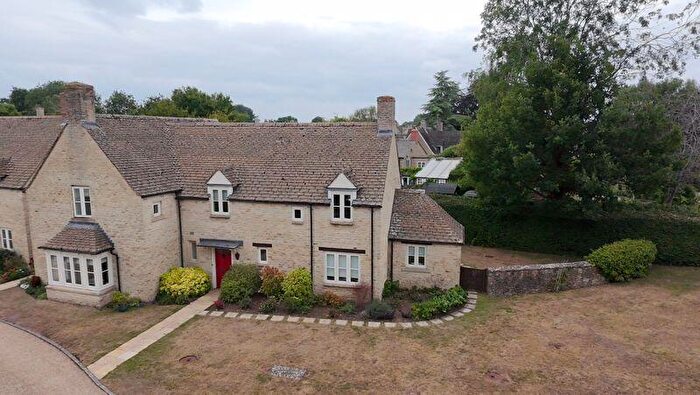
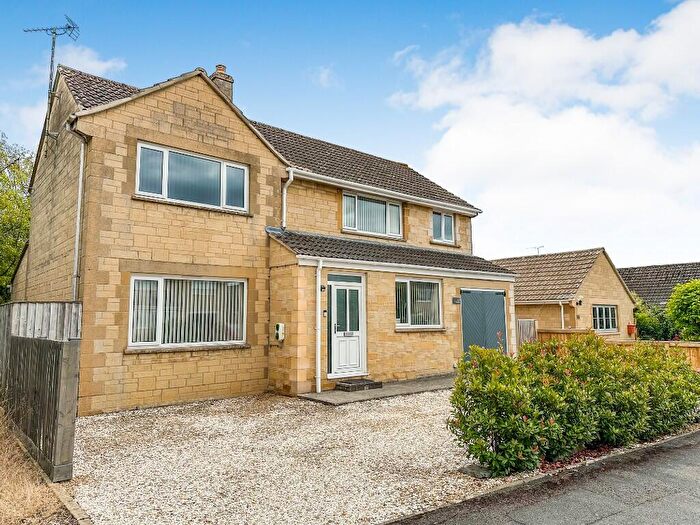
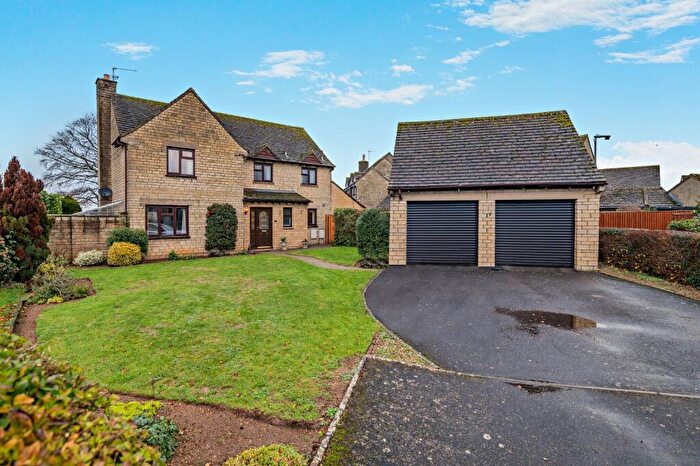
Properties in Kempsford-lechlade have an average house price of £486,535.00 and had 120 Property Transactions within the last 3 years¹.
Kempsford-lechlade is an area in Lechlade, Gloucestershire with 1,073 households², where the most expensive property was sold for £2,212,500.00.
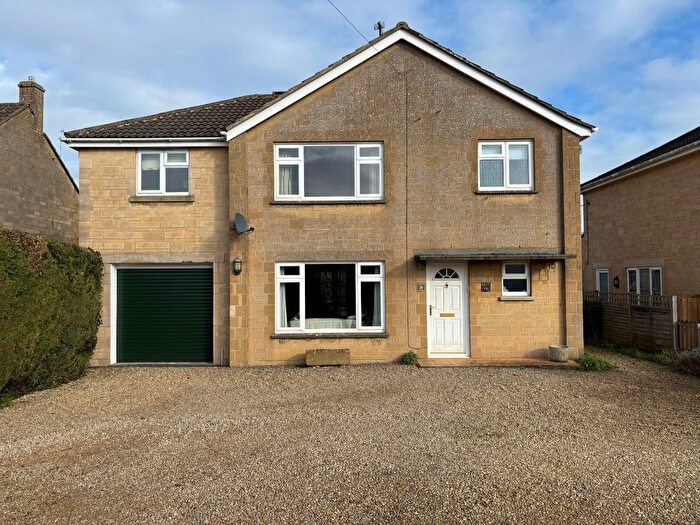
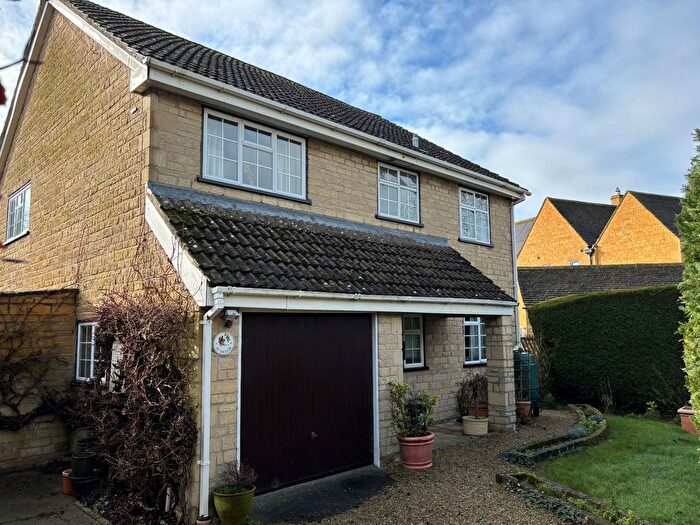
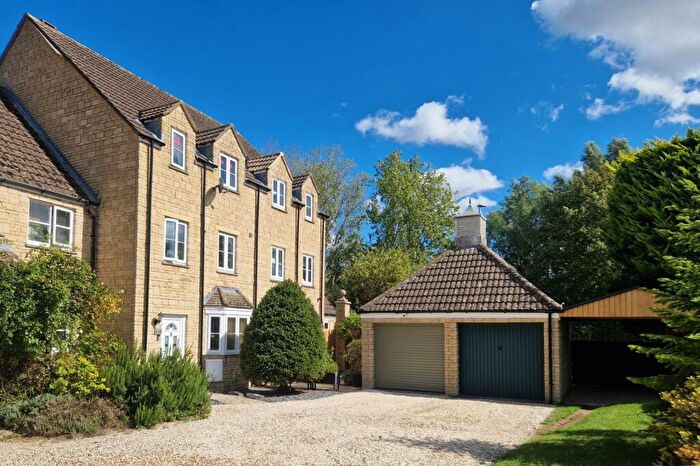
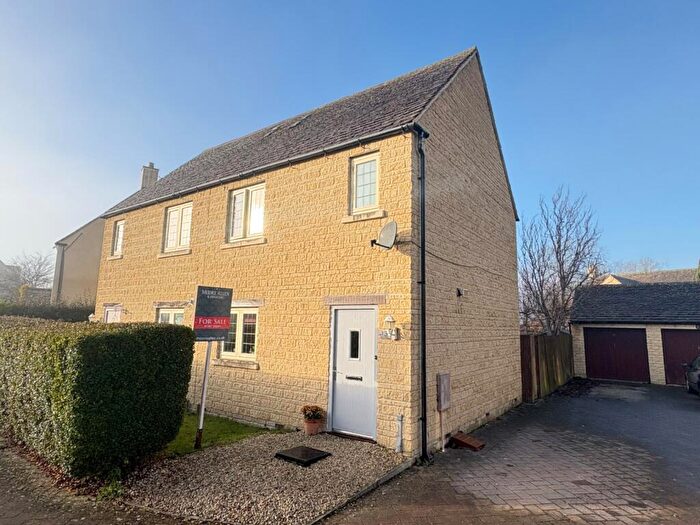
Properties for sale in Kempsford-lechlade
Previously listed properties in Kempsford-lechlade
Roads and Postcodes in Kempsford-lechlade
Navigate through our locations to find the location of your next house in Kempsford-lechlade, Lechlade for sale or to rent.
| Streets | Postcodes |
|---|---|
| Abbots Walk | GL7 3DB |
| Bell Lane | GL7 3AL |
| Briary Road | GL7 3DD |
| Burford Road | GL7 3EN GL7 3ER GL7 3ET GL7 3EW |
| Burford Street | GL7 3AR |
| Butlers Field | GL7 3DF |
| Chancel Way | GL7 3DE |
| East Allcourt | GL7 3FB |
| Fairford Road | GL7 3DN GL7 3DW |
| Gassons Road | GL7 3BH GL7 3BQ |
| Gassons Way | GL7 3BG |
| Hall Court Farm Cottages | GL7 3DH |
| Hambidge Lane | GL7 3BD GL7 3BJ GL7 3BL GL7 3BX |
| Hazeldene | GL7 3EJ |
| High Street | GL7 3AD GL7 3AE |
| Katherines Walk | GL7 3DA |
| Keble Close | GL7 3ES |
| Kelmscott Road | GL7 3HB |
| Kent Place | GL7 3AW |
| Kingsmead | GL7 3BN GL7 3BW |
| Loders Field | GL7 3DJ |
| Longcross Causeway | GL7 3DT |
| Manor Gardens | GL7 3EQ |
| Market Place | GL7 3AB |
| Midway Cottages | GL7 3DX |
| Moorgate | GL7 3EH |
| Mount Pleasant | GL7 3DG |
| Oak Street | GL7 3AX GL7 3AY GL7 3FL |
| Orchard Close | GL7 3EF |
| Perrinsfield | GL7 3SD GL7 3SE |
| Railway Terrace | GL7 3EP |
| Roman Way | GL7 3BP GL7 3BS |
| Rose Villas | GL7 3BE |
| Sherborne Street | GL7 3AH GL7 3AN |
| St Johns Priory | GL7 3EY |
| St Johns Street | GL7 3AS GL7 3AT |
| St Lawrence Road | GL7 3BZ |
| Swan Close | GL7 3AJ GL7 3AP GL7 3BY |
| Swansfield | GL7 3SF |
| Thames Street | GL7 3AG |
| The Close | GL7 3EL |
| The Cursus | GL7 3SB |
| The Spinney | GL7 3RZ |
| The Stables | GL7 3FE |
| The Wern | GL7 3FF |
| Warrens Cross | GL7 3DP GL7 3DR |
| West Allcourt | GL7 3FA |
| West Way | GL7 3BT |
| Wharf Lane | GL7 3AU |
| GL7 3DL GL7 3DS GL7 3EB GL7 3QH |
Transport near Kempsford-lechlade
-
Swindon Station
-
Shipton Station
-
Ascott-Under-Wychwood Station
-
Kemble Station
-
Kingham Station
-
Finstock Station
-
Charlbury Station
- FAQ
- Price Paid By Year
- Property Type Price
Frequently asked questions about Kempsford-lechlade
What is the average price for a property for sale in Kempsford-lechlade?
The average price for a property for sale in Kempsford-lechlade is £486,535. This amount is 6% lower than the average price in Lechlade. There are 288 property listings for sale in Kempsford-lechlade.
What streets have the most expensive properties for sale in Kempsford-lechlade?
The streets with the most expensive properties for sale in Kempsford-lechlade are Loders Field at an average of £753,500, Burford Road at an average of £723,333 and The Stables at an average of £683,214.
What streets have the most affordable properties for sale in Kempsford-lechlade?
The streets with the most affordable properties for sale in Kempsford-lechlade are Butlers Field at an average of £256,666, Rose Villas at an average of £285,000 and Bell Lane at an average of £293,666.
Which train stations are available in or near Kempsford-lechlade?
Some of the train stations available in or near Kempsford-lechlade are Swindon, Shipton and Ascott-Under-Wychwood.
Property Price Paid in Kempsford-lechlade by Year
The average sold property price by year was:
| Year | Average Sold Price | Price Change |
Sold Properties
|
|---|---|---|---|
| 2025 | £516,741 | 6% |
31 Properties |
| 2024 | £487,564 | 4% |
42 Properties |
| 2023 | £465,693 | 6% |
47 Properties |
| 2022 | £437,619 | -7% |
50 Properties |
| 2021 | £467,633 | -3% |
46 Properties |
| 2020 | £481,193 | 28% |
44 Properties |
| 2019 | £347,972 | -18% |
30 Properties |
| 2018 | £409,384 | 13% |
36 Properties |
| 2017 | £357,205 | -6% |
51 Properties |
| 2016 | £379,246 | -2% |
33 Properties |
| 2015 | £385,752 | 28% |
44 Properties |
| 2014 | £278,476 | -18% |
49 Properties |
| 2013 | £328,146 | -2% |
50 Properties |
| 2012 | £335,235 | 13% |
34 Properties |
| 2011 | £292,920 | -4% |
39 Properties |
| 2010 | £304,568 | 17% |
36 Properties |
| 2009 | £252,534 | -15% |
26 Properties |
| 2008 | £290,194 | 8% |
25 Properties |
| 2007 | £267,110 | -7% |
57 Properties |
| 2006 | £286,952 | -10% |
83 Properties |
| 2005 | £315,011 | 14% |
44 Properties |
| 2004 | £269,714 | 15% |
49 Properties |
| 2003 | £229,590 | -0,2% |
51 Properties |
| 2002 | £229,951 | 14% |
74 Properties |
| 2001 | £197,258 | 1% |
67 Properties |
| 2000 | £195,148 | 29% |
70 Properties |
| 1999 | £138,578 | 11% |
51 Properties |
| 1998 | £122,874 | 19% |
64 Properties |
| 1997 | £99,762 | -8% |
60 Properties |
| 1996 | £107,943 | 13% |
57 Properties |
| 1995 | £94,143 | - |
67 Properties |
Property Price per Property Type in Kempsford-lechlade
Here you can find historic sold price data in order to help with your property search.
The average Property Paid Price for specific property types in the last three years are:
| Property Type | Average Sold Price | Sold Properties |
|---|---|---|
| Semi Detached House | £428,318.00 | 22 Semi Detached Houses |
| Detached House | £637,370.00 | 52 Detached Houses |
| Terraced House | £353,094.00 | 43 Terraced Houses |
| Flat | £211,666.00 | 3 Flats |

