
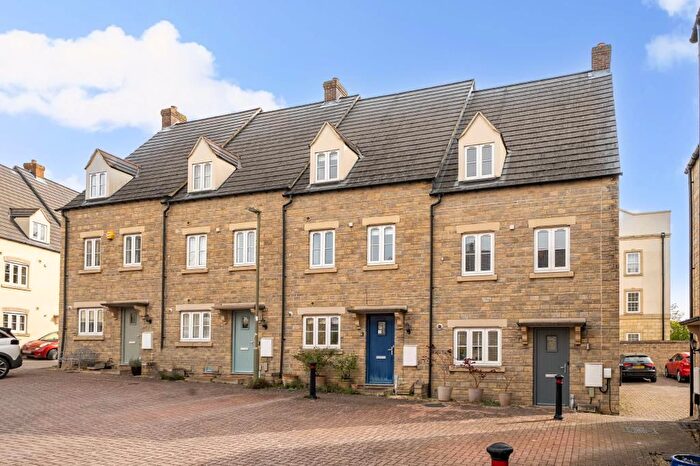
Houses for sale & to rent in Ducklington, Witney
House Prices in Ducklington
Properties in Ducklington have an average house price of £456k and had 88 Property Transactions within the last 3 years¹.
Ducklington is an area in Witney, Oxfordshire with 823 households², where the most expensive property was sold for £1.68M.
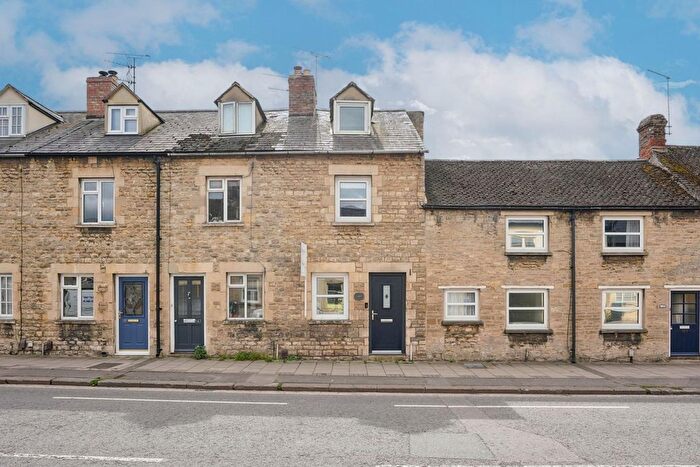
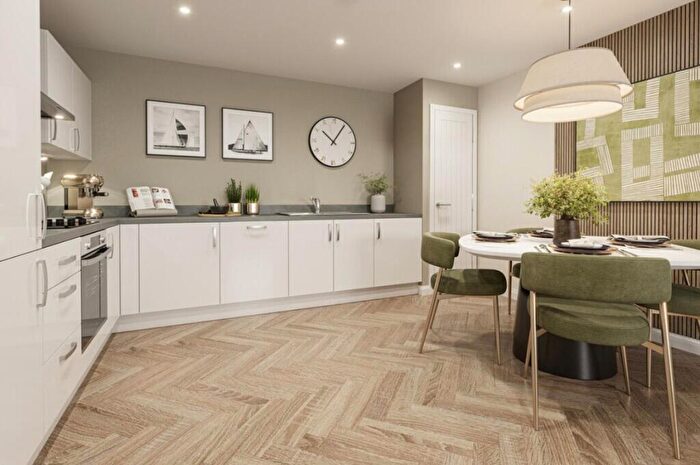
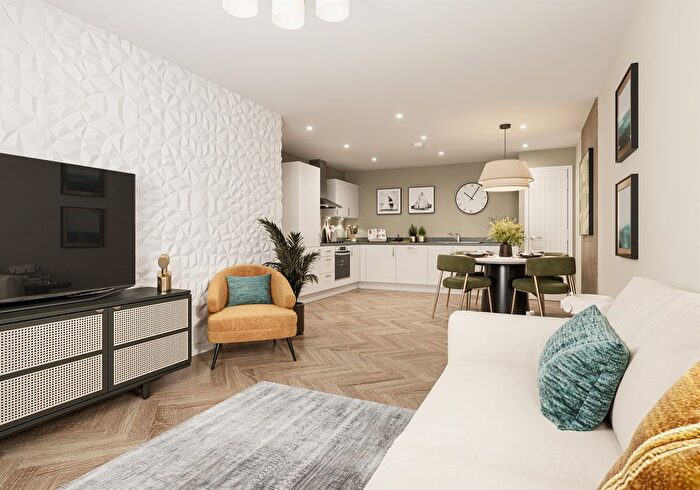
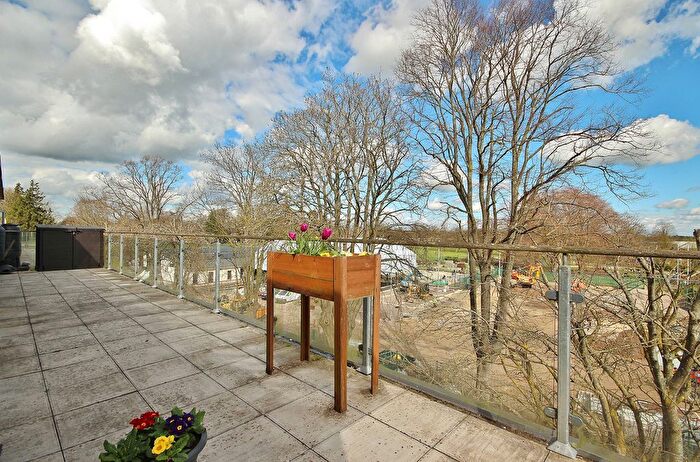
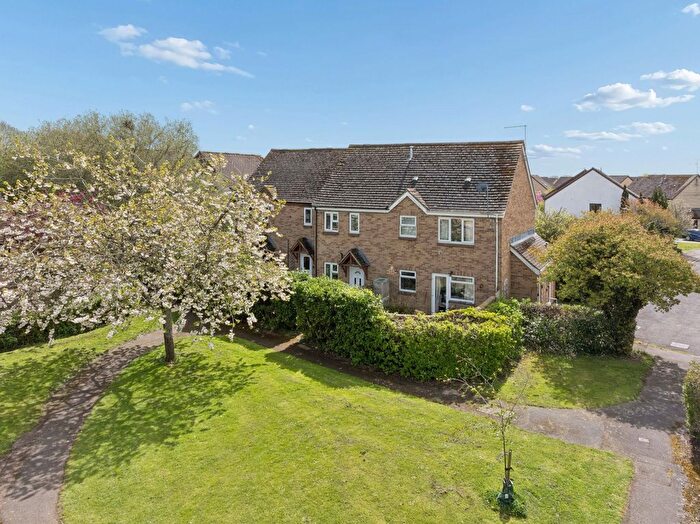
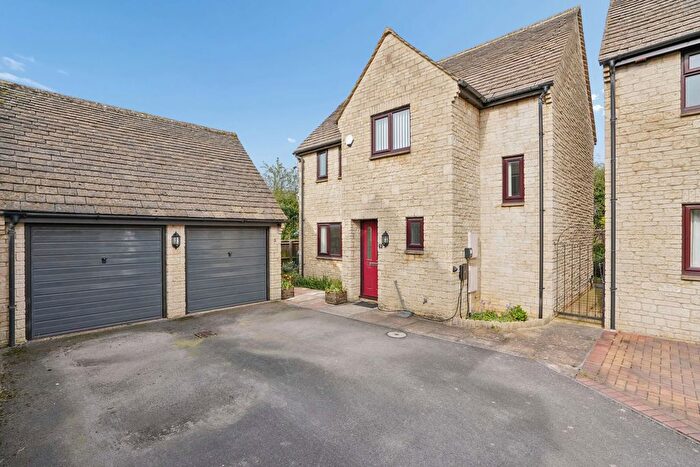
Properties for sale in Ducklington
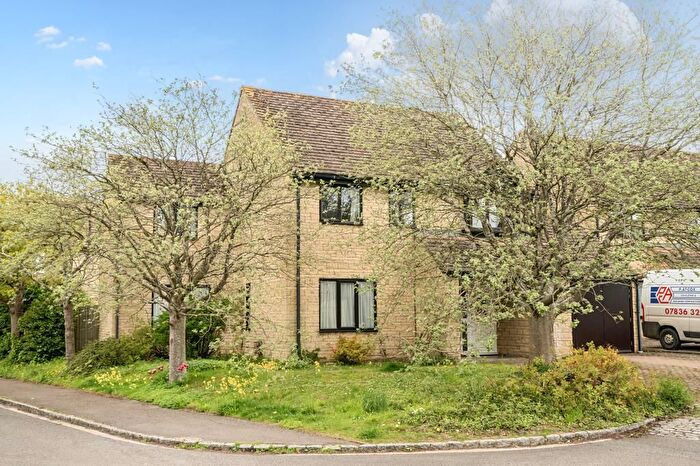
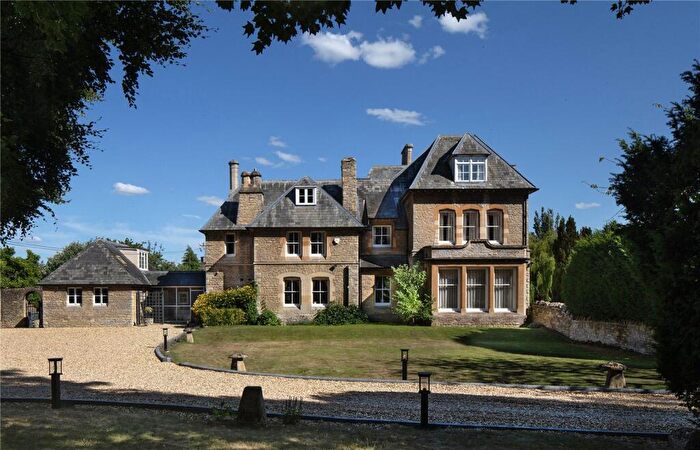
![]()
If you are looking to sell your house, let it out, or receive a property valuation, an expert can help you.
Click the button below to get started.
Roads and Postcodes in Ducklington
Navigate through our locations to find the location of your next house in Ducklington, Witney for sale or to rent.
| Streets | Postcodes |
|---|---|
| Aston Road | OX29 7QZ OX29 7XA OX29 7US |
| Back Lane | OX29 7UE |
| Bampton Road | OX29 7PF |
| Bartholomew Close | OX29 7UJ |
| Beanhill Close | OX29 7XY |
| Beanhill Road | OX29 7XX OX29 7XZ |
| Bromag Industrial Estate | OX29 0RE OX29 0SR |
| Burford Road | OX29 0RB OX28 6DL |
| Carrick Road | OX29 7AF |
| Chalcroft Close | OX29 7TP |
| Church Row | OX29 7NU |
| Church Street | OX29 7UA OX29 7UF OX29 7UG OX29 7UT |
| Clover Lane | OX29 0AH |
| Cokethorpe Park | OX29 7PS |
| Course Hill Lane | OX29 7YL |
| Curbridge | OX29 7NY OX29 7NZ |
| Curbridge Business Park | OX29 7WJ |
| Curbridge Road | OX29 7XN OX29 7XP OX29 7XW OX29 7YJ |
| Dale Walk | OX29 7TR |
| Dovecote Place | OX29 7AX |
| Ducklington Lane | OX28 4TQ OX28 4EX OX28 4TT OX28 5JH |
| Elm Terrace | OX29 7PE |
| Feilden Close | OX29 7XB OX29 7XF OX29 7XE |
| Fritillary Mews | OX29 7AB |
| Furrow Crescent | OX29 0AP OX29 0AQ |
| Granary Close | OX29 0AS |
| Grassland Close | OX29 0AL |
| Hay Lane | OX29 0AJ |
| Lew Road | OX29 7PD OX29 7DG |
| Lovell Close | OX29 7YQ |
| Macray Road | OX29 7YF |
| Main Road | OX29 7NT OX29 7NN OX29 7NS |
| Manor Road | OX29 7YA OX29 7YD |
| Mill Meadow | OX29 7AY |
| Millet Way | OX29 0AR |
| Minster Industrial Estate | OX29 0QS |
| Moors Close | OX29 7TW |
| New Close Lane | OX29 7GX |
| Orchard Mews | OX29 7NW |
| Park Road | OX29 7YE |
| Peel Close | OX29 7YB |
| Plough Close | OX29 0AN |
| Pound Close | OX29 7TH |
| Ronroe Close | OX29 7DN |
| Rye Crescent | OX29 0AT |
| Sealham Road | OX29 7XU |
| Standlake Road | OX29 7UR OX29 7UY OX29 7UZ OX29 7XG OX29 7UP OX29 7UU OX29 7UX |
| Starnham Road | OX29 7XR OX29 7XS OX29 7XT |
| Strainges Close | OX29 7XD |
| Supergas Industrial Estate | OX29 0SZ |
| The Square | OX29 7UB OX29 7UD |
| Tristram Road | OX29 7XJ OX29 7XL OX29 7XH |
| Well Lane | OX29 7PA OX29 7PB |
| Wheatfield Drive | OX29 0AF OX29 0AG |
| Witney Road | OX29 7TN OX29 7TS OX29 7TX OX29 7TY OX29 7TZ OX29 7TU |
| Yew Tree Mews | OX29 7UQ |
| OX29 7YH |
Transport near Ducklington
-
 Finstock Station
 -
Combe Station
-
Hanborough Station
-
Charlbury Station
-
Ascott-Under-Wychwood Station
-
Shipton Station
-
Oxford Parkway Station
-
Oxford Station
- FAQ
- Price Paid By Year
- Property Type Price
Frequently asked questions about Ducklington
What is the average price for a property for sale in Ducklington?
The average price for a property for sale in Ducklington is £455,728. This amount is 10% higher than the average price in Witney. There are 3,048 property listings for sale in Ducklington.
What streets have the most expensive properties for sale in Ducklington?
The streets with the most expensive properties for sale in Ducklington are Standlake Road at an average of £992,500, Clover Lane at an average of £640,000 and Church Street at an average of £630,000.
What streets have the most affordable properties for sale in Ducklington?
The streets with the most affordable properties for sale in Ducklington are Ducklington Lane at an average of £178,250, Furrow Crescent at an average of £296,245 and Fritillary Mews at an average of £313,750.
Which train stations are available in or near Ducklington?
Some of the train stations available in or near Ducklington are Finstock, Combe and Hanborough.
Property Price Paid in Ducklington by Year
The average sold property price by year was:
| Year | Average Sold Price | Price Change |
Sold Properties
|
|---|---|---|---|
| 2026 | £235,000 | -77% |
1 Property |
| 2025 | £415,647 | -11% |
23 Properties |
| 2024 | £460,068 | -6% |
32 Properties |
| 2023 | £487,093 | -0,4% |
32 Properties |
| 2022 | £489,217 | 19% |
45 Properties |
| 2021 | £398,395 | 9% |
67 Properties |
| 2020 | £364,494 | -12% |
57 Properties |
| 2019 | £408,219 | -3% |
38 Properties |
| 2018 | £420,223 | 4% |
48 Properties |
| 2017 | £403,213 | -0,2% |
18 Properties |
| 2016 | £403,886 | 19% |
24 Properties |
| 2015 | £327,723 | 3% |
31 Properties |
| 2014 | £316,266 | -4% |
30 Properties |
| 2013 | £329,875 | -0,3% |
32 Properties |
| 2012 | £331,002 | 8% |
21 Properties |
| 2011 | £305,414 | -7% |
24 Properties |
| 2010 | £327,043 | 22% |
23 Properties |
| 2009 | £253,586 | 9% |
29 Properties |
| 2008 | £231,659 | -29% |
22 Properties |
| 2007 | £299,447 | 6% |
28 Properties |
| 2006 | £281,550 | 7% |
47 Properties |
| 2005 | £260,774 | 17% |
29 Properties |
| 2004 | £216,748 | 9% |
36 Properties |
| 2003 | £197,780 | 4% |
36 Properties |
| 2002 | £189,998 | 16% |
48 Properties |
| 2001 | £159,311 | -12% |
43 Properties |
| 2000 | £179,140 | 32% |
33 Properties |
| 1999 | £122,636 | 11% |
48 Properties |
| 1998 | £108,788 | -11% |
52 Properties |
| 1997 | £120,671 | 28% |
47 Properties |
| 1996 | £86,320 | -16% |
55 Properties |
| 1995 | £99,700 | - |
15 Properties |
Property Price per Property Type in Ducklington
Here you can find historic sold price data in order to help with your property search.
The average Property Paid Price for specific property types in the last three years are:
| Property Type | Average Sold Price | Sold Properties |
|---|---|---|
| Semi Detached House | £383,995.00 | 32 Semi Detached Houses |
| Detached House | £597,281.00 | 40 Detached Houses |
| Terraced House | £348,750.00 | 8 Terraced Houses |
| Flat | £141,875.00 | 8 Flats |