
Houses for sale in Witney, Oxfordshire
House Prices in Witney
Properties in Witney have an average house price of £411k and had 2,171 Property Transactions within the last 3 years.¹
Witney is an area in Oxfordshire with 23,595 households², where the most expensive property was sold for £3.5M.
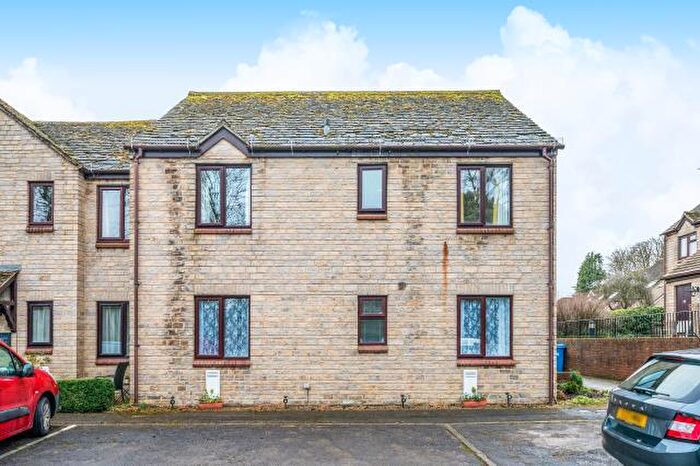
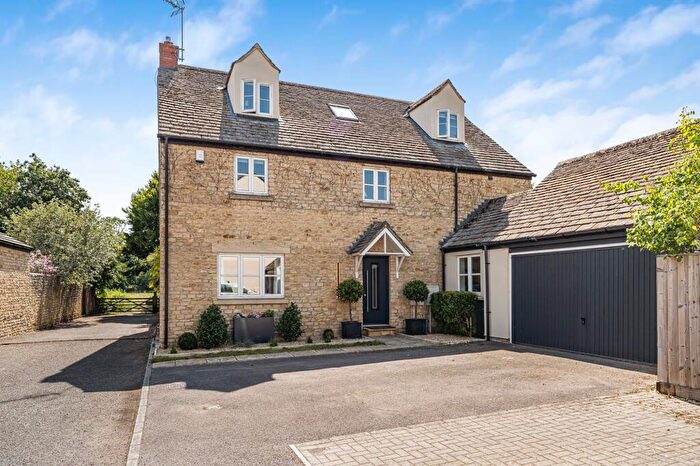
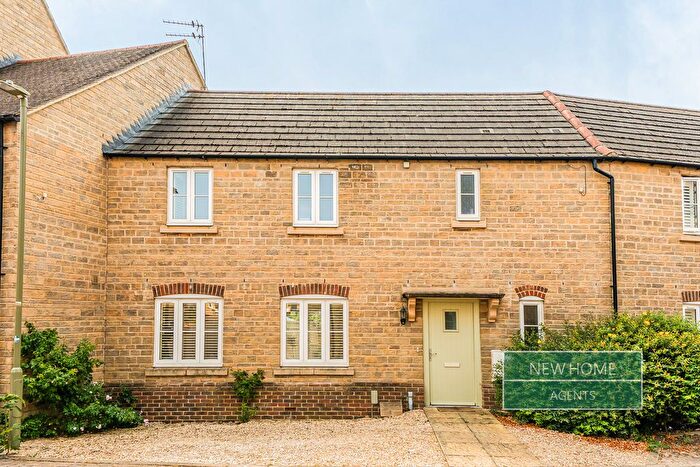
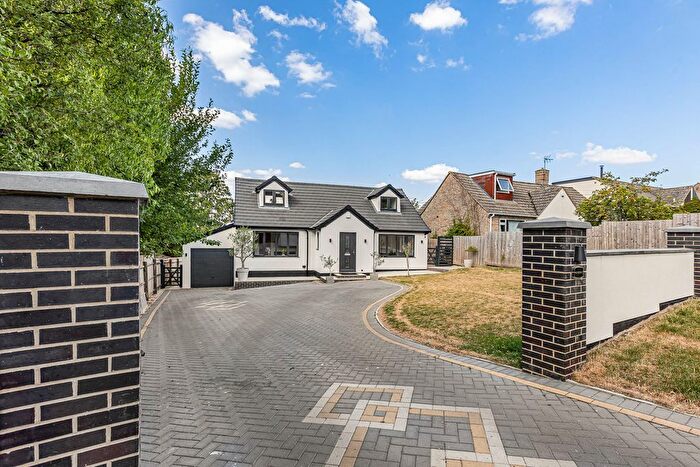
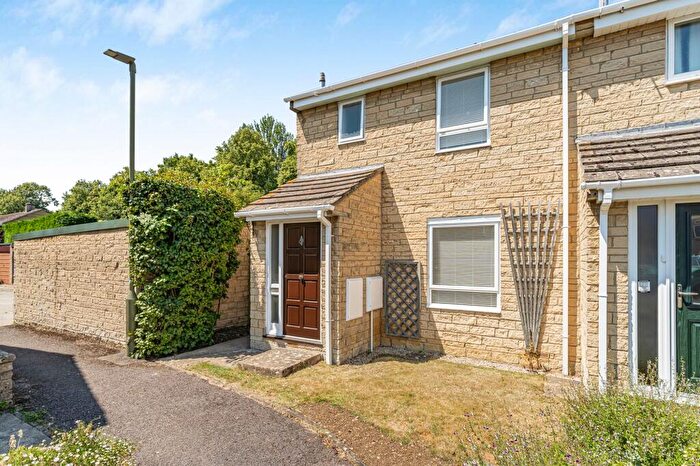
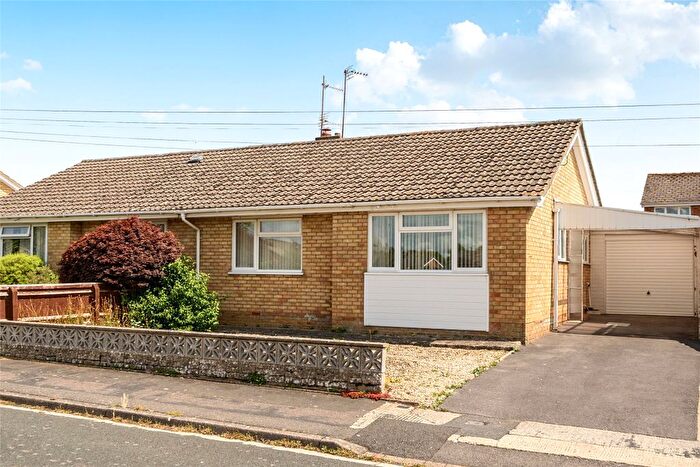
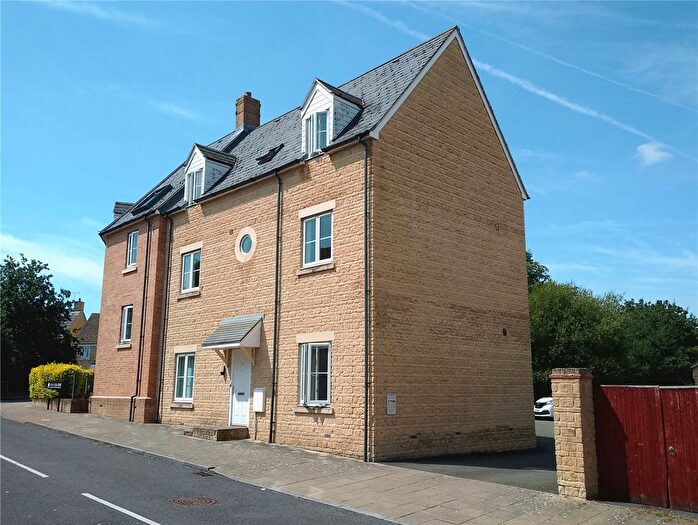
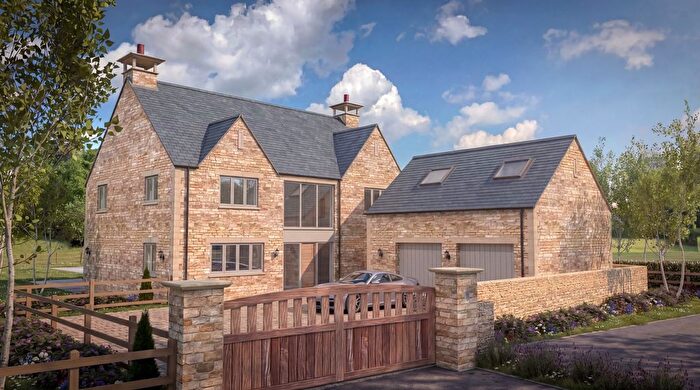
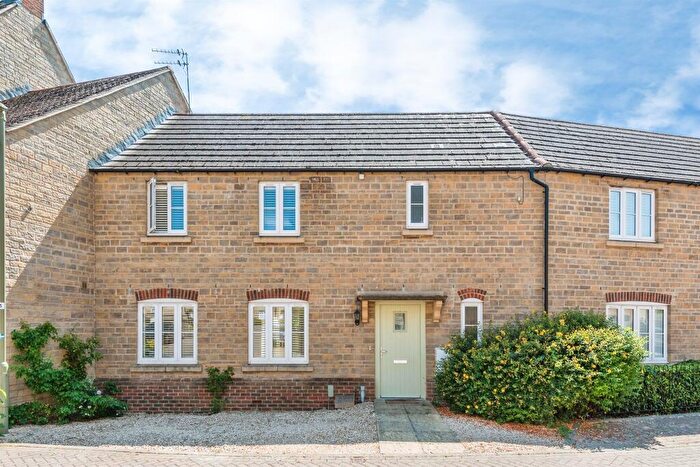
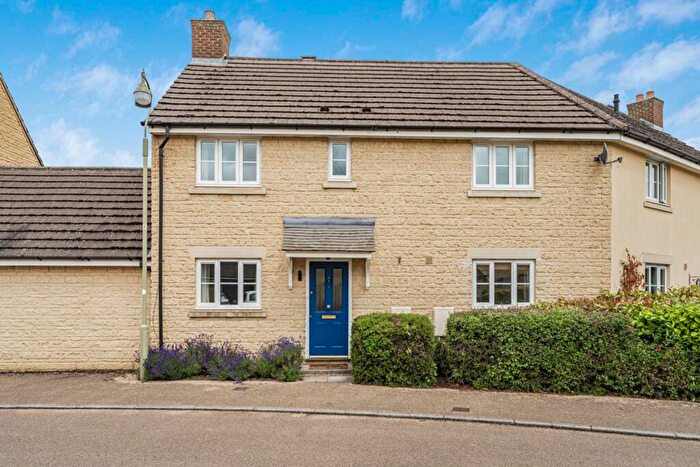
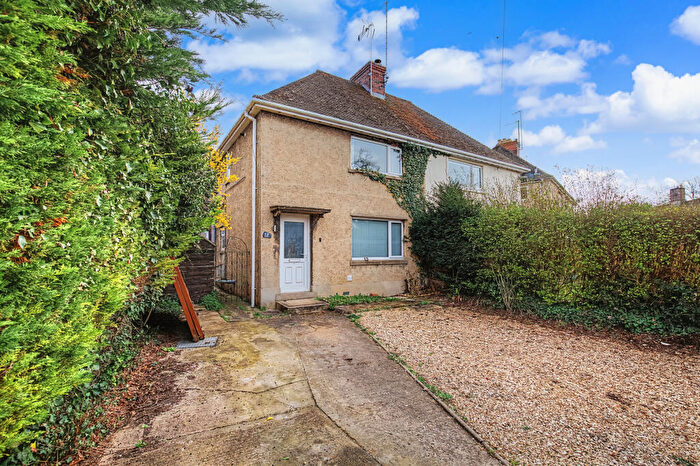
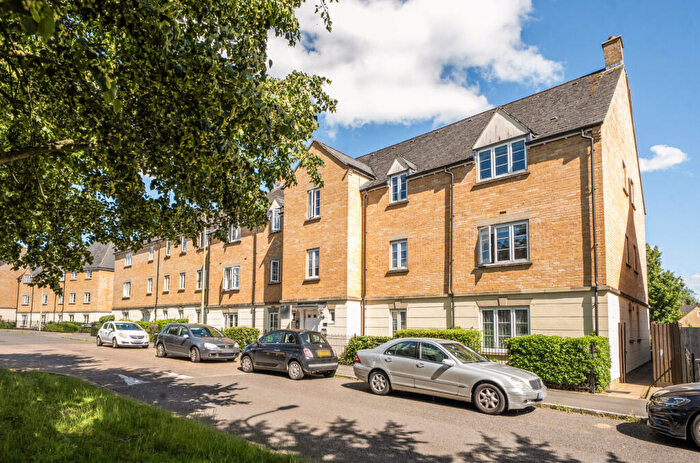
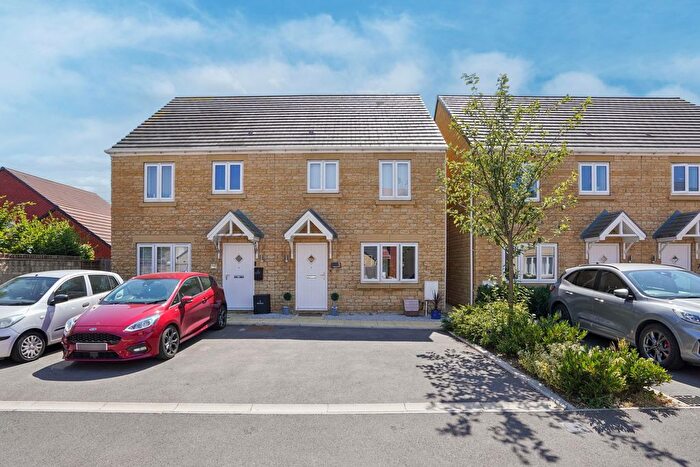
Properties for sale in Witney
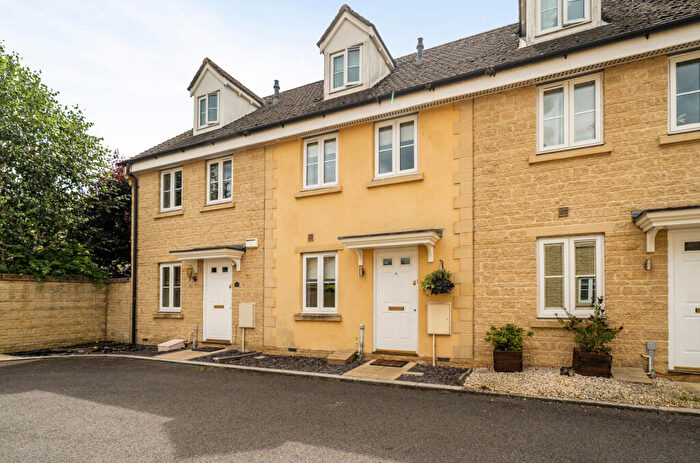
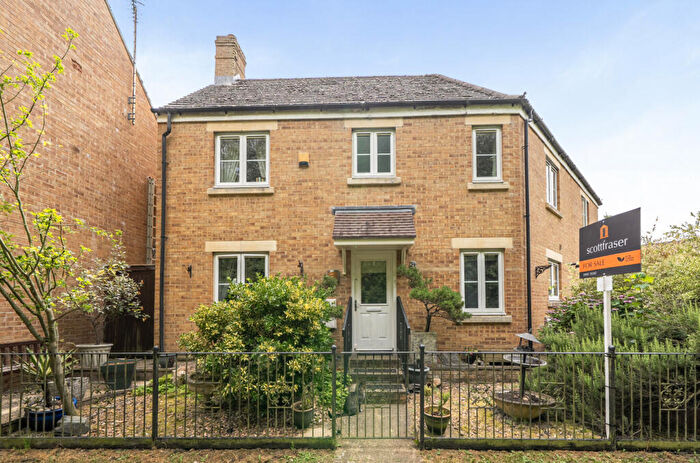
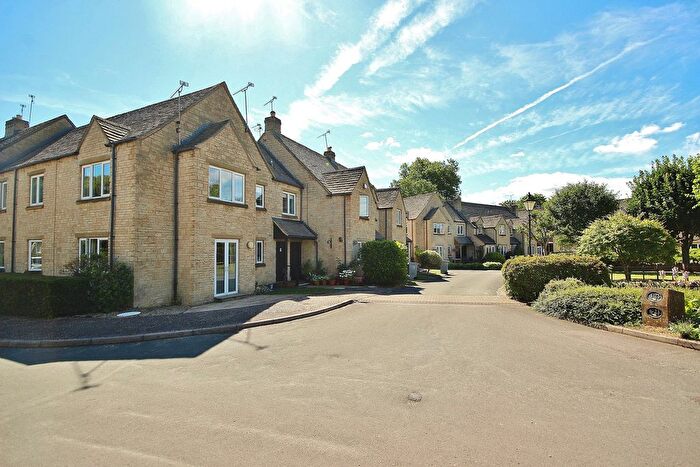
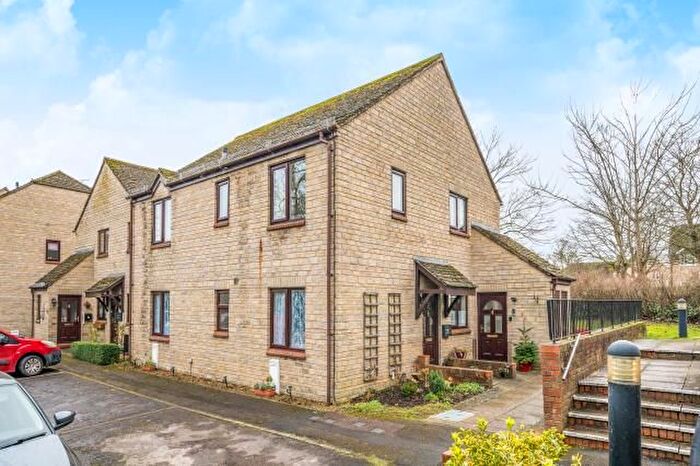
![]()
If you are looking to sell your house, let it out, or receive a property valuation, an expert can help you.
Click the button below to get started.

Neighbourhoods in Witney
Navigate through our locations to find the location of your next house in Witney, Oxfordshire for sale or to rent.
- Appleton And Cumnor
- Brize Norton And Shilton
- Ducklington
- Eynsham And Cassington
- Freeland And Hanborough
- Hailey, Minster Lovell And Leafield
- North Leigh
- Standlake, Aston And Stanton Harcourt
- Stonesfield And Tackley
- Witney Central
- Witney East
- Witney North
- Witney South
- Witney West
- Cumnor
- Kidlington West
Property price trends in Witney
According to the latest Land Registry data, the average home in Witney sold for £403,077 in 2026. That figure comes from a substantial record of 29,112 sales logged over the past 31 years.
Prices have held fairly steady over the last three years. Compared with 2023, when the typical sale came in around £402,637, values are broadly unchanged.
Looking back five years, average prices are up about 0.6% since 2021, a gain of around £2,475 in cash terms.
Zoom out to the past decade for the fuller picture. Back in 2016, homes here averaged £352,151, so the typical sold price has climbed about 14.5% since then, roughly 1.4% a year. Stretch the view to fifteen years and that annual pace edges up closer to 2.7%.
Frequently asked questions about Witney
What is the average price for a property for sale in Witney?
The average price for a property for sale in Witney is £411,206. This amount is 14% lower than the average price in Oxfordshire. There are 9,447 property listings for sale in Witney.
What locations have the most expensive properties for sale in Witney?
The locations with the most expensive properties for sale in Witney are Brize Norton And Shilton at an average of £668,200, Standlake, Aston And Stanton Harcourt at an average of £664,411 and Hailey, Minster Lovell And Leafield at an average of £561,428.
What locations have the most affordable properties for sale in Witney?
The locations with the most affordable properties for sale in Witney are Witney South at an average of £319,887, Witney East at an average of £344,269 and Witney Central at an average of £356,795.
Which train stations are available in or near Witney?
Some of the train stations available in or near Witney are Combe, Finstock and Hanborough.
Property Price Paid in Witney by Year
The average sold property price by year was:
| Year | Average Sold Price | Price Change |
Sold Properties
|
|---|---|---|---|
| 2026 | £403,077 | -5% |
51 Properties |
| 2025 | £422,190 | 3% |
696 Properties |
| 2024 | £409,639 | 2% |
710 Properties |
| 2023 | £402,637 | -5% |
714 Properties |
| 2022 | £423,001 | 5% |
826 Properties |
| 2021 | £400,602 | 4% |
1,203 Properties |
| 2020 | £384,342 | 2% |
881 Properties |
| 2019 | £375,303 | -1% |
995 Properties |
| 2018 | £377,863 | 2% |
937 Properties |
| 2017 | £370,587 | 5% |
842 Properties |
Property Price per Property Type in Witney
Here you can find historic sold price data in order to help with your property search.
The average Property Paid Price for specific property types in the last three years are:
| Property Type | Average Sold Price | Sold Properties |
|---|---|---|
| Semi Detached House | £394,939.00 | 647 Semi Detached Houses |
| Terraced House | £343,689.00 | 532 Terraced Houses |
| Detached House | £603,416.00 | 611 Detached Houses |
| Flat | £224,861.00 | 381 Flats |
Transport in Witney
Please see below transportation links in this area:
