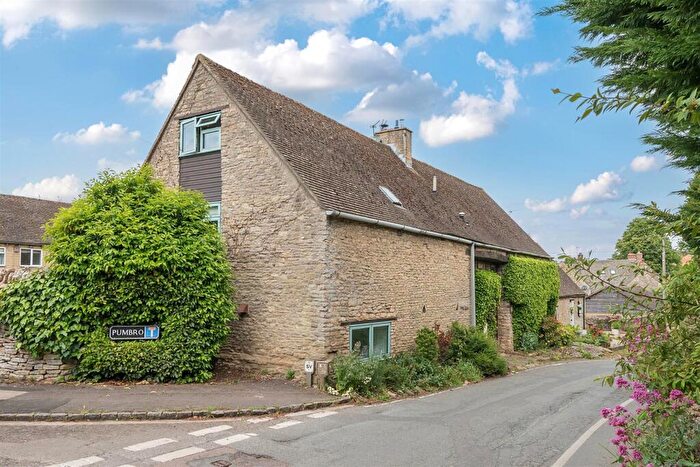
Houses for sale & to rent in Stonesfield And Tackley, Witney
House Prices in Stonesfield And Tackley
Properties in Stonesfield And Tackley have an average house price of £516,042.00 and had 70 Property Transactions within the last 3 years¹.
Stonesfield And Tackley is an area in Witney, Oxfordshire with 939 households², where the most expensive property was sold for £3,310,000.00.
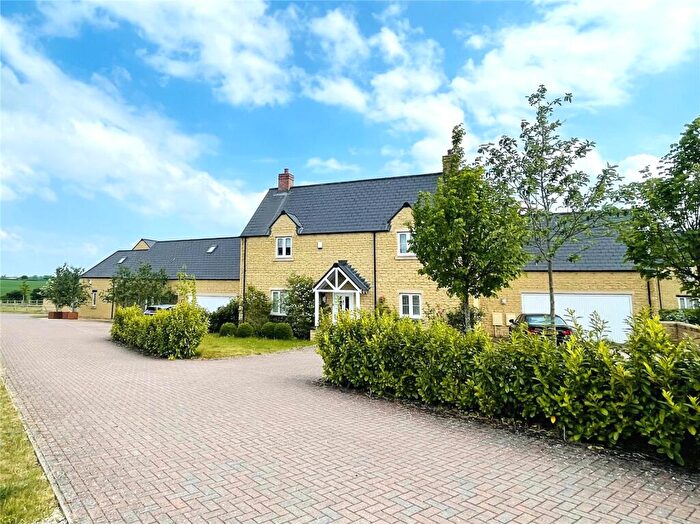
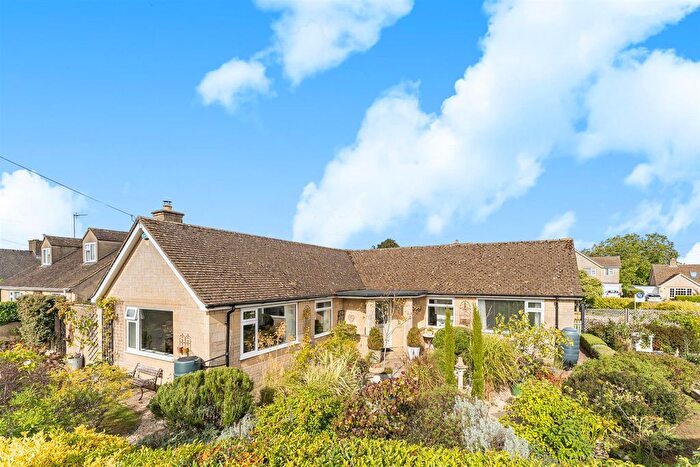
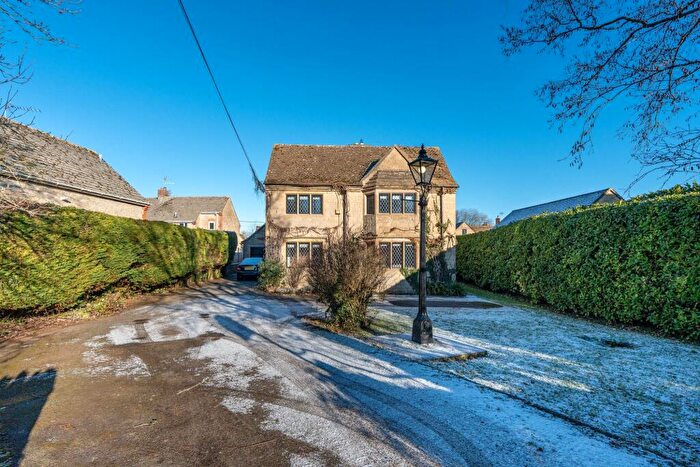
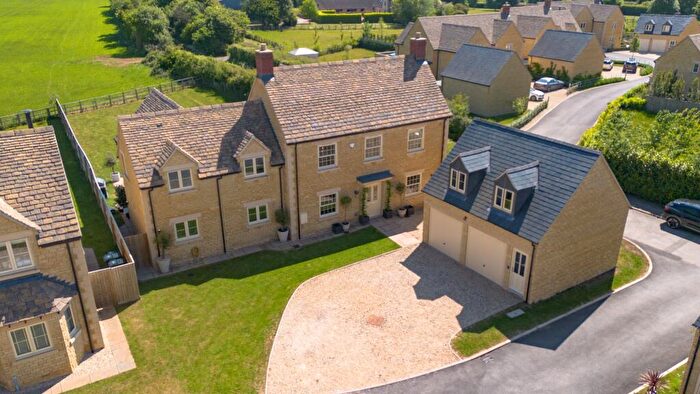
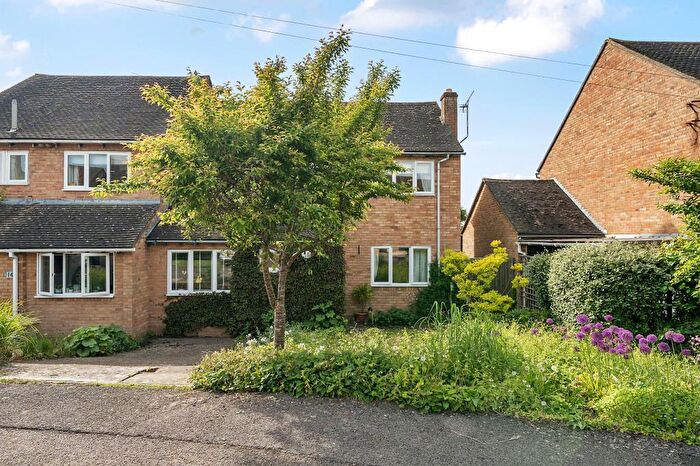
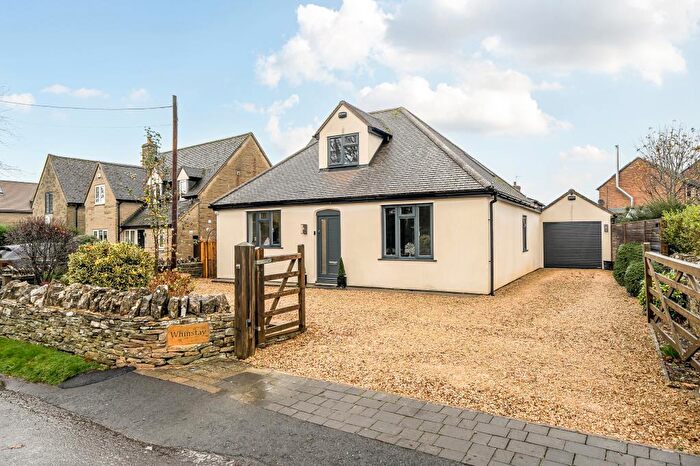
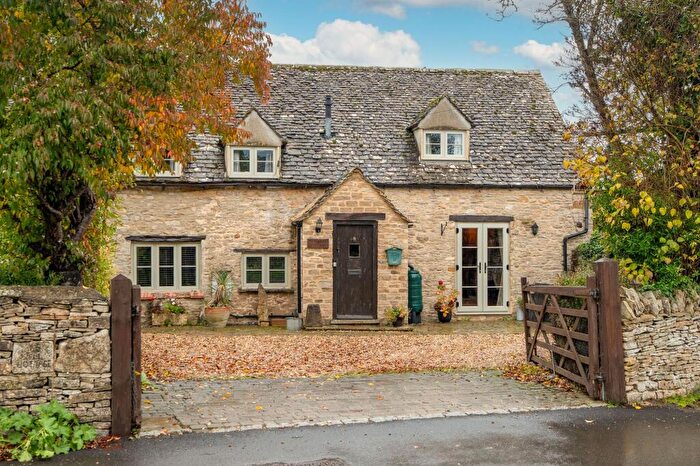
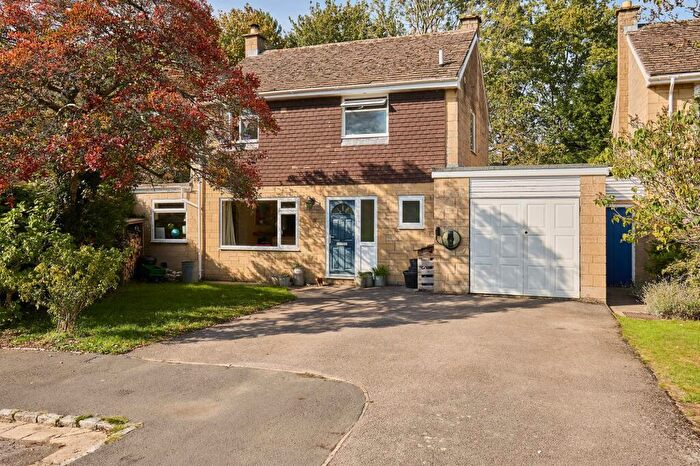
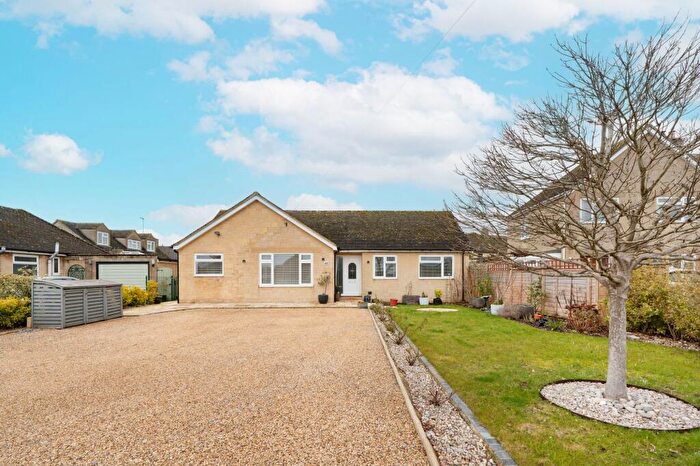
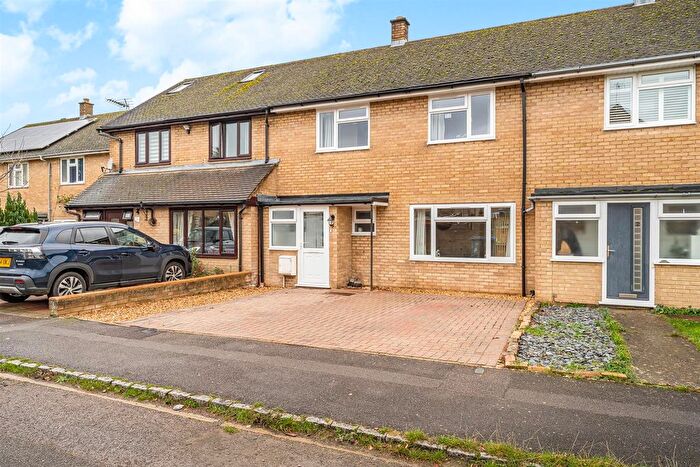
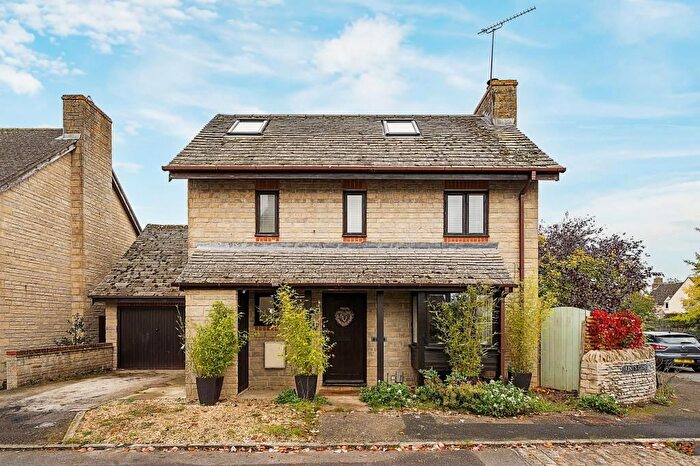
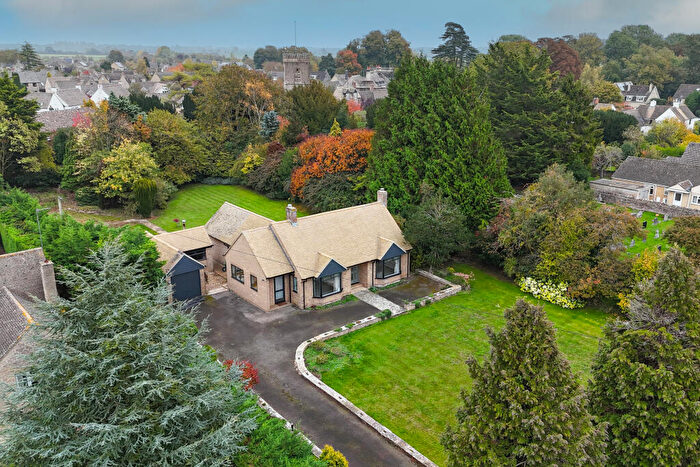
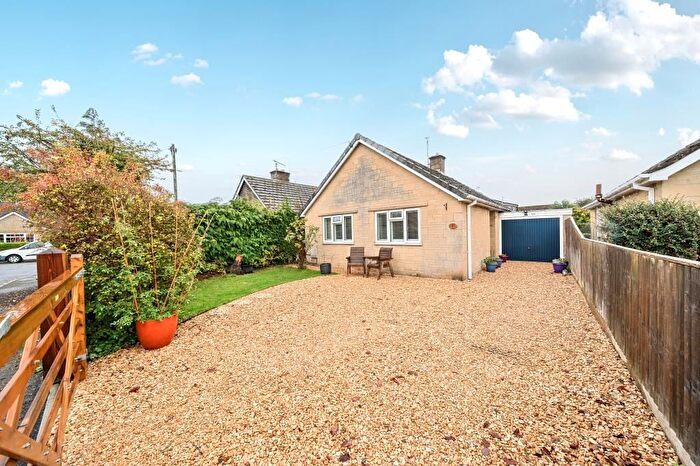
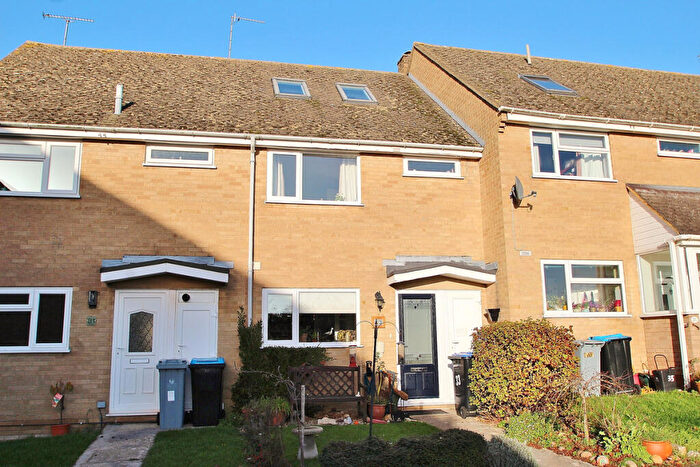
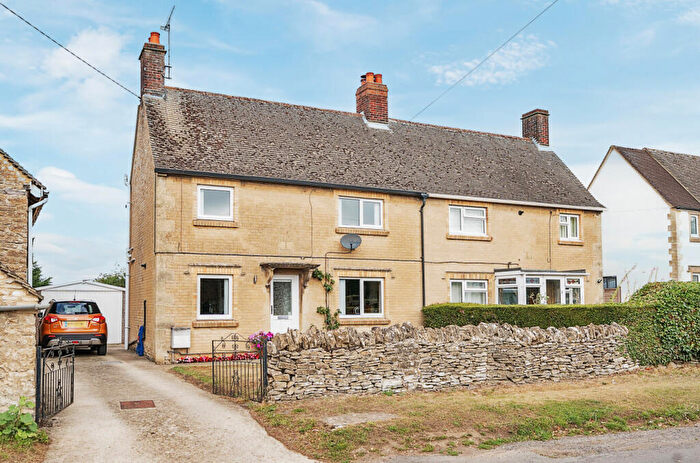
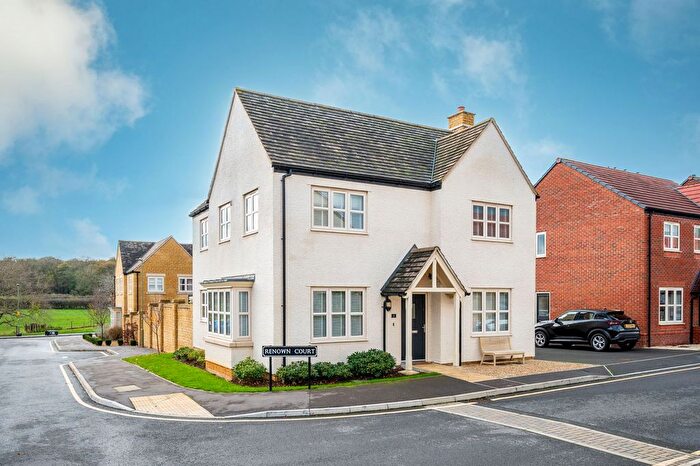
Properties for sale in Stonesfield And Tackley
Previously listed properties in Stonesfield And Tackley
Roads and Postcodes in Stonesfield And Tackley
Navigate through our locations to find the location of your next house in Stonesfield And Tackley, Witney for sale or to rent.
| Streets | Postcodes |
|---|---|
| Akeman Street | OX29 8NX OX29 8NZ OX29 8EN |
| Barretts Close | OX29 8PW |
| Bishops Meadow | OX29 8LS |
| Boltons Lane | OX29 8NB |
| Boot Street | OX29 8PX |
| Brook Lane | OX29 8PR |
| Busby Close | OX29 8EU |
| Chatterpie Lane | OX29 8PG |
| Church Cottages | OX29 8NS |
| Church Street | OX29 8PS |
| Church Walk | OX29 8NQ |
| Churchfields | OX29 8PP OX29 8QZ OX29 8ST OX29 8QY |
| Cockshoot Close | OX29 8ED |
| Combe Gate | OX29 8NY |
| Combe Road | OX29 8QB OX29 8QD OX29 8RH |
| East End | OX29 8NF |
| Farley Close | OX29 8EE |
| Farley Lane | OX29 8HB |
| Field Close | OX29 8HA |
| Friends Close | OX29 8PH |
| Glovers Yard | OX29 8QU |
| Greenfield Crescent | OX29 8EH |
| Greenfield Road | OX29 8EQ |
| High Street | OX29 8PU OX29 8QJ |
| Horns Lane | OX29 8NH OX29 8NJ OX29 8DT |
| Hunts Close | OX29 8QG OX29 8QQ |
| Iris Lane | OX29 8NE |
| Knott Oaks | OX29 8PJ |
| Laughton Hill | OX29 8DY |
| Limbeck Way | OX29 8FJ |
| Longore | OX29 8EF |
| Maltsters | OX29 8PN |
| Maplewell | OX29 8EZ |
| Marlborough Terrace | OX29 8NN |
| Orchard Close | OX29 8NU |
| Park Road | OX29 8NA OX29 8NG |
| Paulings Court | OX29 8PA |
| Peaks Lane | OX29 8PY |
| Pickett Piece | OX29 8FH |
| Pond Hill | OX29 8PZ OX29 8QH OX29 8QN OX29 8QW |
| Prospect Close | OX29 8QE |
| Pumbro | OX29 8QF |
| Ridings Close | OX29 8BF |
| Slate Crescent | OX29 8FG |
| Square Firs | OX29 8PB |
| Stonesfield Road | OX29 8PD OX29 8PE OX29 8PF OX29 8ER OX29 8ES OX29 8FB |
| Sunderland Close | OX29 8BZ |
| The Cross | OX29 8PT |
| The Green | OX29 8NT |
| The Manor Drive | OX29 8QX |
| The Ridings | OX29 8EA OX29 8EB |
| The Square | OX29 8QT |
| The Tewer | OX29 8DZ |
| Well Lane | OX29 8EX |
| West End | OX29 8NP OX29 8NL OX29 8NW |
| Westfield View | OX29 8FA |
| William Buckland Way | OX29 8FF |
| Witney Lane | OX29 8DN |
| Woodlands Rise | OX29 8PL |
| Woodstock Road | OX29 8EJ OX29 8QA |
| Wootton End | OX29 8EP |
| OX29 8DX OX29 8EG OX29 8ET OX29 8EW OX29 8GE OX29 8GG |
Transport near Stonesfield And Tackley
- FAQ
- Price Paid By Year
- Property Type Price
Frequently asked questions about Stonesfield And Tackley
What is the average price for a property for sale in Stonesfield And Tackley?
The average price for a property for sale in Stonesfield And Tackley is £516,042. This amount is 26% higher than the average price in Witney. There are 168 property listings for sale in Stonesfield And Tackley.
What streets have the most expensive properties for sale in Stonesfield And Tackley?
The streets with the most expensive properties for sale in Stonesfield And Tackley are Combe Road at an average of £792,142, Witney Lane at an average of £770,000 and Churchfields at an average of £657,916.
What streets have the most affordable properties for sale in Stonesfield And Tackley?
The streets with the most affordable properties for sale in Stonesfield And Tackley are Farley Lane at an average of £192,500, Longore at an average of £275,000 and The Square at an average of £288,000.
Which train stations are available in or near Stonesfield And Tackley?
Some of the train stations available in or near Stonesfield And Tackley are Combe, Finstock and Hanborough.
Property Price Paid in Stonesfield And Tackley by Year
The average sold property price by year was:
| Year | Average Sold Price | Price Change |
Sold Properties
|
|---|---|---|---|
| 2025 | £568,411 | 16% |
17 Properties |
| 2024 | £474,812 | -13% |
32 Properties |
| 2023 | £536,476 | 0,3% |
21 Properties |
| 2022 | £535,086 | 5% |
18 Properties |
| 2021 | £508,097 | -12% |
56 Properties |
| 2020 | £569,770 | 6% |
34 Properties |
| 2019 | £533,320 | -4% |
27 Properties |
| 2018 | £553,851 | 11% |
27 Properties |
| 2017 | £493,832 | 11% |
45 Properties |
| 2016 | £440,137 | 11% |
32 Properties |
| 2015 | £391,956 | -6% |
44 Properties |
| 2014 | £414,348 | 9% |
38 Properties |
| 2013 | £377,395 | 0,5% |
24 Properties |
| 2012 | £375,520 | -1% |
25 Properties |
| 2011 | £381,111 | -14% |
26 Properties |
| 2010 | £434,477 | 24% |
22 Properties |
| 2009 | £330,290 | 7% |
31 Properties |
| 2008 | £307,028 | -10% |
25 Properties |
| 2007 | £337,703 | -8% |
32 Properties |
| 2006 | £363,881 | 28% |
49 Properties |
| 2005 | £263,012 | -20% |
27 Properties |
| 2004 | £315,756 | 26% |
41 Properties |
| 2003 | £232,936 | 3% |
36 Properties |
| 2002 | £225,509 | 23% |
47 Properties |
| 2001 | £173,581 | -7% |
36 Properties |
| 2000 | £186,084 | 12% |
23 Properties |
| 1999 | £163,182 | 17% |
42 Properties |
| 1998 | £136,067 | 11% |
29 Properties |
| 1997 | £121,714 | 12% |
37 Properties |
| 1996 | £107,661 | 11% |
44 Properties |
| 1995 | £95,980 | - |
38 Properties |
Property Price per Property Type in Stonesfield And Tackley
Here you can find historic sold price data in order to help with your property search.
The average Property Paid Price for specific property types in the last three years are:
| Property Type | Average Sold Price | Sold Properties |
|---|---|---|
| Semi Detached House | £436,975.00 | 20 Semi Detached Houses |
| Detached House | £670,080.00 | 31 Detached Houses |
| Terraced House | £366,235.00 | 17 Terraced Houses |
| Flat | £192,500.00 | 2 Flats |

