
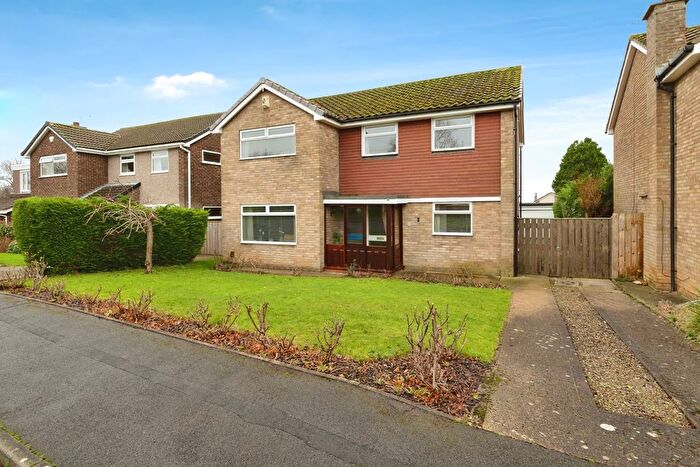
Houses for sale in Hutton, Middlesbrough
House Prices in Hutton
Properties in Hutton have an average house price of £771k and had 5 Property Transactions within the last 3 years¹.
Hutton is an area in Middlesbrough, Redcar and Cleveland with 41 households², where the most expensive property was sold for £1.35M.
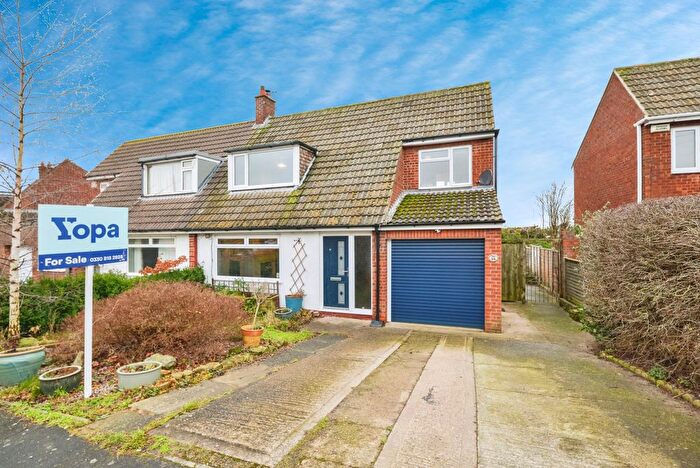
Properties for sale in Hutton
Previously listed properties in Hutton
![]()
If you are looking to sell your house, let it out, or receive a property valuation, an expert can help you.
Click the button below to get started.

Roads and Postcodes in Hutton
Navigate through our locations to find the location of your next house in Hutton, Middlesbrough for sale or to rent.
| Streets | Postcodes |
|---|---|
| Church Lane | TS9 6QU TS9 6RR |
| Newton Road | TS9 6QW |
| Roseberry View | TS9 6QT |
| TS7 0PE TS7 0PF TS9 6QP TS9 6QR TS9 6QS TS9 6QX |
Property price trends in Hutton
According to the latest Land Registry data, the average home in Hutton sold for £601,000 in 2024. That figure comes from 39 sales logged over the past 29 years.
Prices have continued to climb over the last three years. Compared with 2021, when the typical sale came in around £440,000, that's a rise of roughly 36.6%.
Looking back five years, average prices are up about 122.6% since 2019, a gain of around £331,000 in cash terms.
Zoom out to the past decade for the fuller picture. Back in 2012, homes here averaged £476,000, so the typical sold price has climbed about 26.3% since then, roughly 2% a year. Stretch the view to fifteen years and that annual pace edges up closer to 5.1%.
Frequently asked questions about Hutton
What is the average price for a property for sale in Hutton?
The average price for a property for sale in Hutton is £771,400. This amount is 446% higher than the average price in Middlesbrough. There are 110 property listings for sale in Hutton.
Which train stations are available in or near Hutton?
Some of the train stations available in or near Hutton are Great Ayton, Nunthorpe and Gypsy Lane.
Property Price Paid in Hutton by Year
The average sold property price by year was:
| Year | Average Sold Price | Price Change |
Sold Properties
|
|---|---|---|---|
| 2024 | £601,000 | -47% |
2 Properties |
| 2023 | £885,000 | 86% |
3 Properties |
| 2022 | £125,000 | -252% |
2 Properties |
| 2021 | £440,000 | -18% |
2 Properties |
| 2020 | £520,000 | 48% |
2 Properties |
| 2019 | £270,000 | -58% |
1 Property |
| 2017 | £426,666 | -51% |
3 Properties |
| 2016 | £644,250 | 26% |
4 Properties |
| 2012 | £476,000 | 10% |
1 Property |
| 2011 | £430,000 | -65% |
1 Property |
Property Price per Property Type in Hutton
Here you can find historic sold price data in order to help with your property search.
The average Property Paid Price for specific property types in the last three years are:
| Property Type | Average Sold Price | Sold Properties |
|---|---|---|
| Semi Detached House | £362,000.00 | 1 Semi Detached House |
| Detached House | £873,750.00 | 4 Detached Houses |
