
Houses for sale in Redcar and Cleveland, England
House Prices in Redcar and Cleveland
Properties in Redcar and Cleveland have
an average house price of
£164k
and had 6,387 Property Transactions
within the last 3 years.¹
Redcar and Cleveland is a location in
England with
61,714 households², where the most expensive property was sold for £1.35M.
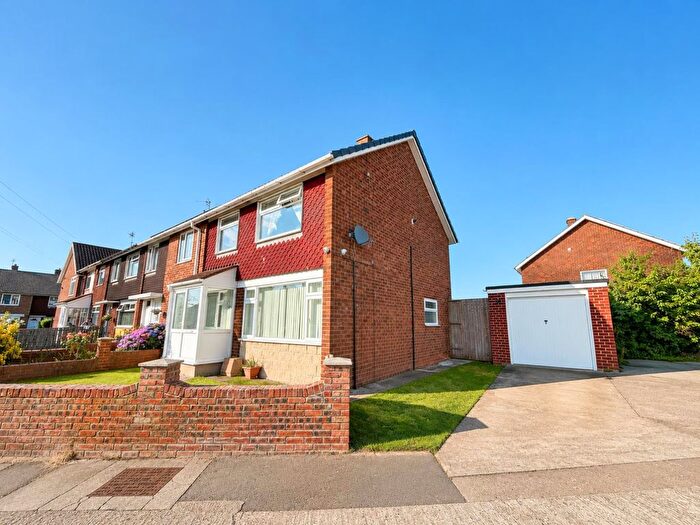
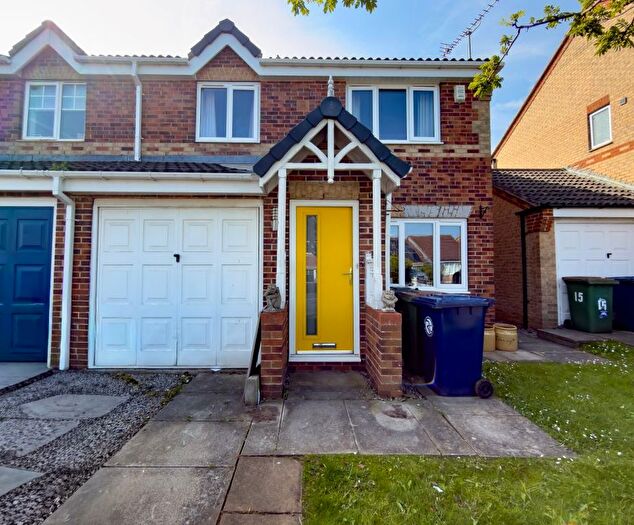
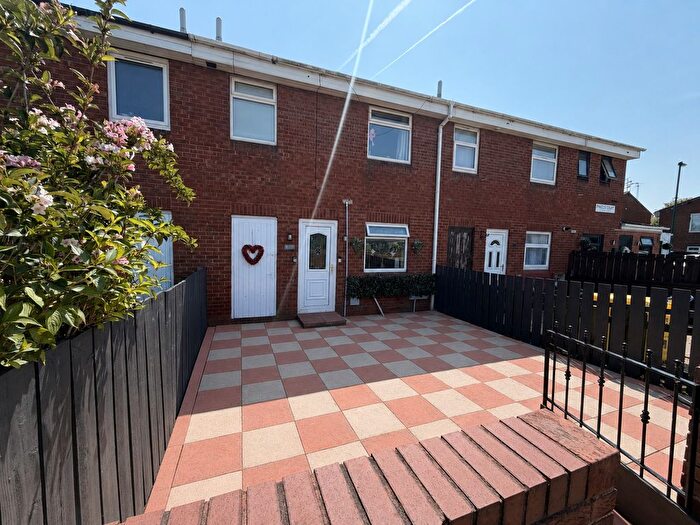
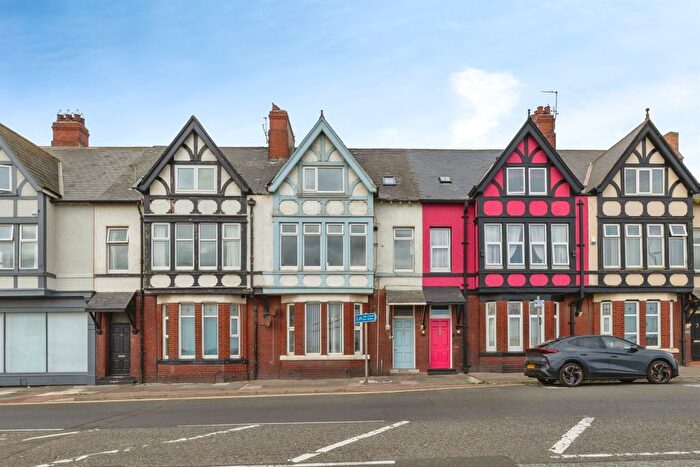
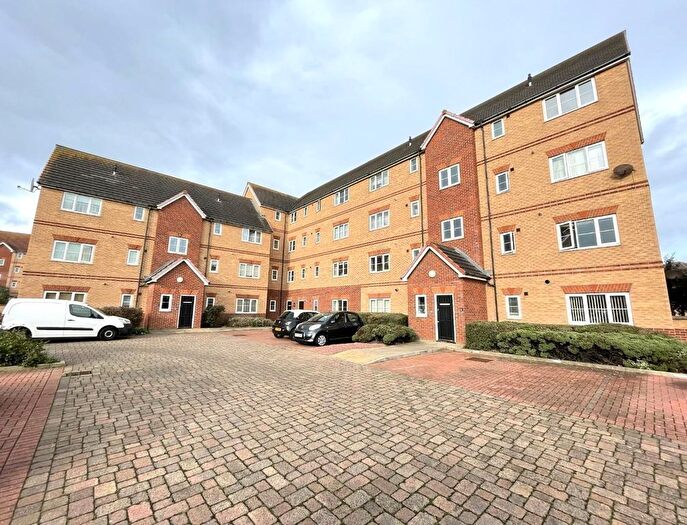
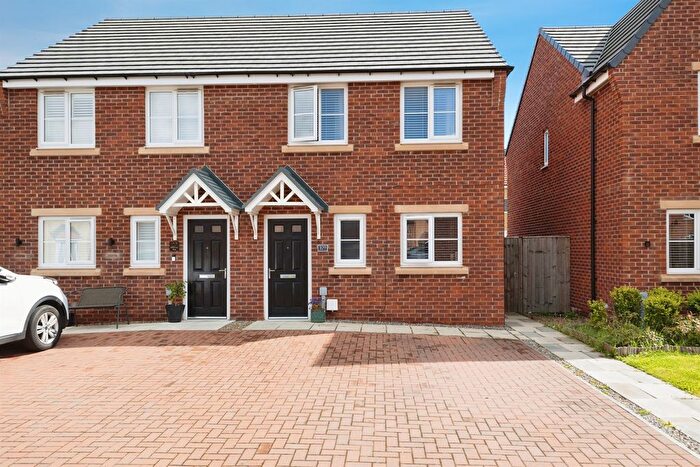
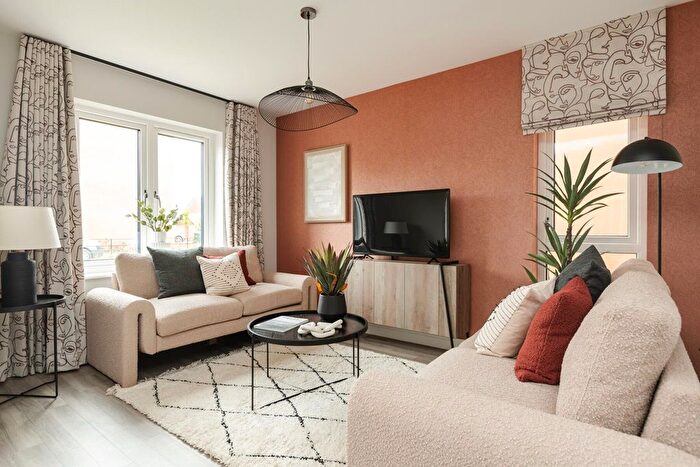
Properties for sale in Redcar and Cleveland
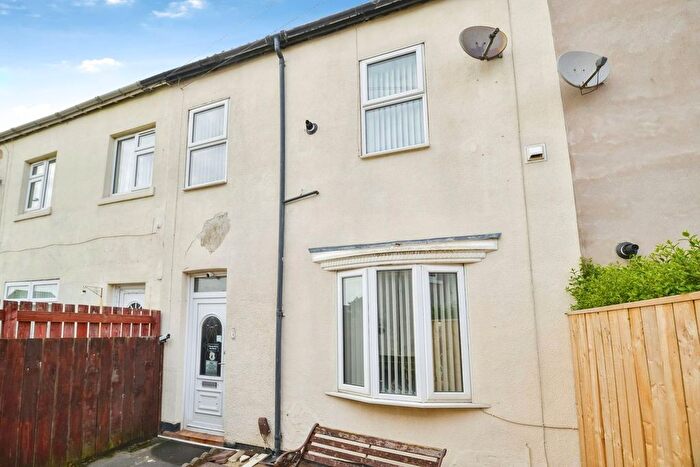
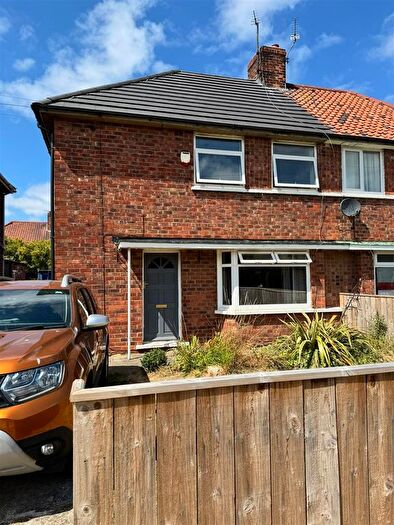
![]()
If you are looking to sell your house, let it out, or receive a property valuation, an expert can help you.
Click the button below to get started.
Towns in Redcar and Cleveland
Navigate through our locations to find the location of your next house in Redcar and Cleveland, England for sale or to rent.
Property price trends in Redcar and Cleveland
According to the latest Land Registry data, the average home in Redcar and Cleveland sold for £174,322 in 2026. That figure comes from a substantial record of 67,540 sales logged over the past 31 years.
Prices have continued to climb over the last three years. Compared with 2023, when the typical sale came in around £159,146, that's a rise of roughly 9.5%.
Looking back five years, average prices are up about 16.1% since 2021, a gain of around £24,137 in cash terms.
Zoom out to the past decade for the fuller picture. Back in 2016, homes here averaged £136,573, so the typical sold price has climbed about 27.6% since then, roughly 2.5% a year. Stretch the view to fifteen years and that annual pace holds at about 2.3%.
Frequently asked questions about Redcar and Cleveland
What is the average price for a property for sale in Redcar and Cleveland?
The average price for a property for sale in Redcar and Cleveland is £164,497. This amount is 54% lower than the average price in England. There are 8,366 property listings for sale in Redcar and Cleveland.
What locations have the most expensive properties for sale in Redcar and Cleveland?
The locations with the most expensive properties for sale in Redcar and Cleveland are Guisborough at an average of £203,243 and Saltburn-by-the-sea at an average of £166,083.
What locations have the most affordable properties for sale in Redcar and Cleveland?
The locations with the most affordable properties for sale in Redcar and Cleveland are Middlesbrough at an average of £141,334 and Redcar at an average of £164,827.
Which train stations are available in or near Redcar and Cleveland?
Some of the train stations available in or near Redcar and Cleveland are Longbeck, Marske and Redcar East.
Property Price Paid in Redcar and Cleveland by Year
The average sold property price by year was:
| Year | Average Sold Price | Price Change |
Sold Properties
|
|---|---|---|---|
| 2026 | £174,322 | 4% |
347 Properties |
| 2025 | £166,817 | 1% |
2,039 Properties |
| 2024 | £165,799 | 4% |
1,994 Properties |
| 2023 | £159,146 | 0,1% |
2,007 Properties |
| 2022 | £159,050 | 6% |
2,329 Properties |
| 2021 | £150,185 | 6% |
2,801 Properties |
| 2020 | £140,852 | 1% |
1,991 Properties |
| 2019 | £139,288 | 0,1% |
2,396 Properties |
| 2018 | £139,150 | 2% |
2,331 Properties |
| 2017 | £135,792 | -1% |
2,251 Properties |
Property Price per Property Type in Redcar and Cleveland
Here you can find historic sold price data in order to help with your property search.
The average Property Paid Price for specific property types in the last three years are:
| Property Type | Average Sold Price | Sold Properties |
|---|---|---|
| Semi Detached House | £161,198.00 | 2,827 Semi Detached Houses |
| Terraced House | £109,790.00 | 2,150 Terraced Houses |
| Detached House | £289,263.00 | 1,130 Detached Houses |
| Flat | £114,347.00 | 280 Flats |
Transport in Redcar and Cleveland
Please see below transportation links in this area:
