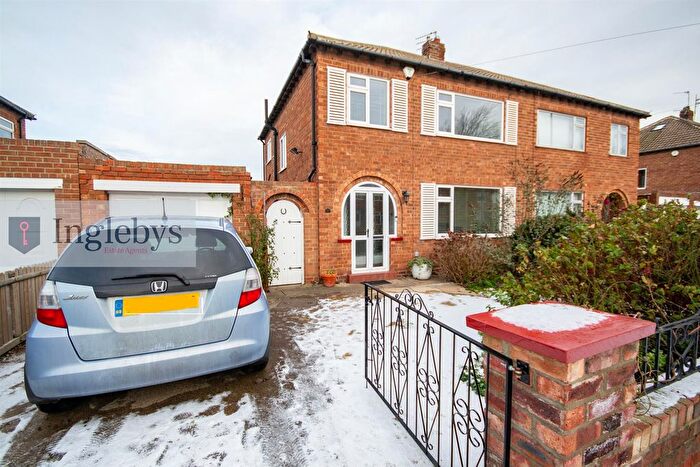
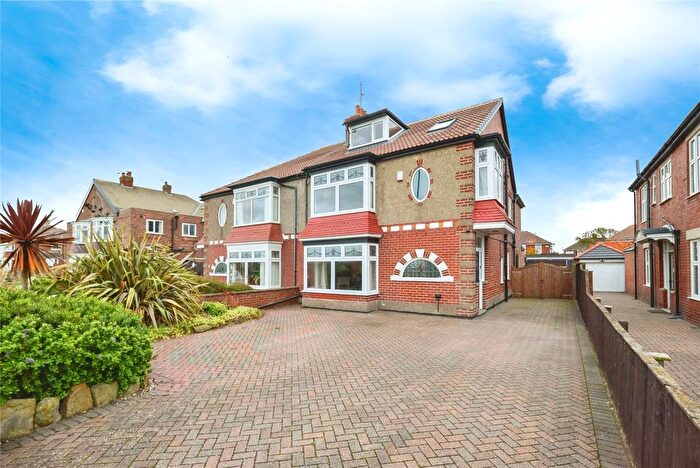
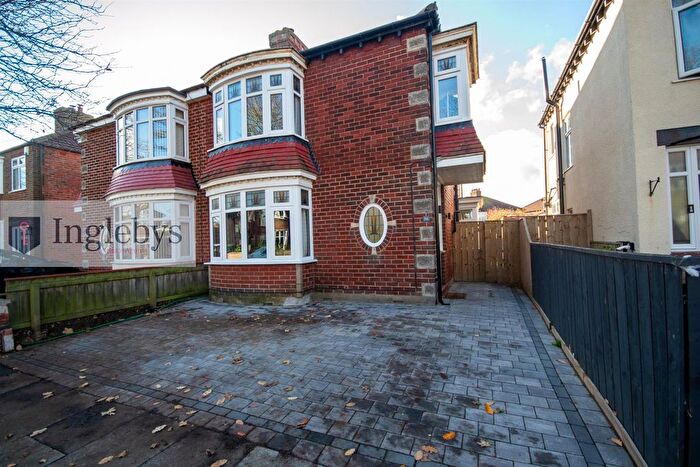
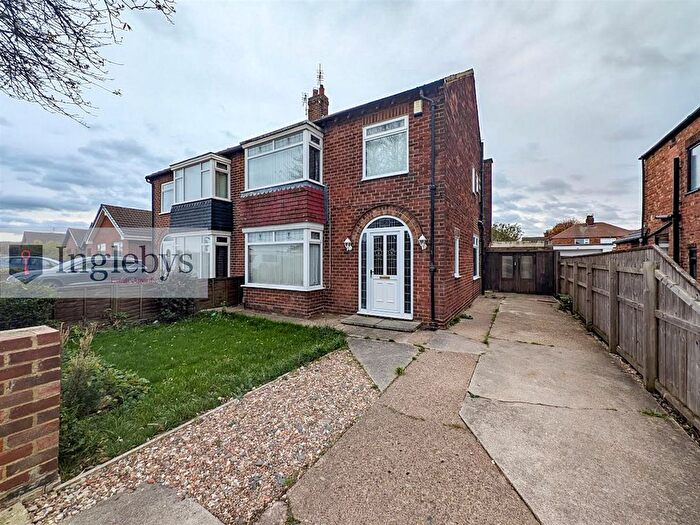
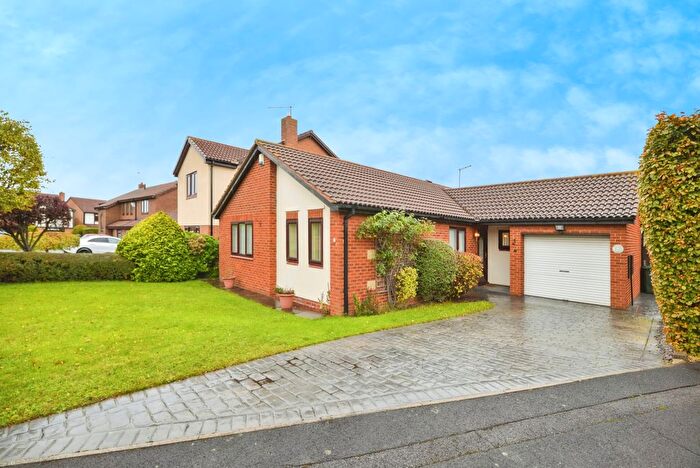
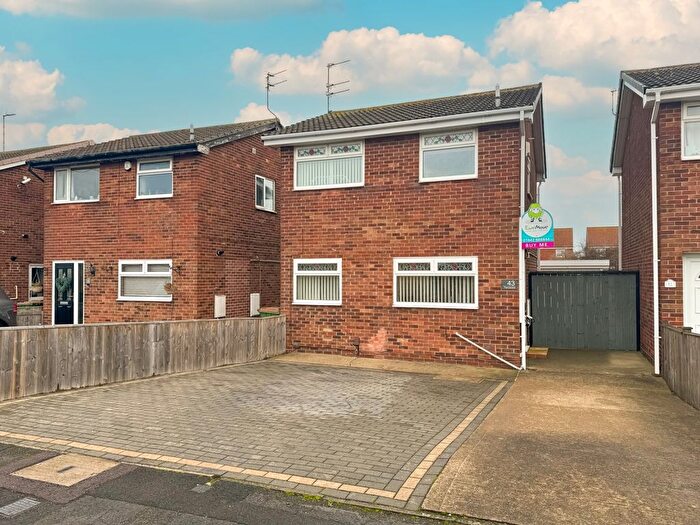
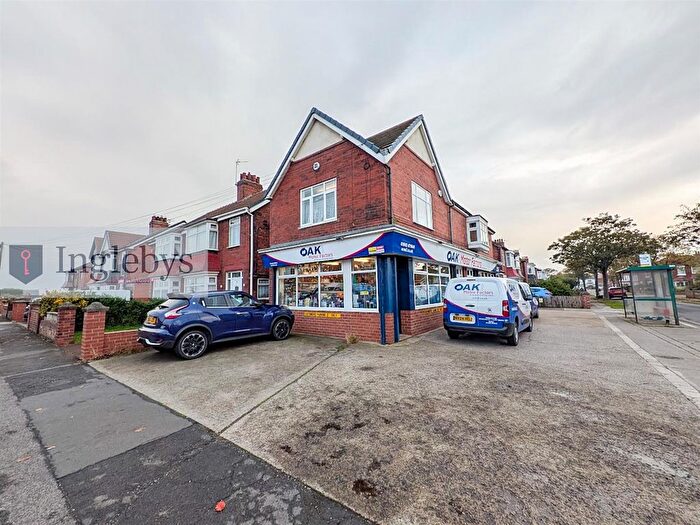
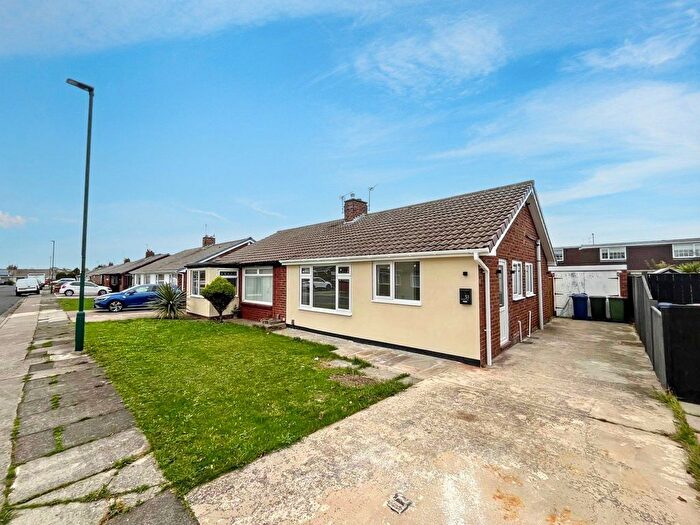
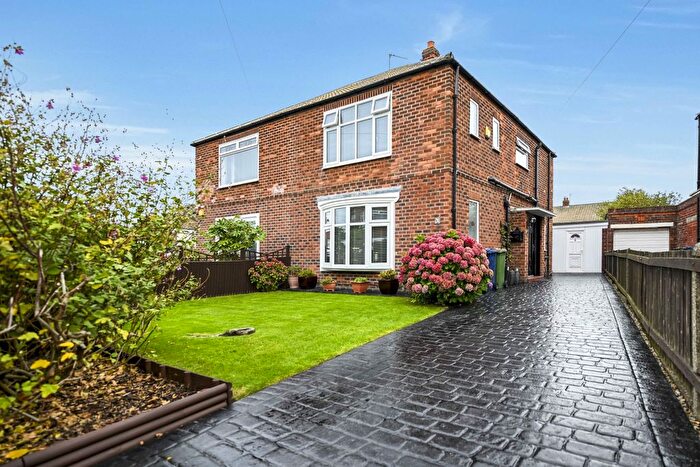
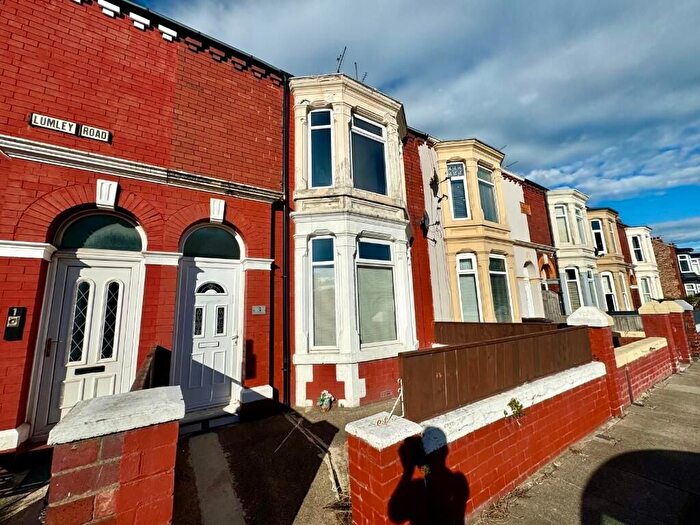
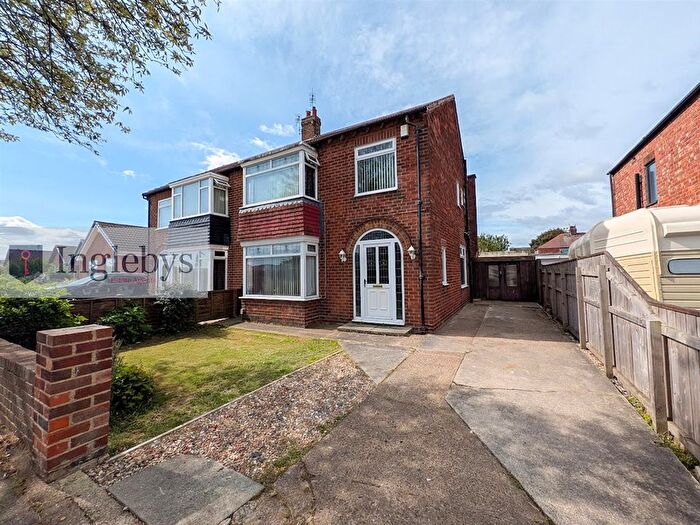
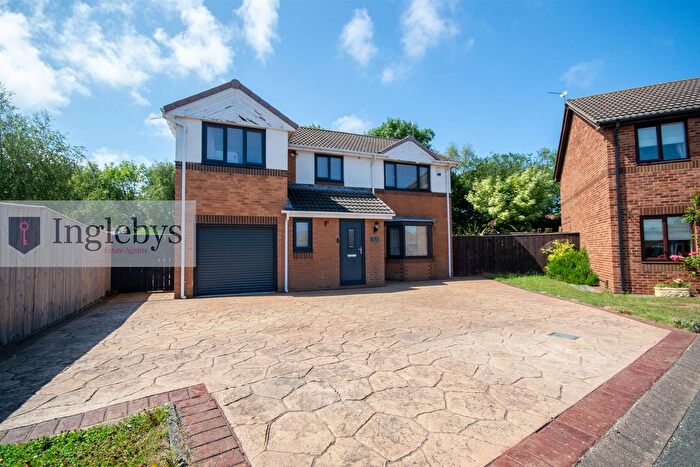
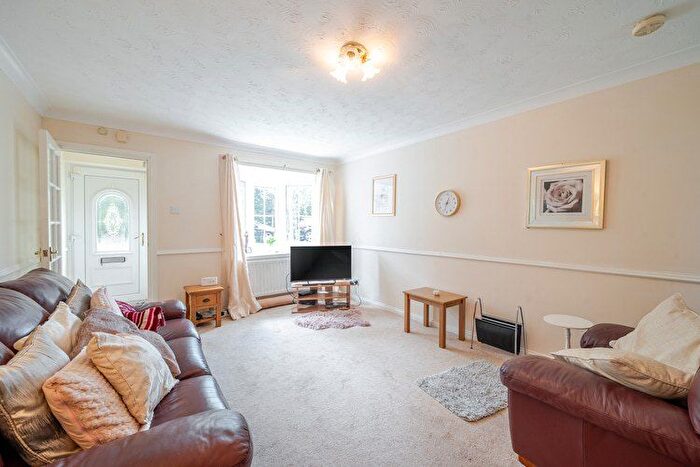
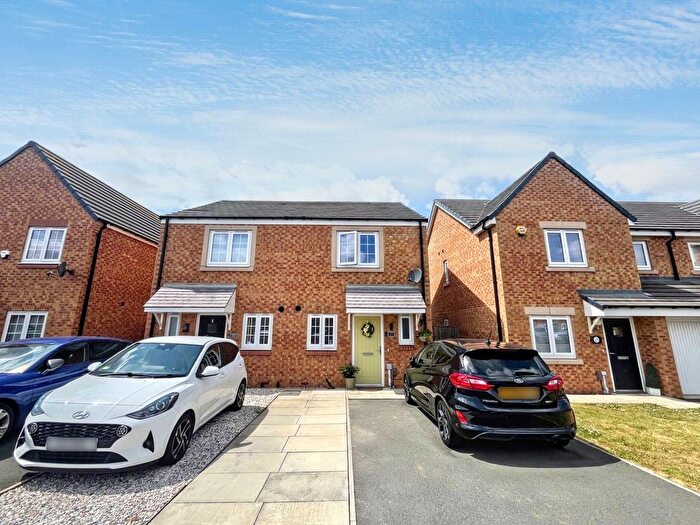
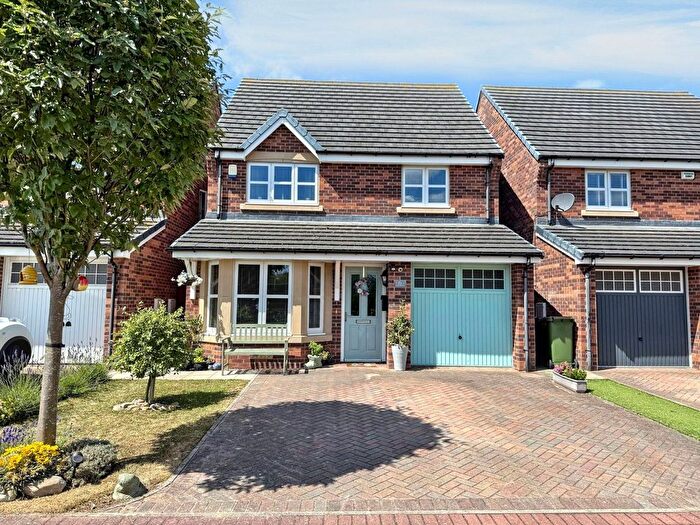
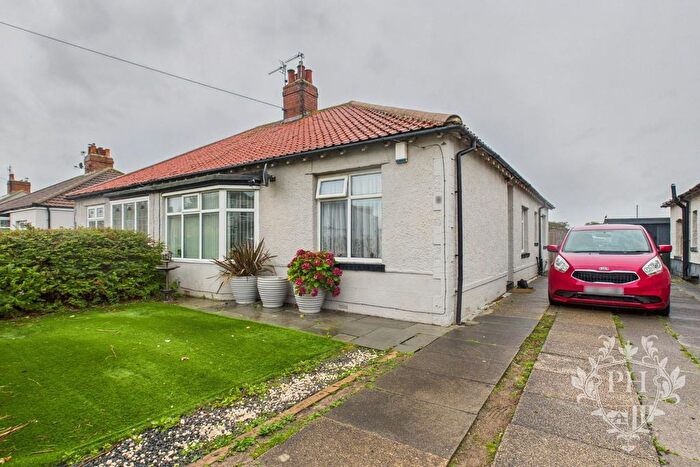
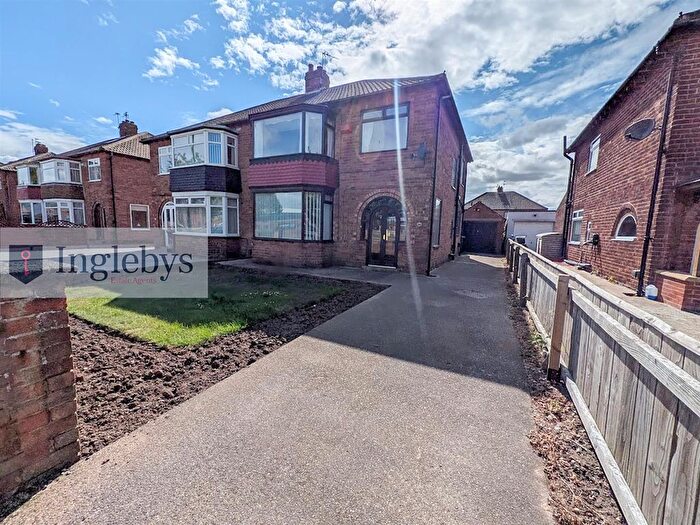
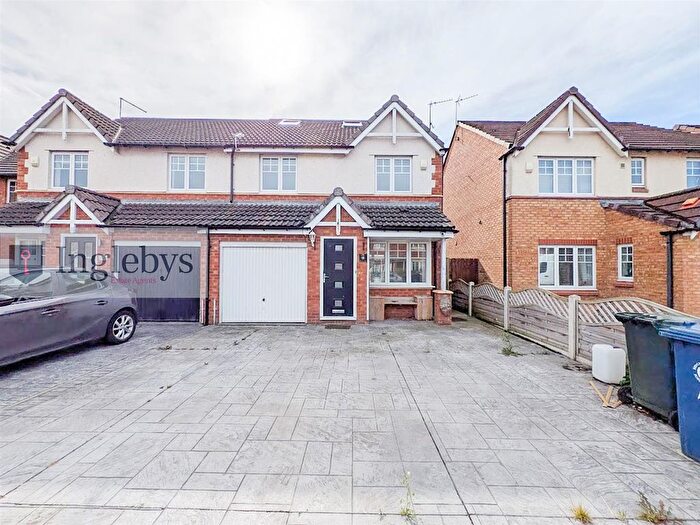
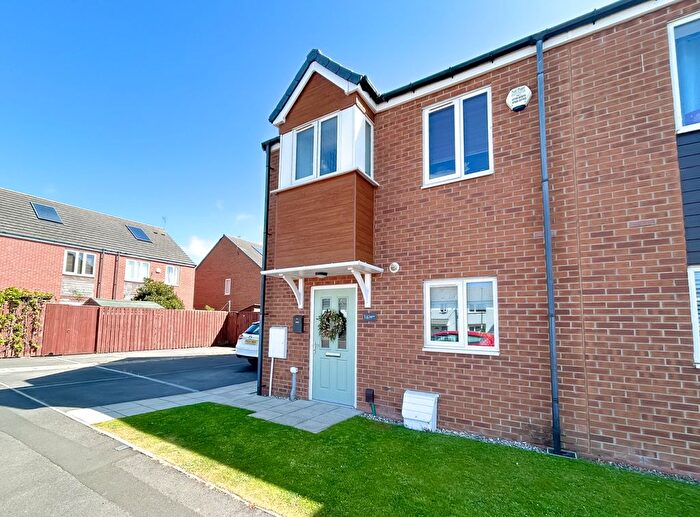
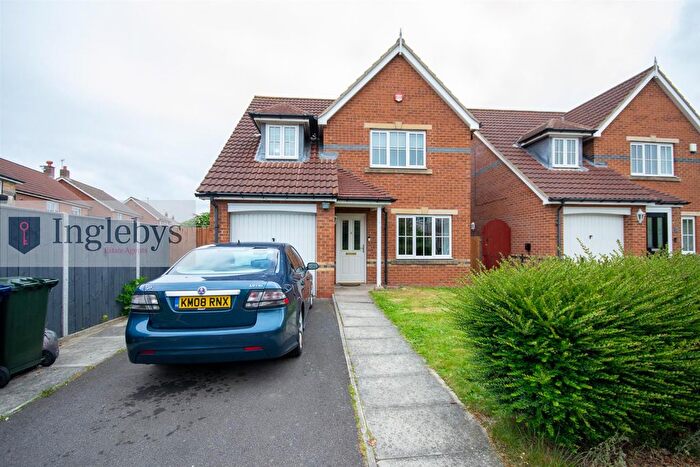
Houses for sale & to rent in West Dyke, Redcar
House Prices in West Dyke
Properties in West Dyke have an average house price of £201,896.00 and had 441 Property Transactions within the last 3 years¹.
West Dyke is an area in Redcar, Redcar and Cleveland with 3,105 households², where the most expensive property was sold for £450,000.00.
Properties for sale in West Dyke
Previously listed properties in West Dyke
Roads and Postcodes in West Dyke
Navigate through our locations to find the location of your next house in West Dyke, Redcar for sale or to rent.
| Streets | Postcodes |
|---|---|
| Aintree Road | TS10 2HX |
| Alderman Close | TS10 2GX |
| Alnmouth Drive | TS10 2TD |
| Alnwick Close | TS10 2NN |
| Armadale | TS10 2SE |
| Ascot Road | TS10 2HS TS10 2HU |
| Bamburgh Close | TS10 2HD |
| Barnard Grove | TS10 2JX |
| Beadnell Way | TS10 2QU |
| Berwick Walk | TS10 2LD |
| Bodiam Drive | TS10 2LU |
| Bolton Close | TS10 2NB |
| Borough Road | TS10 2EF TS10 2EG TS10 2EQ |
| Brackenberry Crescent | TS10 2PP |
| Caister Court | TS10 2SW |
| Carisbrooke Way | TS10 2LJ |
| Castle Road | TS10 2LF TS10 2LG TS10 2LT TS10 2LY TS10 2LZ TS10 2ND TS10 2NE TS10 2NF TS10 2NJ TS10 2NL TS10 2NQ |
| Colwyn Close | TS10 2NR |
| Conway Road | TS10 2EN TS10 2EW |
| Coquet Close | TS10 2QJ |
| Coral Way | TS10 2JP |
| Cormorant Drive | TS10 2QD |
| Dartmouth Grove | TS10 2NU TS10 2NX |
| Deal Road | TS10 2RG |
| Dover Close | TS10 2QZ |
| Druridge Grove | TS10 2QH |
| Dudley Walk | TS10 2LN |
| Dulas Close | TS10 2SJ |
| East Scar | TS10 2PL |
| Epsom Road | TS10 2JF TS10 2JG |
| Filey Close | TS10 2QQ |
| Foundation Close | TS10 2GY |
| Gilling Way | TS10 2LR TS10 2LW |
| Goodwood Road | TS10 2JE TS10 2JH |
| Green Scar | TS10 2SD |
| Greenlands Road | TS10 2DG TS10 2DH |
| Hadston Close | TS10 2TE |
| Harewood Way | TS10 2LP |
| Harwich Close | TS10 2QW |
| Hauxley Close | TS10 2QT |
| Hayburn Close | TS10 2PZ |
| Hayling Grove | TS10 2NW |
| Helmsley Lawn | TS10 2LL |
| Herne Close | TS10 2TF |
| Heysham Grove | TS10 2QR |
| High Stone Close | TS10 2PR |
| Holyhead Drive | TS10 2QS |
| Homerell Close | TS10 2PY |
| Hundale Crescent | TS10 2NS TS10 2NT TS10 2PU |
| Hurst Park | TS10 2JQ |
| Hythe Close | TS10 2QP |
| Ings Road | TS10 2DD TS10 2DE TS10 2DF TS10 2DL |
| Kenilworth Way | TS10 2LS |
| Kentra Close | TS10 2SL |
| Kilton Close | TS10 2NH |
| Kinmel Close | TS10 2RY |
| Lavan Court | TS10 2RX |
| Lavernock Close | TS10 2PX |
| Ludlow Crescent | TS10 2LH TS10 2LQ |
| Luff Way | TS10 2PJ |
| Lulworth Close | TS10 2SN |
| Malcolm Grove | TS10 2DJ |
| Middleham Way | TS10 2NG |
| Newlyn Way | TS10 2RN |
| Newmarket Road | TS10 2HY TS10 2HZ TS10 2JA TS10 2JB TS10 2JD |
| Pembroke Way | TS10 2JY |
| Porthleven Way | TS10 2RW |
| Pragnell Court | TS10 2UE |
| Principal Road | TS10 2GW |
| Queensland Avenue | TS10 2DT |
| Raby Road | TS10 2HE TS10 2HF |
| Redcar Lane | TS10 2DA TS10 2DN TS10 2DR TS10 2DU TS10 2DW TS10 2DZ TS10 2EJ TS10 2HN TS10 2JJ TS10 2JL TS10 2JN TS10 2JW |
| Richmond Road | TS10 2EX TS10 2EY |
| Romney Close | TS10 2JT |
| Rothesay Drive | TS10 2LX |
| Salcombe Way | TS10 2RB |
| Saltscar | TS10 2PH |
| Sandown Park | TS10 2HT |
| Sandpiper Close | TS10 2QE |
| Saunton Avenue | TS10 2RL |
| Scalby Grove | TS10 2PT |
| Seaford Close | TS10 2NP |
| Seaham Close | TS10 2RS |
| Seaton Close | TS10 2QL |
| Shaldon Close | TS10 2RJ |
| Sheerness Way | TS10 2RQ |
| Sheringham Court | TS10 2RR |
| Shipham Close | TS10 2RT |
| Shoreham Close | TS10 2RD |
| Skelton Drive | TS10 2LB |
| Skomer Court | TS10 2SB |
| St Ives Close | TS10 2RP |
| St Johns Grove | TS10 2DS |
| St Margarets Grove | TS10 2HW |
| St Peters Grove | TS10 2DP |
| St Thomas Grove | TS10 2DY |
| Stable Mews | TS10 2HL |
| Stirling Road | TS10 2JU TS10 2JZ |
| Stoupe Grove | TS10 2QN |
| Studland Road | TS10 2RE |
| Swanage Drive | TS10 2RH |
| Talisker Gardens | TS10 2TG |
| Tern Grove | TS10 2QF |
| The Chase | TS10 2EE |
| The Furlongs | TS10 2EB |
| The Hampstead | TS10 2PN |
| The Leas | TS10 2JR |
| The Strand | TS10 2QG |
| Thrush Road | TS10 2BY |
| Thwaites Lane | TS10 2FD |
| Torcross Way | TS10 2RU TS10 2SH TS10 2SQ |
| Trevarrian Drive | TS10 2RZ |
| Trevose Close | TS10 2TQ |
| Victoria Avenue | TS10 2DX |
| Walworth Close | TS10 2NA |
| Wardman Crescent | TS10 2DQ |
| Warwick Road | TS10 2EL TS10 2ER TS10 2EU TS10 2HA TS10 2HB TS10 2LA TS10 2LE |
| Wembury Close | TS10 2SA |
| West Scar | TS10 2PQ |
| White Stone Close | TS10 2PS |
| William Turner Road | TS10 2GZ |
| Wilmore Road | TS10 2FB |
| Wincanton Road | TS10 2HP TS10 2HR |
| Windsor Road | TS10 2ES TS10 2ET |
Transport near West Dyke
-
Redcar East Station
-
Redcar Central Station
-
Longbeck Station
-
Marske Station
-
British Steel Redcar Station
- FAQ
- Price Paid By Year
- Property Type Price
Frequently asked questions about West Dyke
What is the average price for a property for sale in West Dyke?
The average price for a property for sale in West Dyke is £201,896. This amount is 25% higher than the average price in Redcar. There are 214 property listings for sale in West Dyke.
What streets have the most expensive properties for sale in West Dyke?
The streets with the most expensive properties for sale in West Dyke are Heysham Grove at an average of £360,000, Seaton Close at an average of £350,000 and Beadnell Way at an average of £342,500.
What streets have the most affordable properties for sale in West Dyke?
The streets with the most affordable properties for sale in West Dyke are Seaham Close at an average of £78,750, The Chase at an average of £103,666 and Rothesay Drive at an average of £110,000.
Which train stations are available in or near West Dyke?
Some of the train stations available in or near West Dyke are Redcar East, Redcar Central and Longbeck.
Property Price Paid in West Dyke by Year
The average sold property price by year was:
| Year | Average Sold Price | Price Change |
Sold Properties
|
|---|---|---|---|
| 2025 | £221,204 | 10% |
70 Properties |
| 2024 | £199,404 | 4% |
120 Properties |
| 2023 | £192,191 | -6% |
129 Properties |
| 2022 | £203,532 | 12% |
122 Properties |
| 2021 | £179,398 | 9% |
184 Properties |
| 2020 | £162,676 | 7% |
119 Properties |
| 2019 | £151,548 | -4% |
135 Properties |
| 2018 | £157,371 | 1% |
132 Properties |
| 2017 | £156,581 | 1% |
115 Properties |
| 2016 | £154,682 | -7% |
124 Properties |
| 2015 | £165,627 | 7% |
155 Properties |
| 2014 | £153,657 | -1% |
132 Properties |
| 2013 | £155,286 | 9% |
135 Properties |
| 2012 | £140,898 | -2% |
97 Properties |
| 2011 | £144,380 | -2% |
83 Properties |
| 2010 | £147,934 | 7% |
102 Properties |
| 2009 | £137,360 | -12% |
78 Properties |
| 2008 | £153,949 | -2% |
92 Properties |
| 2007 | £157,283 | 3% |
154 Properties |
| 2006 | £153,197 | 6% |
239 Properties |
| 2005 | £143,619 | 9% |
142 Properties |
| 2004 | £131,354 | 19% |
146 Properties |
| 2003 | £106,671 | 18% |
256 Properties |
| 2002 | £86,982 | 16% |
301 Properties |
| 2001 | £72,873 | -3% |
282 Properties |
| 2000 | £74,713 | 7% |
229 Properties |
| 1999 | £69,266 | -2% |
237 Properties |
| 1998 | £70,556 | 8% |
194 Properties |
| 1997 | £64,899 | 7% |
205 Properties |
| 1996 | £60,501 | 5% |
178 Properties |
| 1995 | £57,539 | - |
145 Properties |
Property Price per Property Type in West Dyke
Here you can find historic sold price data in order to help with your property search.
The average Property Paid Price for specific property types in the last three years are:
| Property Type | Average Sold Price | Sold Properties |
|---|---|---|
| Flat | £87,000.00 | 8 Flats |
| Semi Detached House | £178,357.00 | 275 Semi Detached Houses |
| Detached House | £266,363.00 | 136 Detached Houses |
| Terraced House | £139,397.00 | 22 Terraced Houses |

