
Houses for sale & to rent in Richmond upon Thames London Borough, England
House Prices in Richmond upon Thames London Borough
Properties in Richmond upon Thames London Borough have
an average house price of
£909k
and had 7,975 Property Transactions
within the last 3 years.¹
Richmond upon Thames London Borough is a location in
England with
79,832 households², where the most expensive property was sold for £10M.
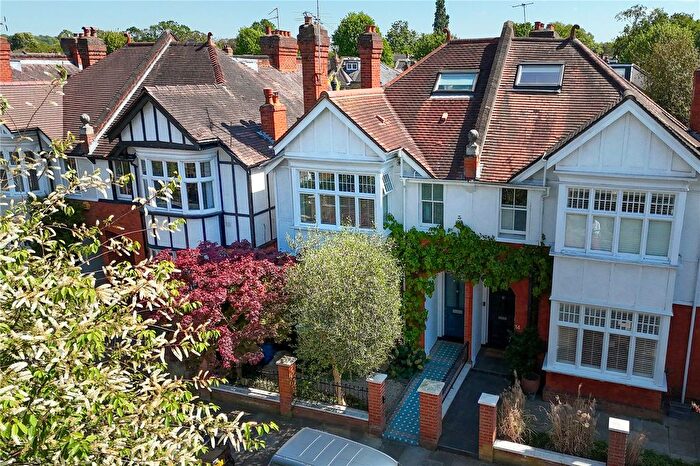
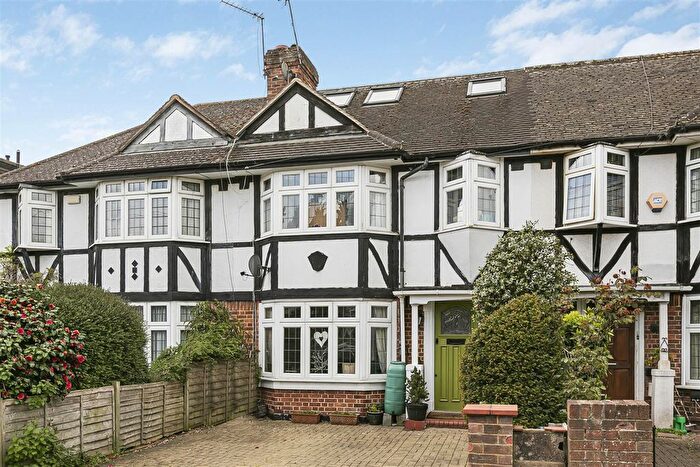
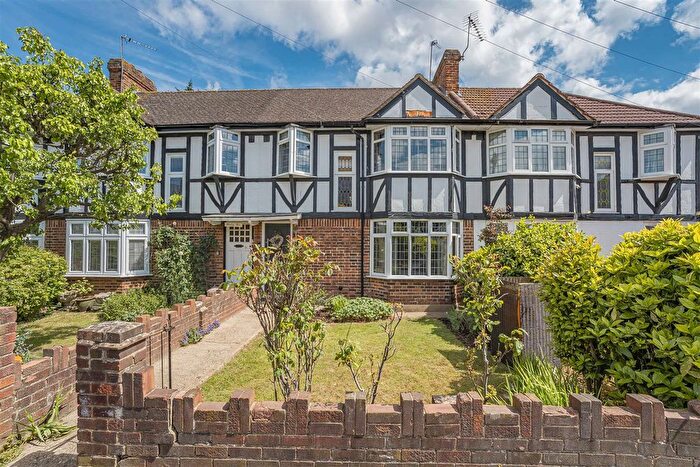
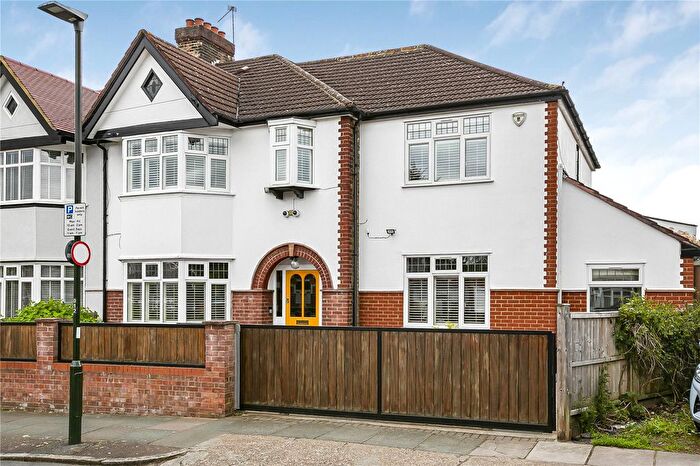
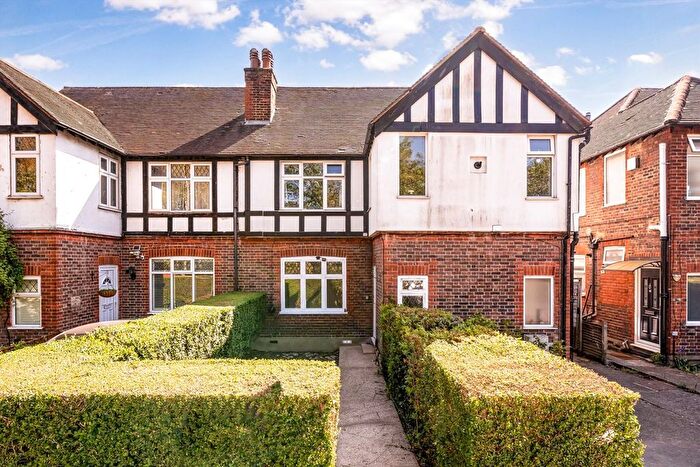
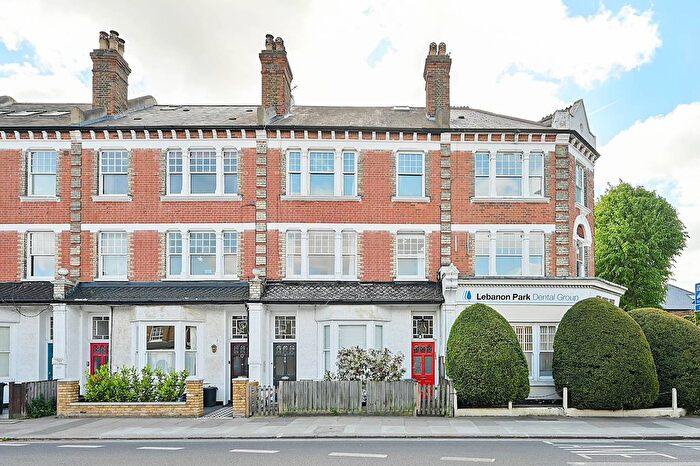
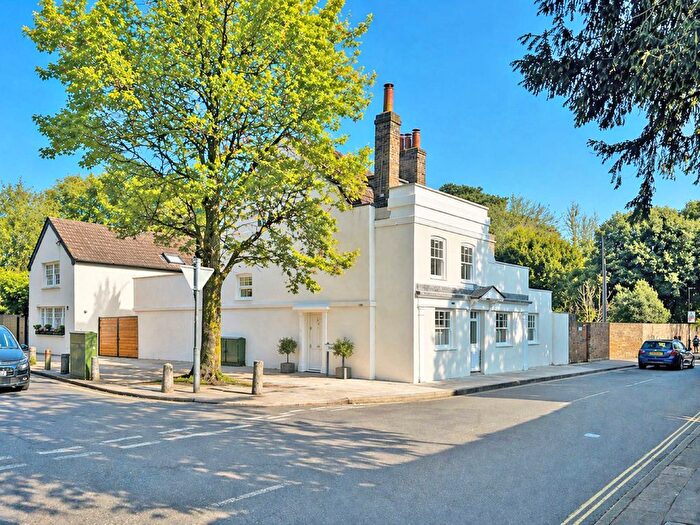
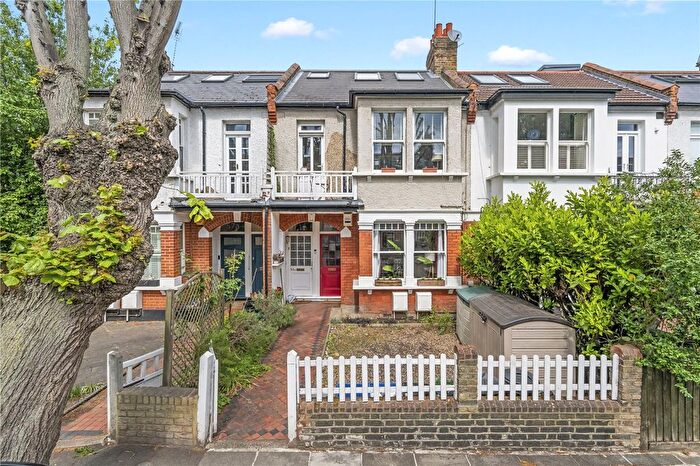
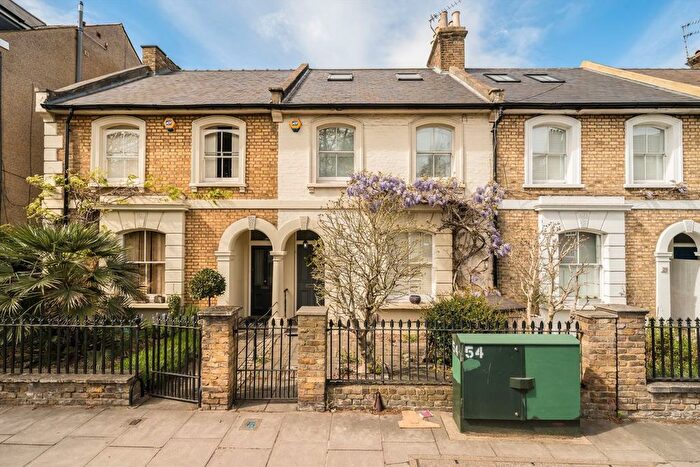
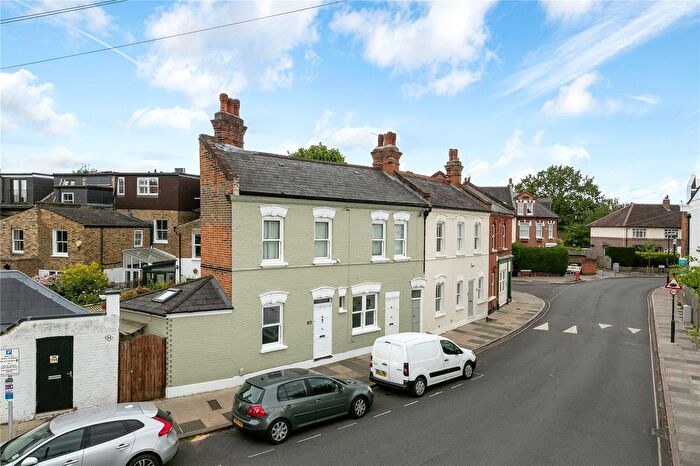
Properties for sale in Richmond upon Thames London Borough
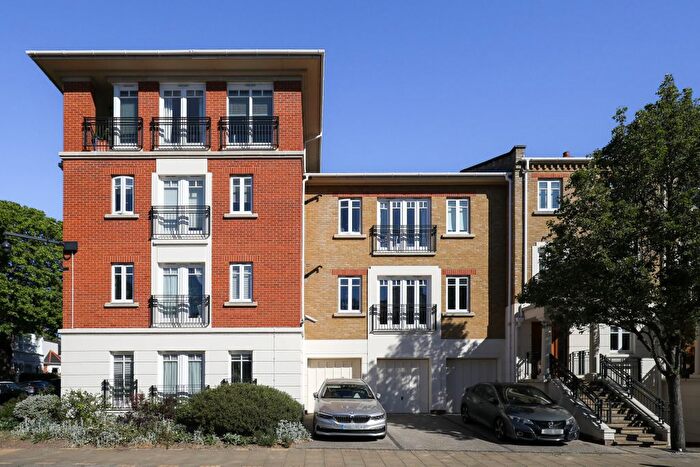
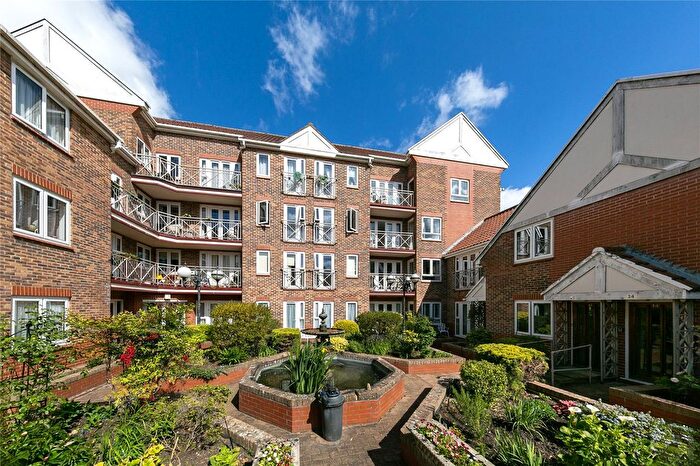
![]()
If you are looking to sell your house, let it out, or receive a property valuation, an expert can help you.
Click the button below to get started.
Towns in Richmond upon Thames London Borough
Navigate through our locations to find the location of your next house in Richmond upon Thames, England for sale or to rent.
Transport in Richmond upon Thames London Borough
Please see below transportation links in this area:
-
 St Margarets Station
 -
Twickenham Station
-
Strawberry Hill Station
-

 Richmond Station
 -
North Sheen Station
-
Fulwell Station
-
Whitton Station
-
Teddington Station
-
Isleworth Station
-
Hounslow Station
- FAQ
- Price Paid By Year
- Property Type Price
Frequently asked questions about Richmond upon Thames London Borough
What is the average price for a property for sale in Richmond upon Thames London Borough?
The average price for a property for sale in Richmond upon Thames London Borough is £909,442. This amount is 153% higher than the average price in England. There are more than 10,000 property listings for sale in Richmond upon Thames London Borough.
What locations have the most expensive properties for sale in Richmond upon Thames London Borough?
The locations with the most expensive properties for sale in Richmond upon Thames London Borough are London at an average of £1,254,523, Richmond at an average of £1,021,625 and Teddington at an average of £837,584.
What locations have the most affordable properties for sale in Richmond upon Thames London Borough?
The locations with the most affordable properties for sale in Richmond upon Thames London Borough are Feltham at an average of £436,804, Hounslow at an average of £458,489 and Kingston Upon Thames at an average of £589,394.
Which train stations are available in or near Richmond upon Thames London Borough?
Some of the train stations available in or near Richmond upon Thames London Borough are St Margarets, Twickenham and Strawberry Hill.
Which tube stations are available in or near Richmond upon Thames London Borough?
The tube station available in or near Richmond upon Thames London Borough is Richmond.
Property Price Paid in Richmond upon Thames London Borough by Year
The average sold property price by year was:
| Year | Average Sold Price | Price Change |
Sold Properties
|
|---|---|---|---|
| 2026 | £901,298 | 1% |
145 Properties |
| 2025 | £896,728 | -1% |
2,469 Properties |
| 2024 | £907,744 | -2% |
2,793 Properties |
| 2023 | £923,971 | -3% |
2,568 Properties |
| 2022 | £949,008 | 5% |
3,165 Properties |
| 2021 | £903,035 | 4% |
3,922 Properties |
| 2020 | £869,755 | 6% |
2,599 Properties |
| 2019 | £817,243 | 3% |
2,671 Properties |
| 2018 | £793,495 | -1% |
2,739 Properties |
| 2017 | £804,282 | 4% |
2,907 Properties |
| 2016 | £774,190 | 3% |
3,065 Properties |
| 2015 | £751,110 | 3% |
3,409 Properties |
| 2014 | £725,556 | 11% |
3,557 Properties |
| 2013 | £642,788 | 8% |
3,650 Properties |
| 2012 | £590,539 | 3% |
3,291 Properties |
| 2011 | £570,066 | 3% |
3,149 Properties |
| 2010 | £550,835 | 8% |
3,220 Properties |
| 2009 | £508,535 | -0,1% |
2,593 Properties |
| 2008 | £508,811 | -0,4% |
2,412 Properties |
| 2007 | £511,042 | 15% |
4,692 Properties |
| 2006 | £434,485 | 10% |
5,409 Properties |
| 2005 | £393,125 | 2% |
4,319 Properties |
| 2004 | £385,443 | 10% |
4,865 Properties |
| 2003 | £347,293 | 7% |
4,539 Properties |
| 2002 | £323,931 | 7% |
5,297 Properties |
| 2001 | £301,313 | 6% |
4,752 Properties |
| 2000 | £284,575 | 16% |
4,067 Properties |
| 1999 | £237,904 | 15% |
5,978 Properties |
| 1998 | £201,685 | 14% |
4,913 Properties |
| 1997 | £173,201 | 13% |
5,401 Properties |
| 1996 | £150,333 | 8% |
4,958 Properties |
| 1995 | £138,263 | - |
3,454 Properties |
Property Price per Property Type in Richmond upon Thames London Borough
Here you can find historic sold price data in order to help with your property search.
The average Property Paid Price for specific property types in the last three years are:
| Property Type | Average Sold Price | Sold Properties |
|---|---|---|
| Semi Detached House | £1,261,302.00 | 1,489 Semi Detached Houses |
| Terraced House | £977,492.00 | 2,621 Terraced Houses |
| Detached House | £2,006,386.00 | 502 Detached Houses |
| Flat | £536,874.00 | 3,363 Flats |