
Houses for sale & to rent in Rotherham, Rotherham
House Prices in Rotherham
Properties in Rotherham have an average house price of £182k and had 6,934 Property Transactions within the last 3 years.¹
Rotherham is an area in Rotherham with 79,325 households², where the most expensive property was sold for £1.8M.
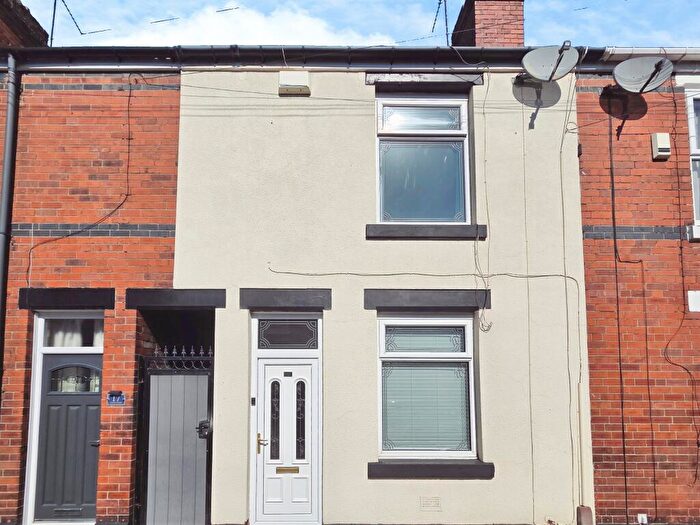
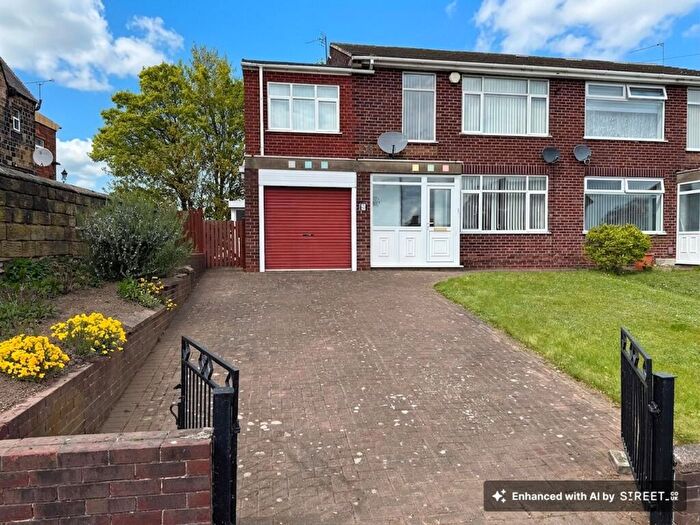
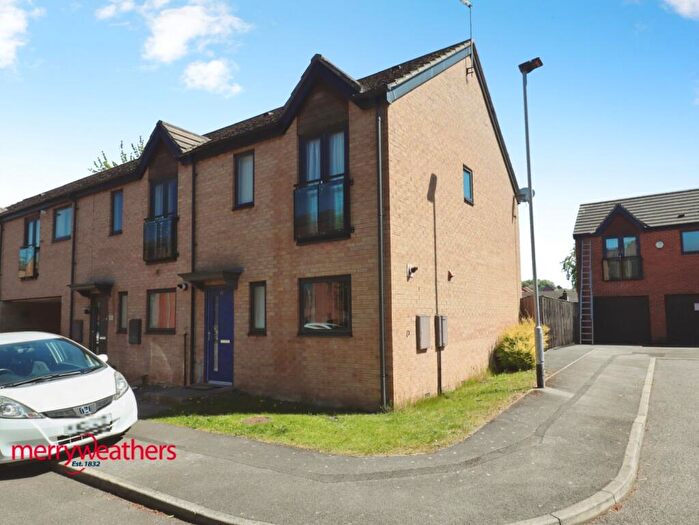
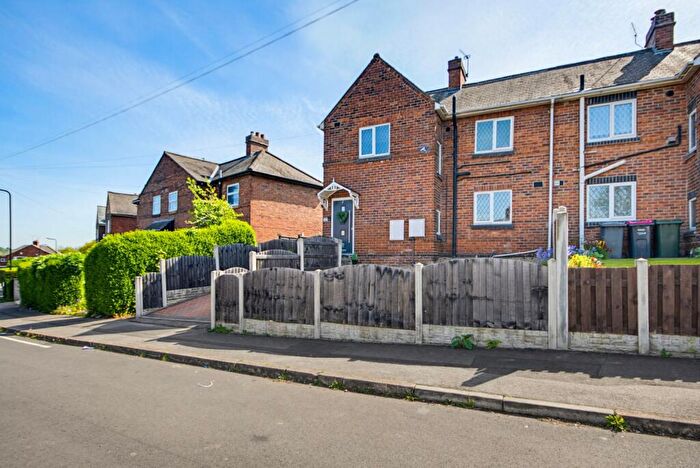
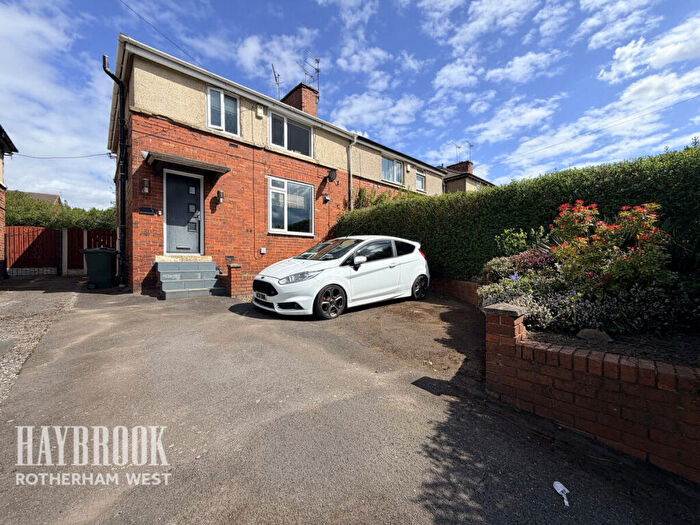
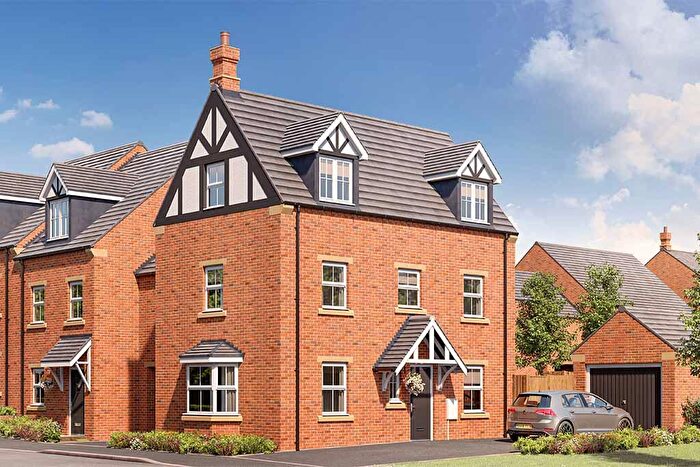
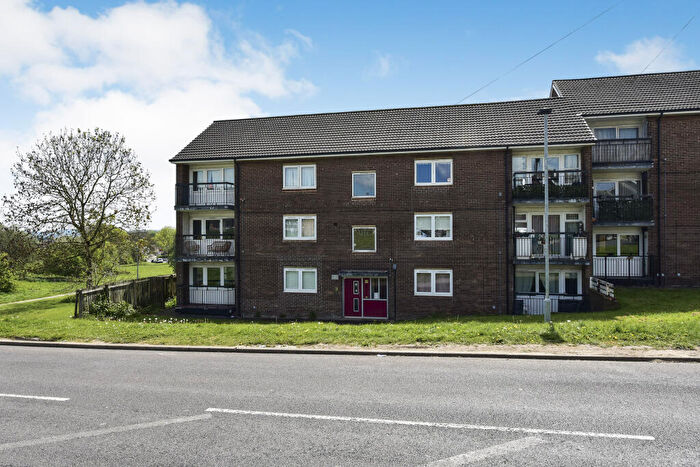
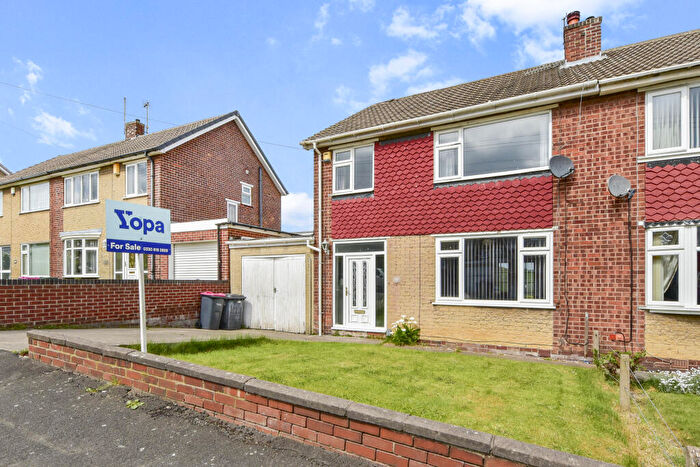
Properties for sale in Rotherham


![]()
If you are looking to sell your house, let it out, or receive a property valuation, an expert can help you.
Click the button below to get started.

Neighbourhoods in Rotherham
Navigate through our locations to find the location of your next house in Rotherham, Rotherham for sale or to rent.
- Boston Castle
- Brinsworth And Catcliffe
- Dinnington
- Hellaby
- Hoober
- Keppel
- Maltby
- Rawmarsh
- Rother Vale
- Rotherham East
- Rotherham West
- Silverwood
- Sitwell
- Valley
- Wath
- Wickersley
- Wingfield
- Rawmarsh West
- Rawmarsh East
- Thurcroft & Wickersley South
- Brinsworth
- Greasborough
- Swinton Rockingham
- Dalton & Thrybergh
- Wickersley North
- Bramley & Ravenfield
- Maltby East
- Hellaby & Maltby West
- Aughton & Swallownest
- Conisbrough
Transport in Rotherham
Please see below transportation links in this area:

- FAQ
- Price Paid By Year
- Property Type Price
Frequently asked questions about Rotherham
What is the average price for a property for sale in Rotherham?
The average price for a property for sale in Rotherham is £181,594. This amount is 4% lower than the average price in Rotherham. There are more than 10,000 property listings for sale in Rotherham.
What locations have the most expensive properties for sale in Rotherham?
The locations with the most expensive properties for sale in Rotherham are Dinnington at an average of £775,000, Bramley & Ravenfield at an average of £340,000 and Thurcroft & Wickersley South at an average of £310,768.
What locations have the most affordable properties for sale in Rotherham?
The locations with the most affordable properties for sale in Rotherham are Rotherham East at an average of £106,546, Maltby East at an average of £108,750 and Rotherham West at an average of £128,772.
Which train stations are available in or near Rotherham?
Some of the train stations available in or near Rotherham are Rotherham Central, Swinton (South Yorkshire) and Meadowhall.
Property Price Paid in Rotherham by Year
The average sold property price by year was:
| Year | Average Sold Price | Price Change |
Sold Properties
|
|---|---|---|---|
| 2026 | £189,473 | -0,5% |
139 Properties |
| 2025 | £190,355 | 4% |
2,178 Properties |
| 2024 | £181,820 | 5% |
2,351 Properties |
| 2023 | £172,454 | -2% |
2,266 Properties |
| 2022 | £176,042 | 3% |
2,837 Properties |
| 2021 | £170,510 | 9% |
3,374 Properties |
| 2020 | £154,395 | 1% |
2,552 Properties |
| 2019 | £152,380 | 3% |
2,822 Properties |
| 2018 | £147,917 | 5% |
2,556 Properties |
| 2017 | £140,360 | -5% |
2,695 Properties |
| 2016 | £147,194 | 5% |
2,885 Properties |
| 2015 | £139,818 | 2% |
2,694 Properties |
| 2014 | £136,729 | 2% |
2,751 Properties |
| 2013 | £133,312 | -0,1% |
2,091 Properties |
| 2012 | £133,442 | 8% |
1,751 Properties |
| 2011 | £122,534 | -5% |
1,623 Properties |
| 2010 | £128,611 | 3% |
1,583 Properties |
| 2009 | £124,555 | -3% |
1,461 Properties |
| 2008 | £127,976 | -5% |
1,811 Properties |
| 2007 | £133,752 | 6% |
3,410 Properties |
| 2006 | £126,073 | 8% |
3,377 Properties |
| 2005 | £115,779 | 12% |
3,046 Properties |
| 2004 | £102,136 | 18% |
3,580 Properties |
| 2003 | £83,435 | 18% |
3,536 Properties |
| 2002 | £68,485 | 13% |
3,647 Properties |
| 2001 | £59,788 | 8% |
3,313 Properties |
| 2000 | £55,060 | 3% |
3,068 Properties |
| 1999 | £53,214 | 10% |
2,606 Properties |
| 1998 | £47,835 | 4% |
2,562 Properties |
| 1997 | £46,095 | 0,3% |
2,603 Properties |
| 1996 | £45,965 | 2% |
2,397 Properties |
| 1995 | £44,831 | - |
2,199 Properties |
Property Price per Property Type in Rotherham
Here you can find historic sold price data in order to help with your property search.
The average Property Paid Price for specific property types in the last three years are:
| Property Type | Average Sold Price | Sold Properties |
|---|---|---|
| Semi Detached House | £176,174.00 | 3,203 Semi Detached Houses |
| Terraced House | £122,547.00 | 1,998 Terraced Houses |
| Detached House | £304,914.00 | 1,332 Detached Houses |
| Flat | £109,453.00 | 401 Flats |