
Houses for sale & to rent in Dinnington, Rotherham
House Prices in Dinnington
Properties in Dinnington have an average house price of £775k and had 2 Property Transactions within the last 3 years¹.
Dinnington is an area in Rotherham, Rotherham with 58 households², where the most expensive property was sold for £975k.
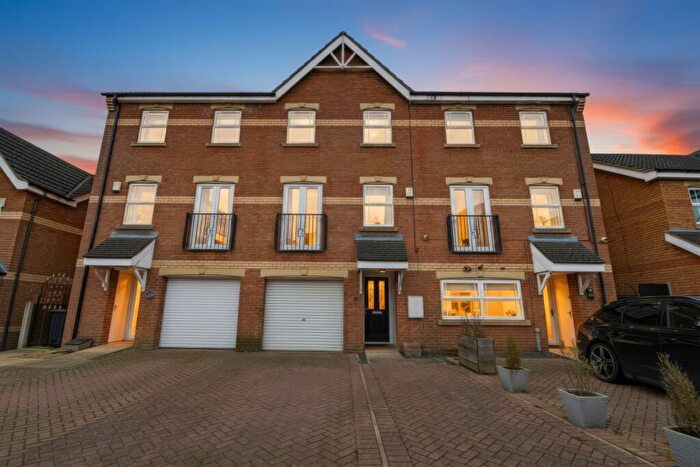
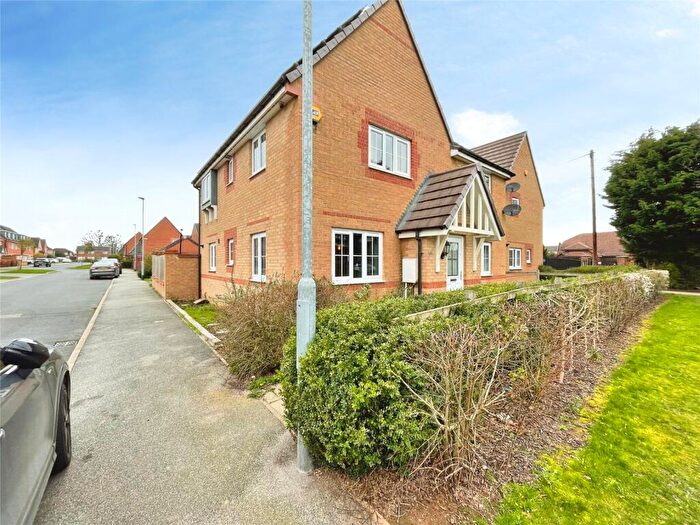
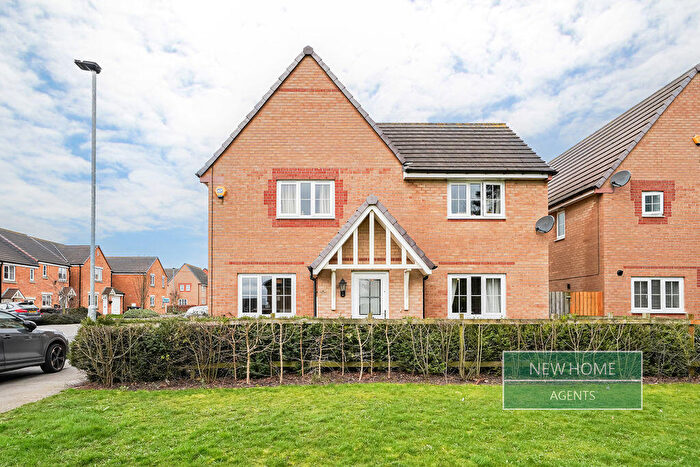
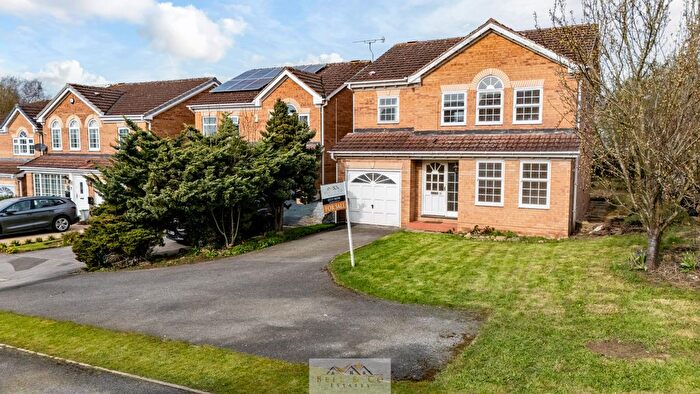
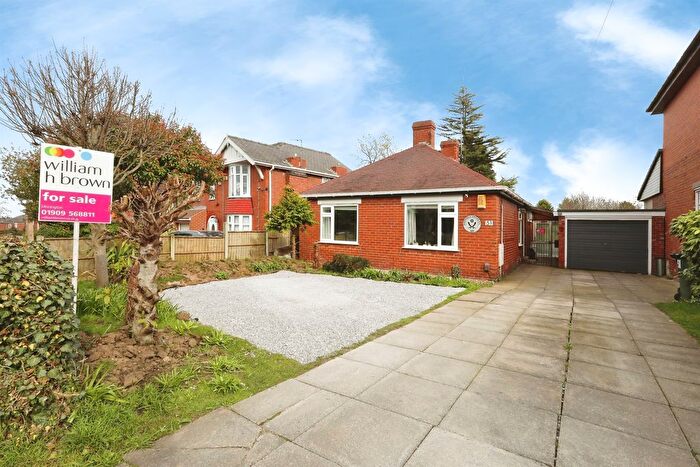
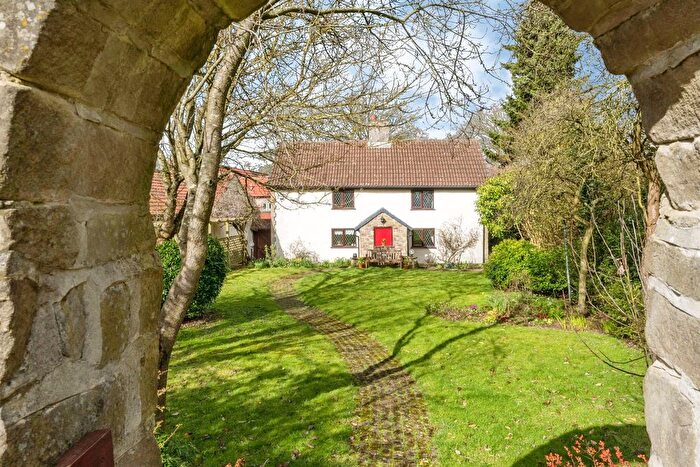
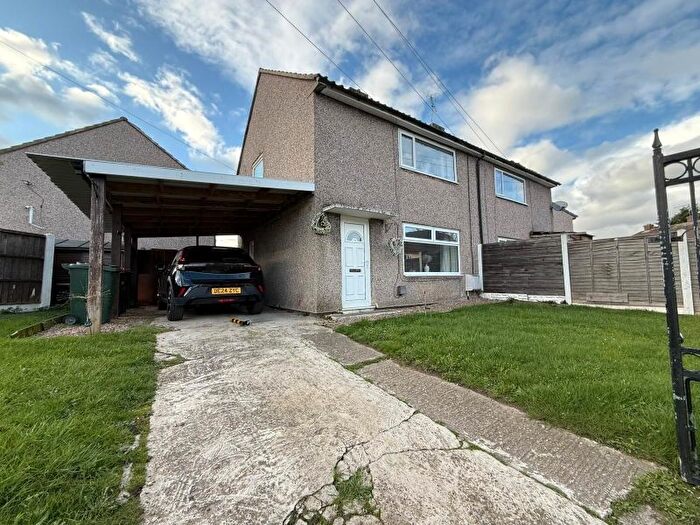
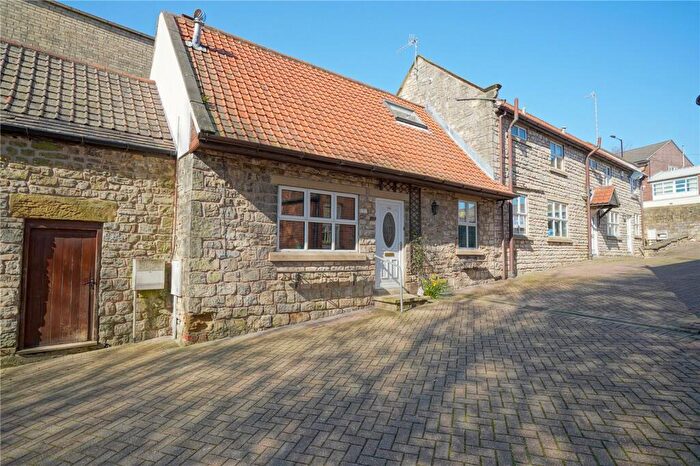
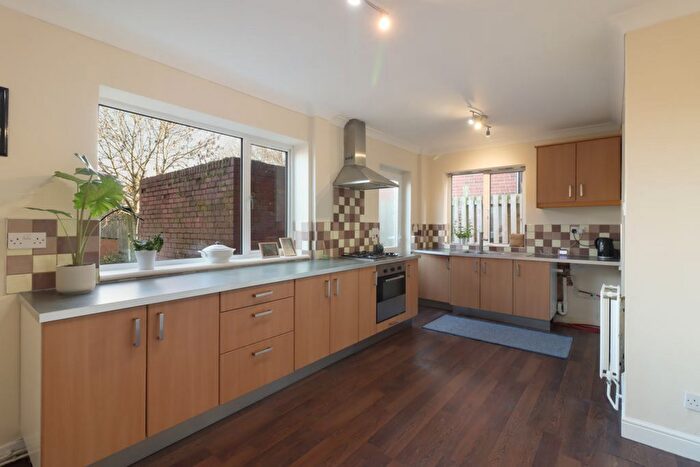
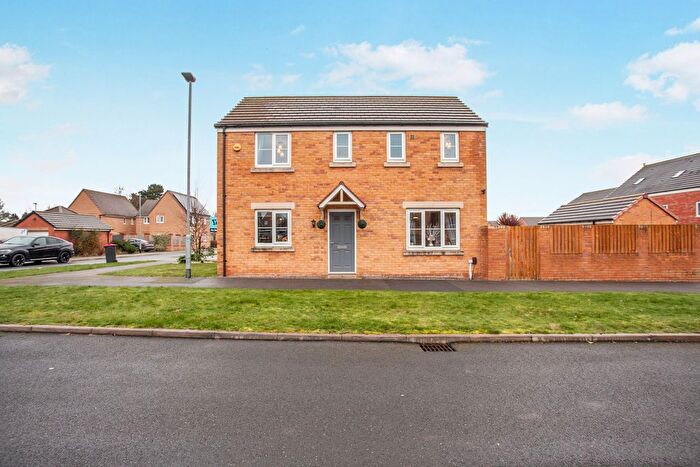
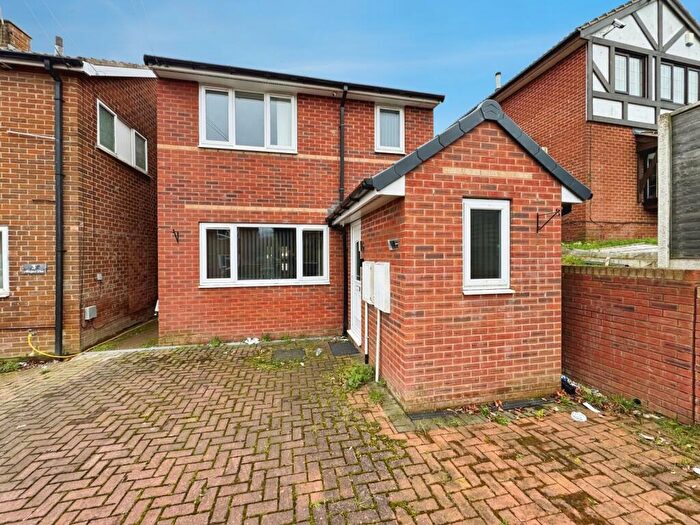
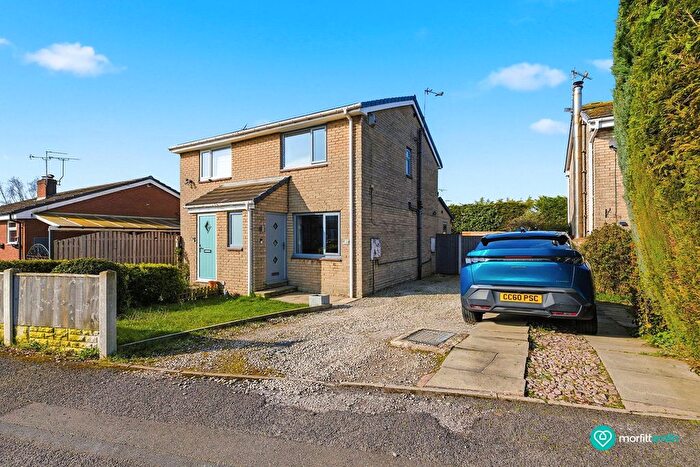
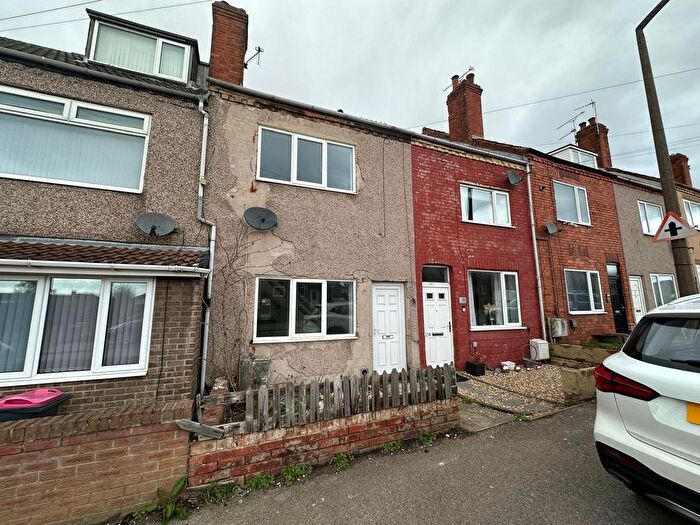
Properties for sale in Dinnington
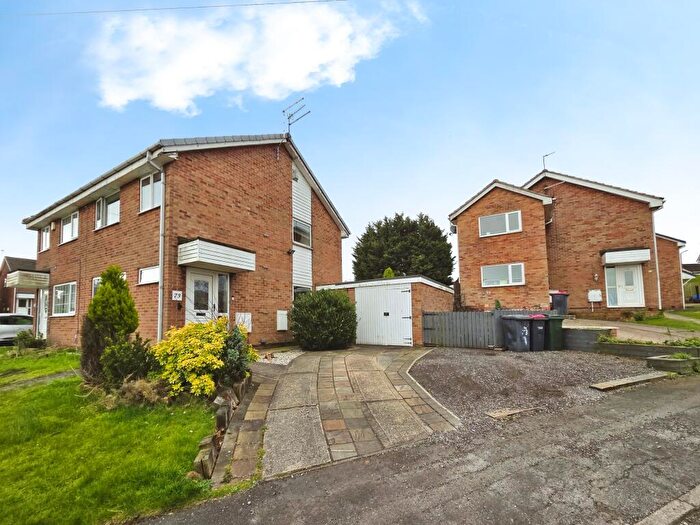

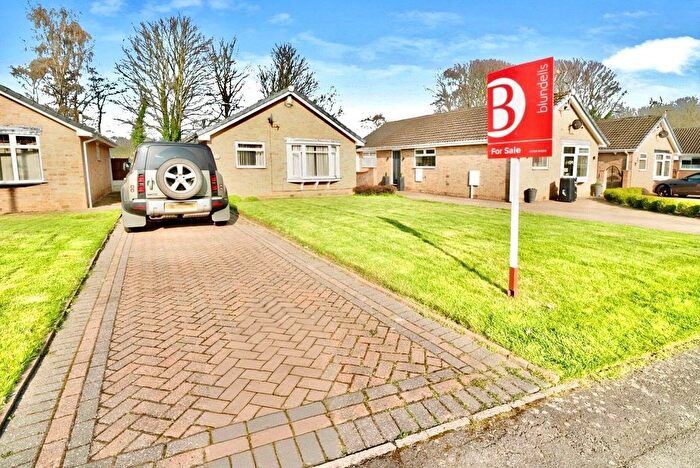
![]()
If you are looking to sell your house, let it out, or receive a property valuation, an expert can help you.
Click the button below to get started.

Roads and Postcodes in Dinnington
Navigate through our locations to find the location of your next house in Dinnington, Rotherham for sale or to rent.
| Streets | Postcodes |
|---|---|
| Abbey Glen | S66 8PS |
| Carr | S66 8PW S66 8PR |
| Common Lane | S66 9BW |
| Hawkhill Lane | S66 9BL |
| Howard Street | S65 1YT |
| Laughton Common Road | S66 9BN |
| Newhall Grange | S66 8PT |
| Stone | S66 8NT |
| The Avenue | S66 8PP |
Transport near Dinnington
-
 Kiveton Park Station
 -
Kiveton Bridge Station
-
Shireoaks Station
-
Woodhouse Station
-
Rotherham Central Station
-
Conisbrough Station
-
Swinton (South Yorkshire) Station
-
Mexborough Station
-
Worksop Station
-
Darnall Station
- FAQ
- Price Paid By Year
- Property Type Price
Frequently asked questions about Dinnington
What is the average price for a property for sale in Dinnington?
The average price for a property for sale in Dinnington is £775,000. This amount is 327% higher than the average price in Rotherham. There are 2,307 property listings for sale in Dinnington.
What streets have the most expensive properties for sale in Dinnington?
The street with the most expensive properties for sale in Dinnington is Laughton Common Road at an average of £975,000.
What streets have the most affordable properties for sale in Dinnington?
The street with the most affordable properties for sale in Dinnington is Carr at an average of £575,000.
Which train stations are available in or near Dinnington?
Some of the train stations available in or near Dinnington are Kiveton Park, Kiveton Bridge and Shireoaks.
Property Price Paid in Dinnington by Year
The average sold property price by year was:
| Year | Average Sold Price | Price Change |
Sold Properties
|
|---|---|---|---|
| 2024 | £775,000 | 46% |
2 Properties |
| 2022 | £416,250 | 33% |
4 Properties |
| 2020 | £277,500 | 17% |
3 Properties |
| 2019 | £231,250 | -8% |
2 Properties |
| 2018 | £250,000 | -36% |
3 Properties |
| 2017 | £340,000 | -32% |
1 Property |
| 2016 | £450,000 | 44% |
1 Property |
| 2015 | £249,997 | -20% |
2 Properties |
| 2013 | £300,000 | 19% |
1 Property |
| 2012 | £242,500 | 22% |
1 Property |
| 2010 | £189,000 | -79% |
1 Property |
| 2009 | £338,000 | 28% |
1 Property |
| 2008 | £245,000 | -2% |
3 Properties |
| 2007 | £249,890 | 39% |
5 Properties |
| 2006 | £151,666 | -35% |
3 Properties |
| 2004 | £205,000 | - |
1 Property |
| 2003 | £205,000 | 43% |
1 Property |
| 2002 | £116,000 | -16% |
3 Properties |
| 2001 | £135,000 | 48% |
1 Property |
| 2000 | £70,500 | 15% |
2 Properties |
| 1998 | £60,000 | 18% |
1 Property |
| 1997 | £49,500 | 18% |
1 Property |
| 1996 | £40,833 | - |
3 Properties |
Property Price per Property Type in Dinnington
Here you can find historic sold price data in order to help with your property search.
The average Property Paid Price for specific property types in the last three years are:
| Property Type | Average Sold Price | Sold Properties |
|---|---|---|
| Detached House | £775,000.00 | 2 Detached Houses |