
Houses for sale in Maltby, Worksop
House Prices in Maltby
Properties in Maltby have no sales history available within the last 3 years.
Maltby is an area in Worksop, Rotherham with 23 households².
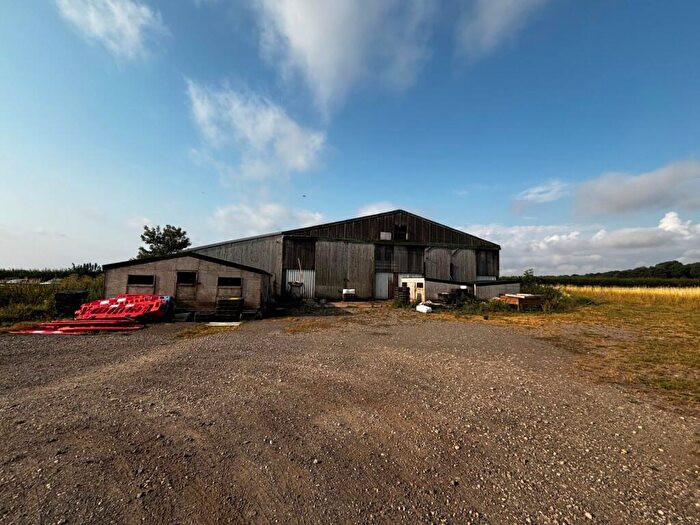
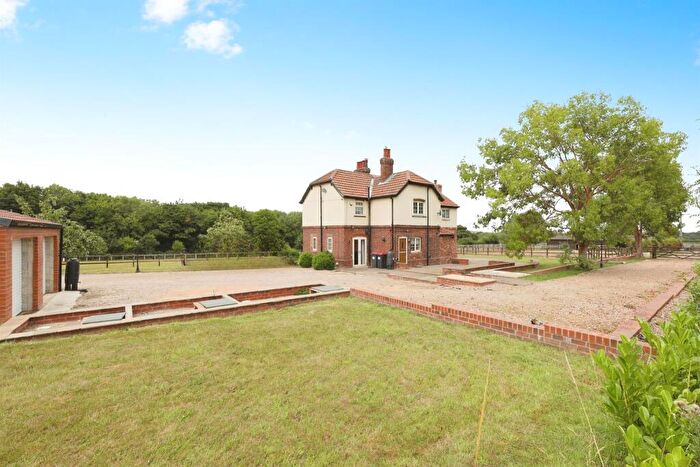
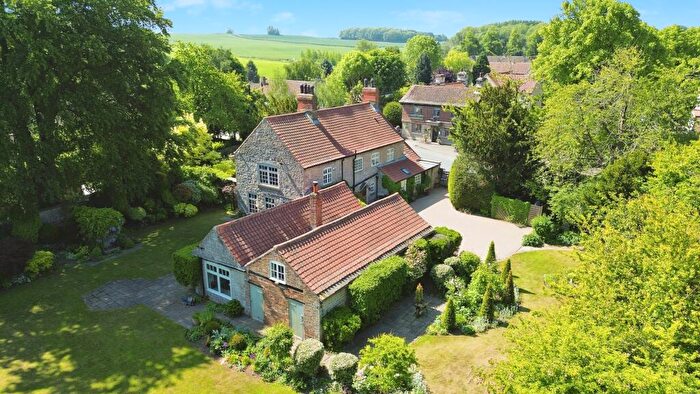
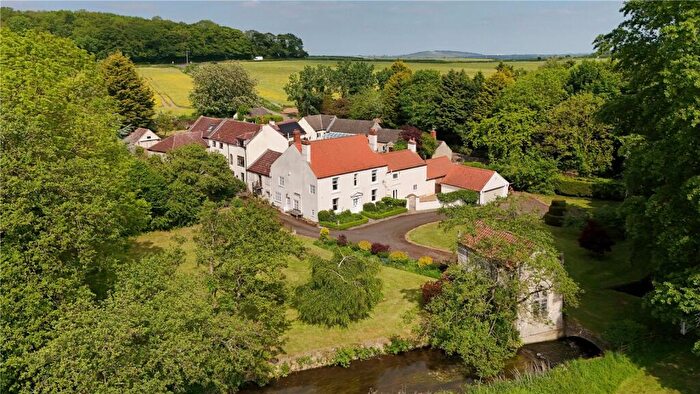
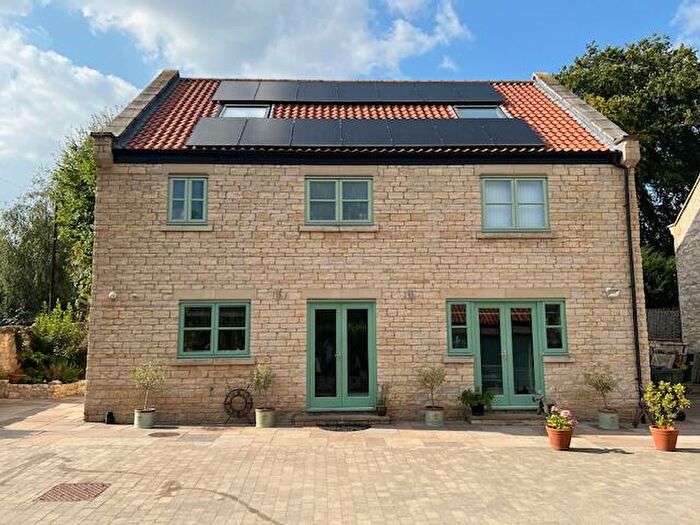
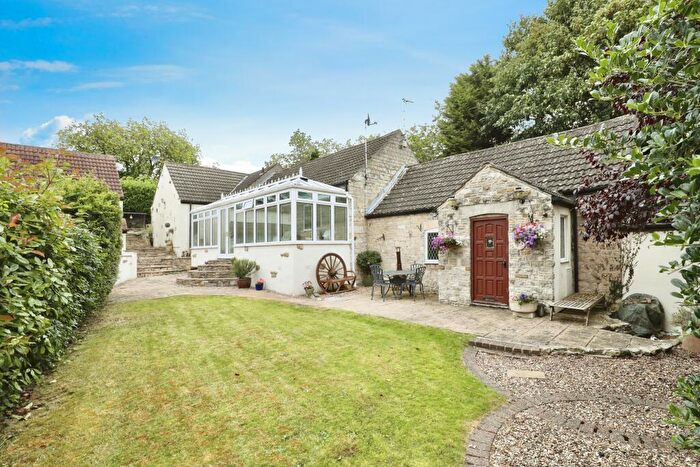
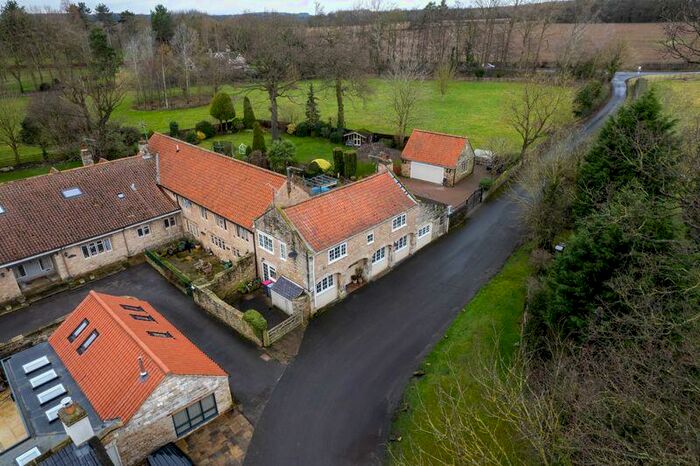
Properties for sale in Maltby
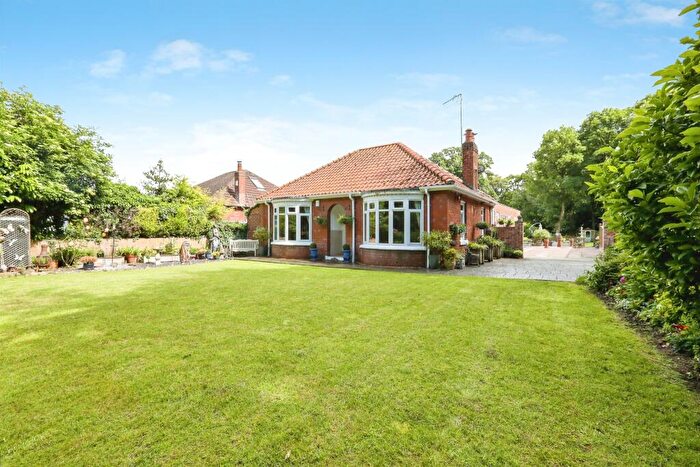
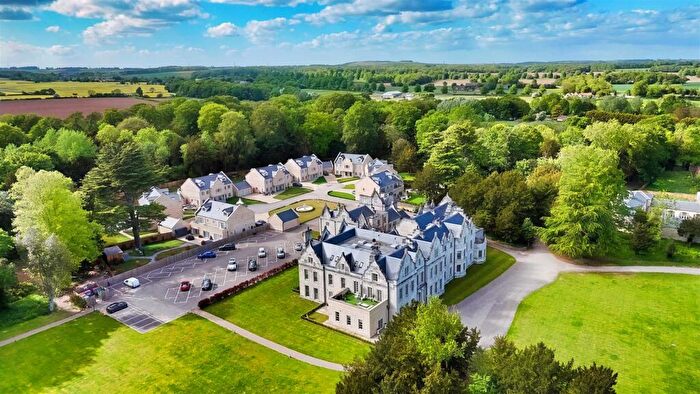
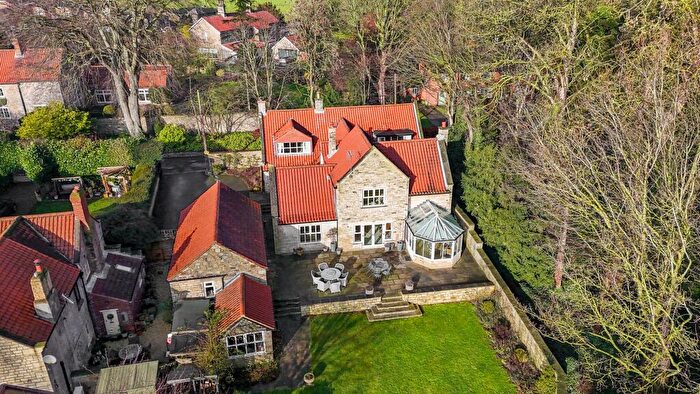
![]()
If you are looking to sell your house, let it out, or receive a property valuation, an expert can help you.
Click the button below to get started.
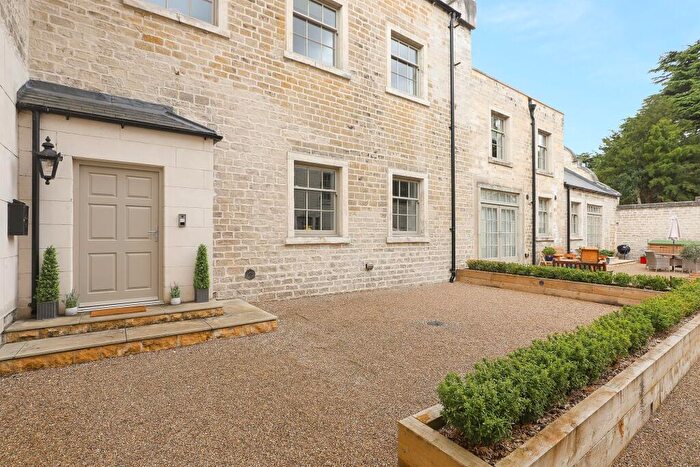
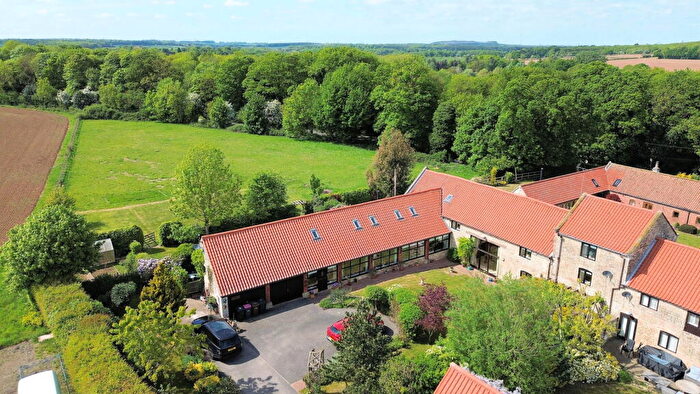
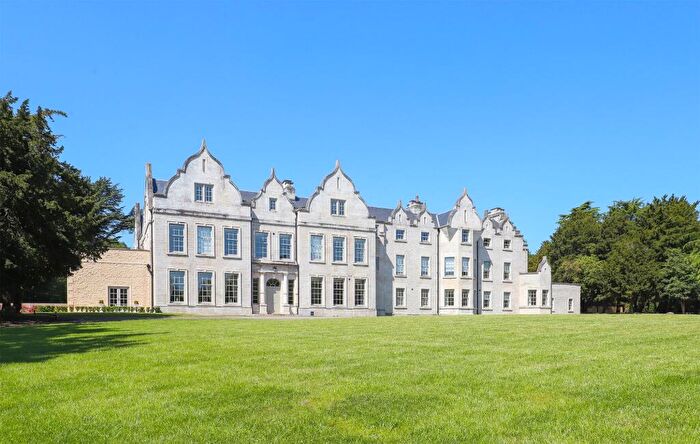
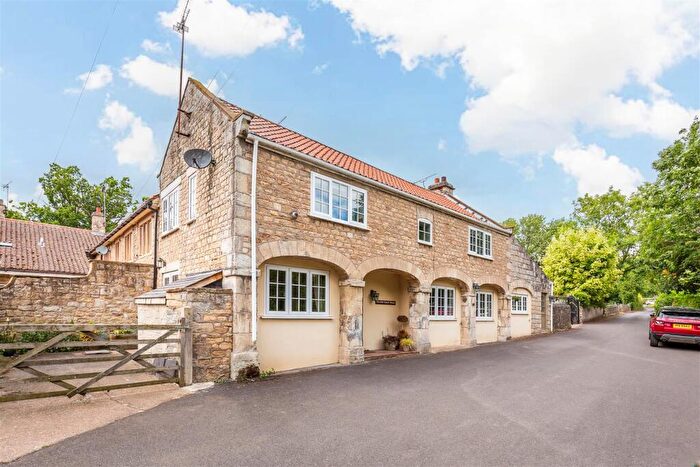
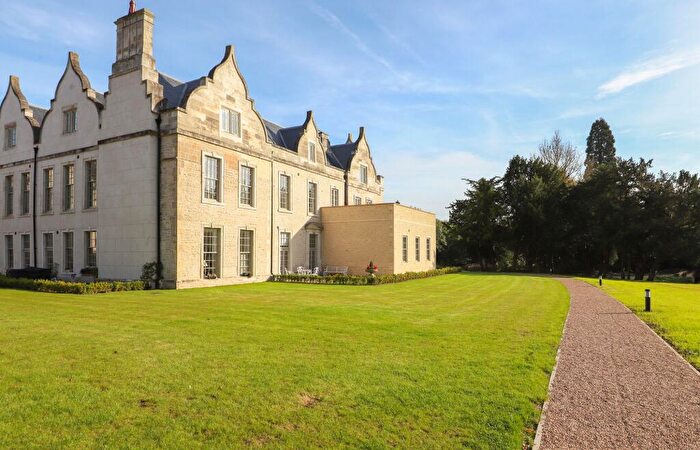
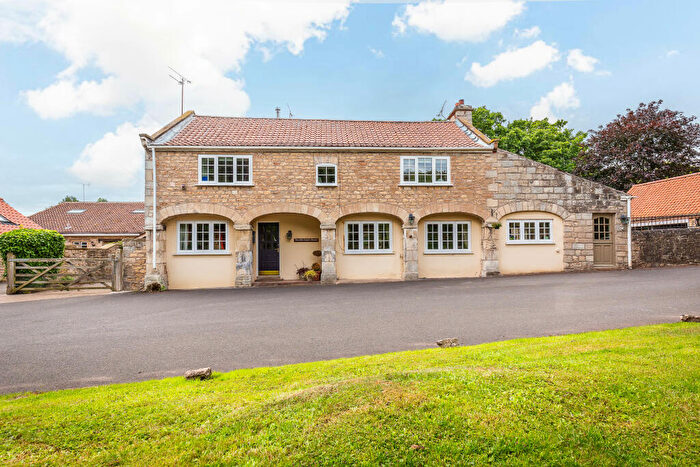
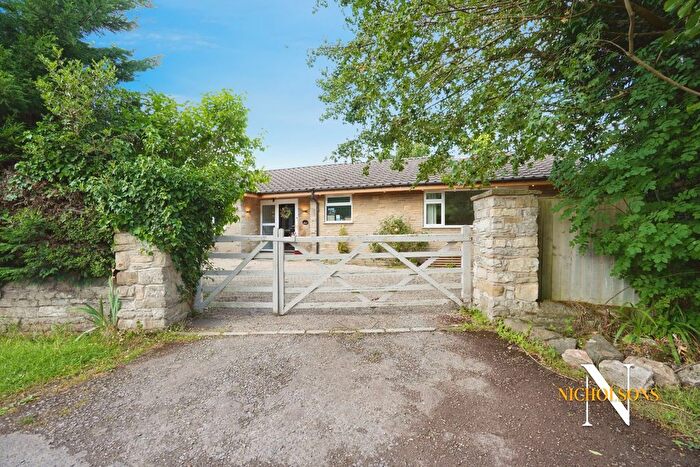
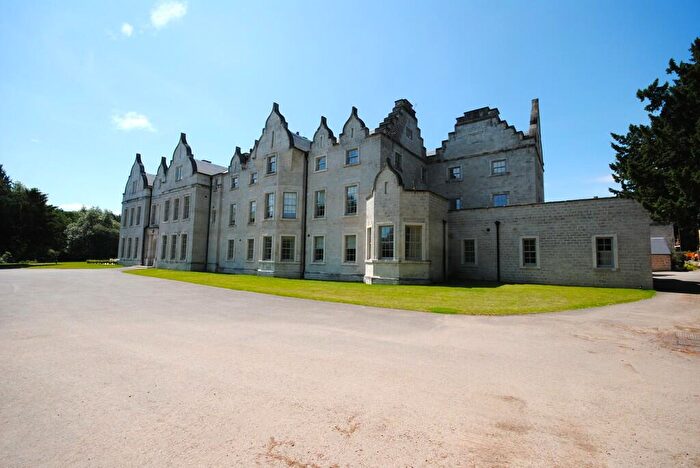
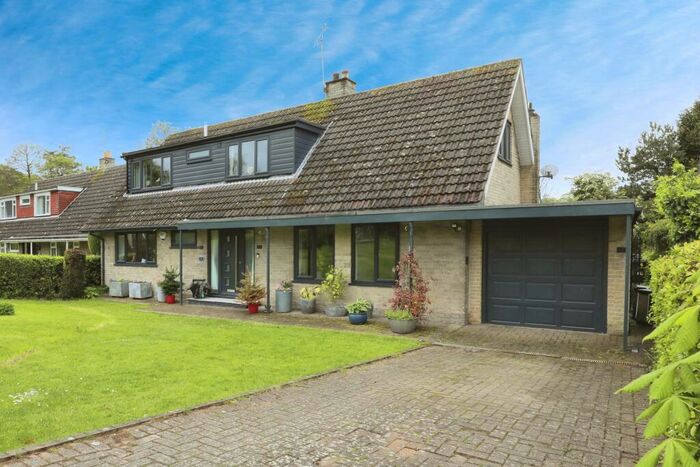
Previously listed properties in Maltby

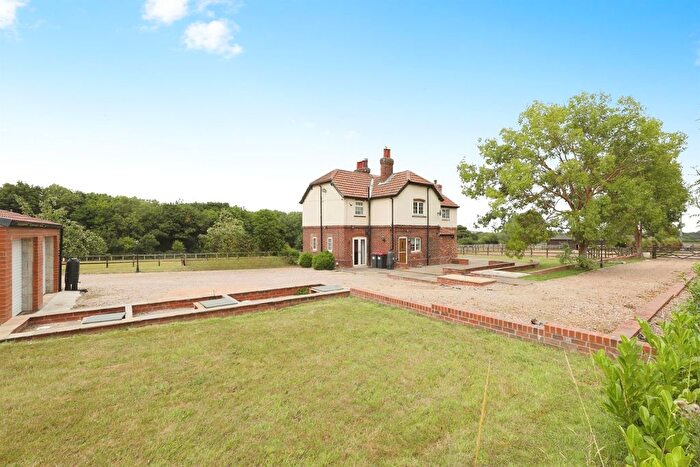
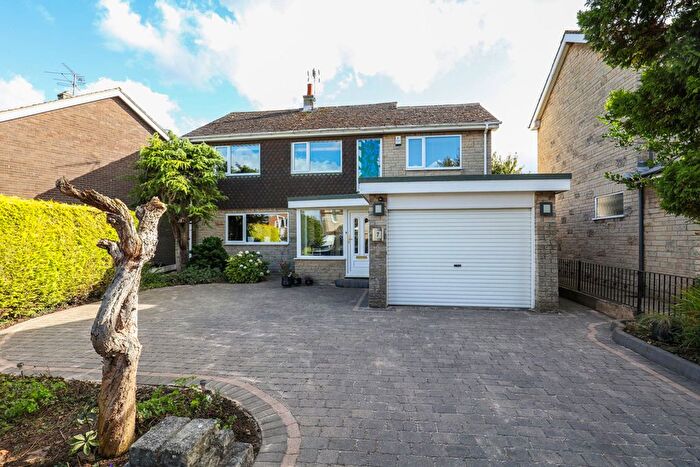
![]()
If you are looking to sell your house, let it out, or receive a property valuation, an expert can help you.
Click the button below to get started.


Roads and Postcodes in Maltby
Navigate through our locations to find the location of your next house in Maltby, Worksop for sale or to rent.
Property price trends in Maltby
According to the latest Land Registry data, the average home in Maltby sold for £855,000 in 2022. That figure comes from 17 sales logged over the past 25 years.
Prices have continued to climb over the last three years. Compared with 2019, when the typical sale came in around £440,000, that's a rise of roughly 94.3%.
Looking back five years, average prices are up about 418.2% since 2016, a gain of around £690,000 in cash terms.
Zoom out to the past decade for the fuller picture. Back in 2011, homes here averaged £322,000, so the typical sold price has climbed about 165.5% since then, roughly 9.3% a year. Stretch the view to fifteen years and that annual pace edges up closer to 14.6%.
Frequently asked questions about Maltby
Which train stations are available in or near Maltby?
Some of the train stations available in or near Maltby are Shireoaks, Kiveton Park and Worksop.
Property Price Paid in Maltby by Year
The average sold property price by year was:
| Year | Average Sold Price | Price Change |
Sold Properties
|
|---|---|---|---|
| 2022 | £855,000 | 52% |
1 Property |
| 2021 | £410,000 | 27% |
2 Properties |
| 2020 | £300,000 | -47% |
1 Property |
| 2019 | £440,000 | 5% |
1 Property |
| 2018 | £420,000 | 61% |
1 Property |
| 2016 | £165,000 | -167% |
2 Properties |
| 2015 | £440,500 | 27% |
1 Property |
| 2011 | £322,000 | -16% |
1 Property |
| 2009 | £375,000 | 71% |
1 Property |
| 2007 | £110,000 | -50% |
1 Property |
