
Houses for sale in Blyth, Worksop
House Prices in Blyth
Properties in Blyth have an average house price of £339k and had 65 Property Transactions within the last 3 years¹.
Blyth is an area in Worksop, Nottinghamshire with 694 households², where the most expensive property was sold for £875k.
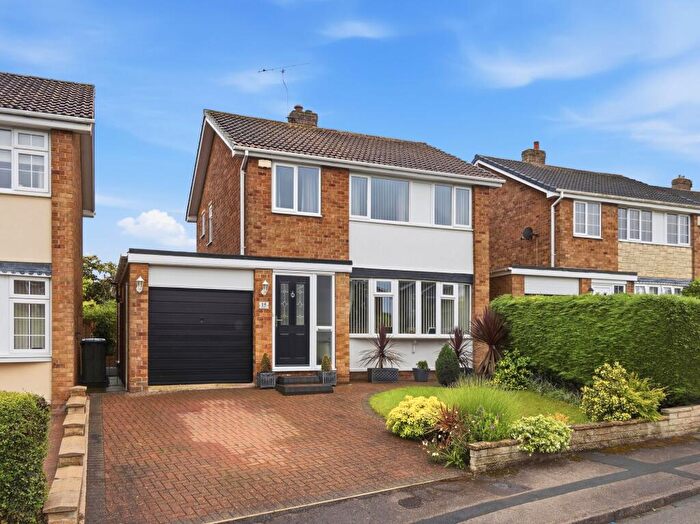
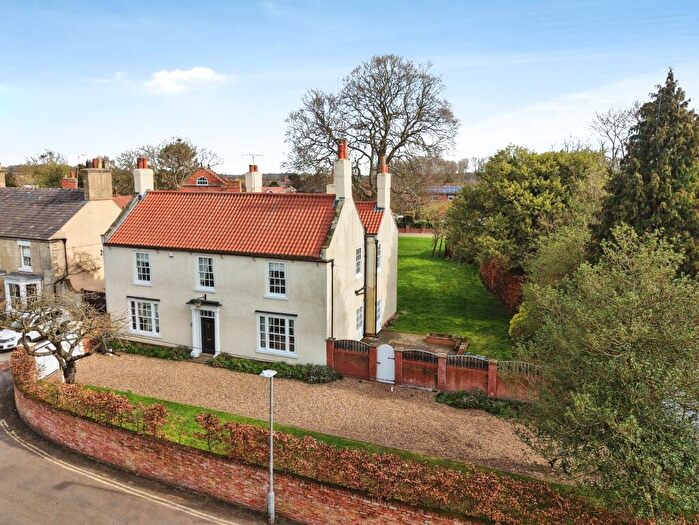
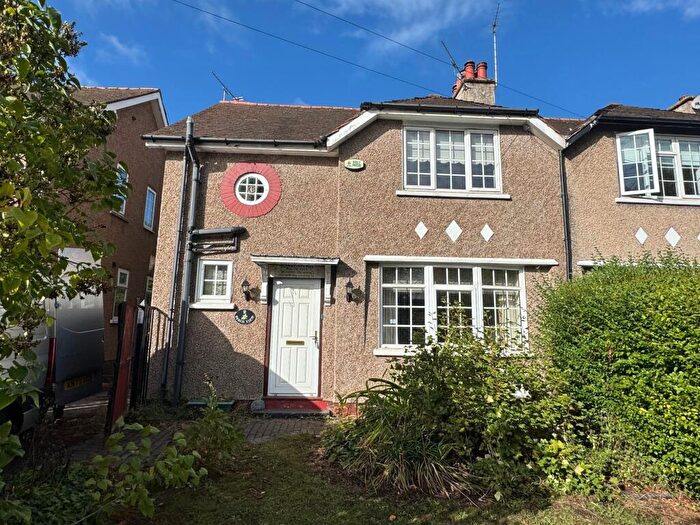
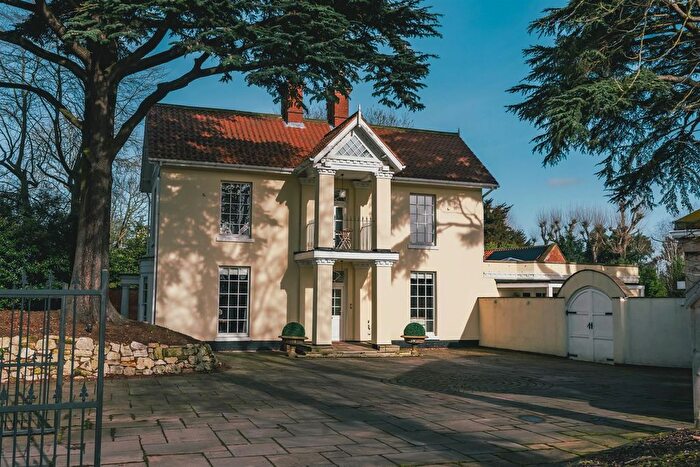
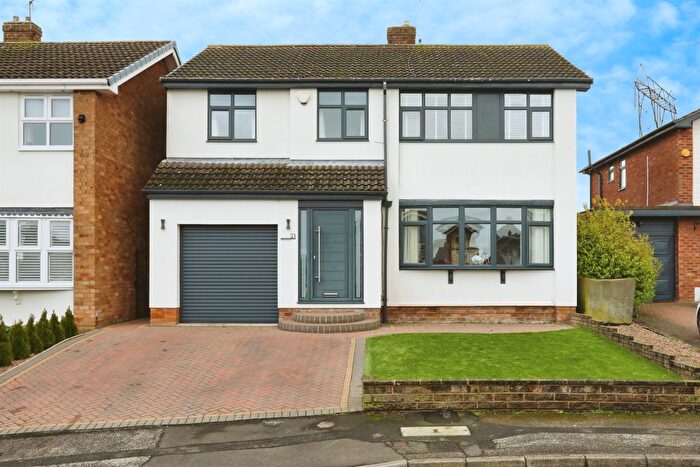
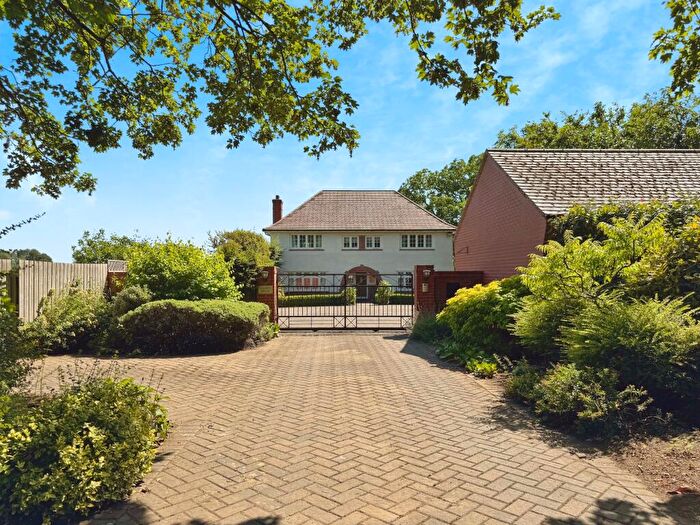
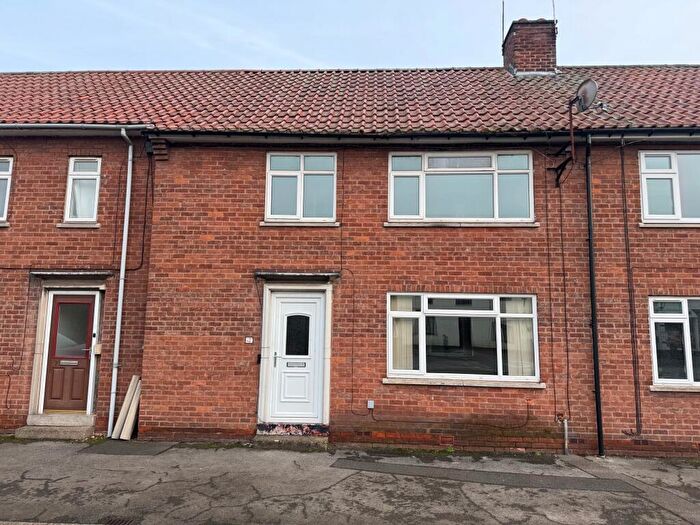
Properties for sale in Blyth
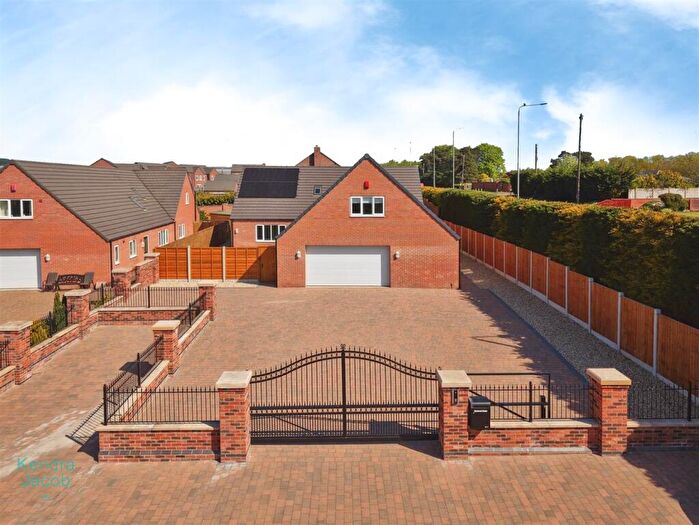
![]()
If you are looking to sell your house, let it out, or receive a property valuation, an expert can help you.
Click the button below to get started.
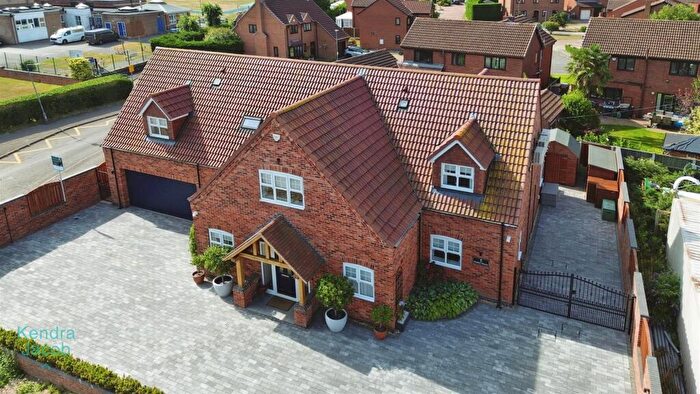
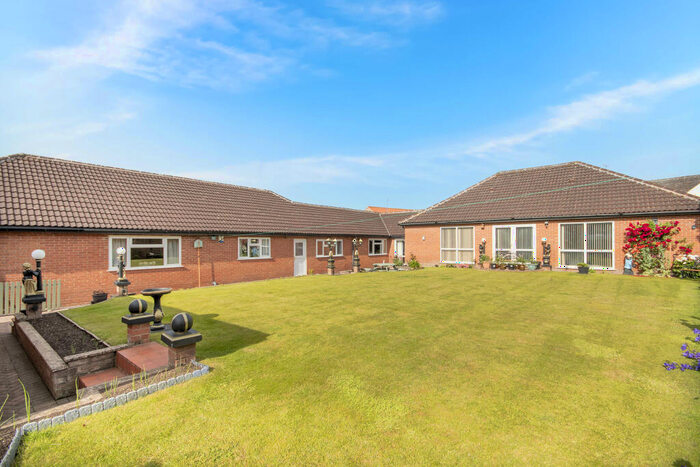
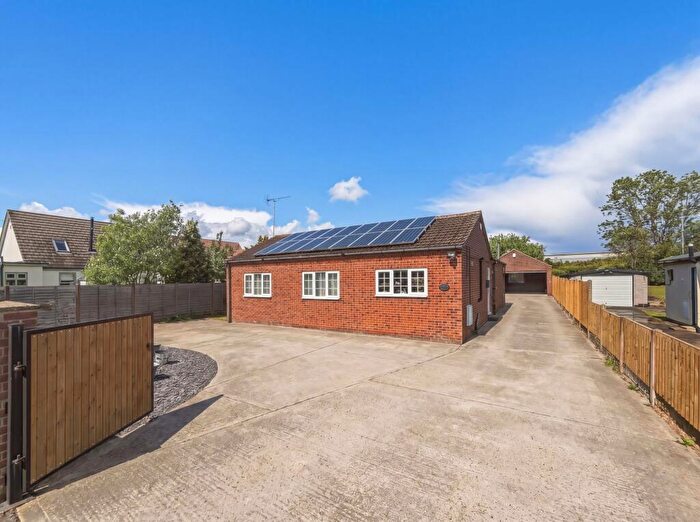
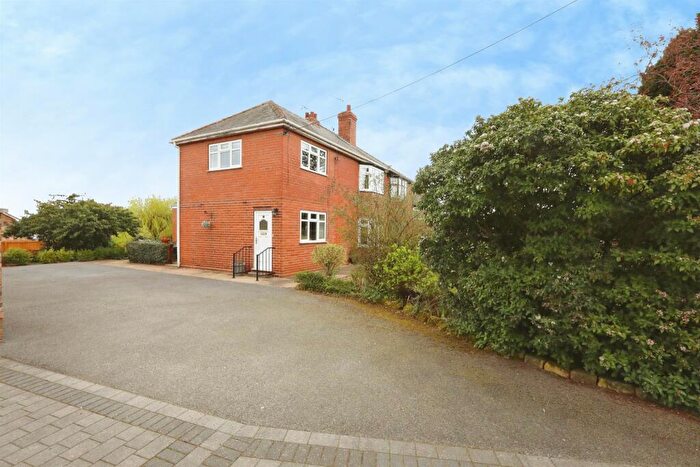
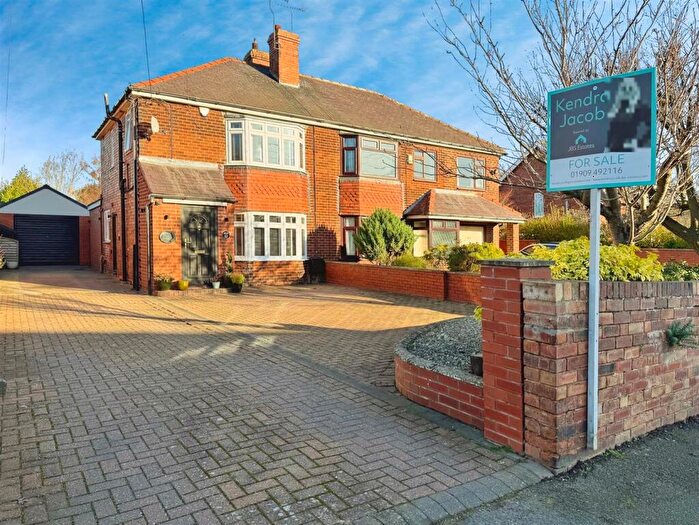
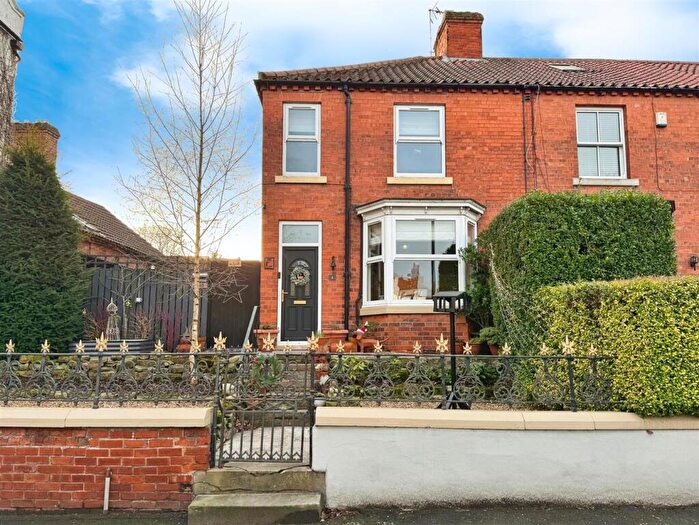
Previously listed properties in Blyth
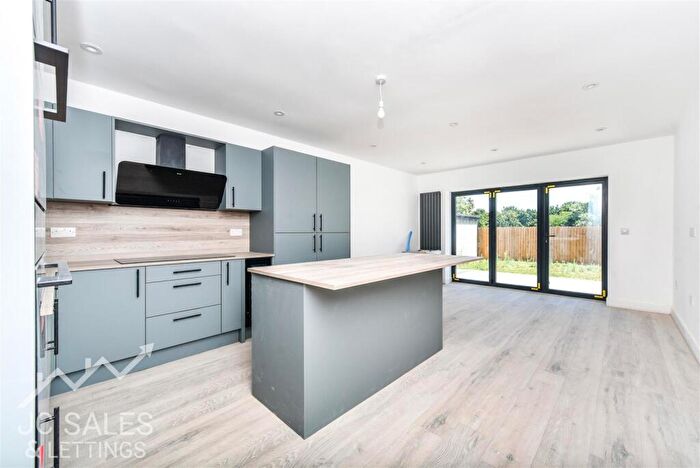
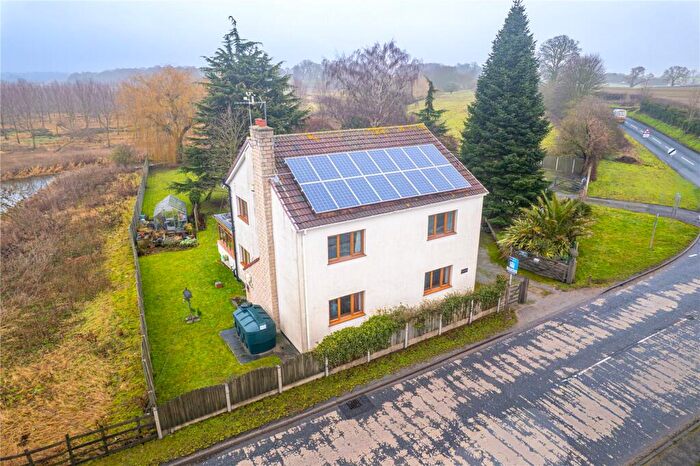
![]()
If you are looking to sell your house, let it out, or receive a property valuation, an expert can help you.
Click the button below to get started.
Roads and Postcodes in Blyth
Navigate through our locations to find the location of your next house in Blyth, Worksop for sale or to rent.
| Streets | Postcodes |
|---|---|
| Aysfield Gardens | S81 8QY |
| Back Lane | S81 8GQ |
| Barley Fields | S81 8FQ |
| Bawtry Road | S81 8HG S81 8HJ |
| Beech View | S81 8EE |
| Blyth Gardens | S81 8FS |
| Blyth Hall | S81 8HL |
| Blyth Road | S81 8HU S81 8JA S81 8JE S81 8JL |
| Briber Road | S81 8DZ |
| Doncaster Road | S81 8HT |
| Elmsmere Drive | S81 8HZ |
| Harworth Avenue | S81 8HH |
| Harworth Road | S81 8HQ |
| High Street | S81 8EP S81 8EN S81 8EQ S81 8EW |
| Lawson Square | S81 8EG |
| Little Lane | S81 8ET |
| Main Street | S81 8JF S81 8JG S81 8JH S81 8JQ |
| Maltby Road | S81 8JN |
| Meadow Court | S81 8FY |
| Mill Meadow View | S81 8HA |
| Orchard Grove | S81 8GP |
| Paddock Grove | S81 8FX |
| Pheasant Close | S81 8GR |
| Priory Close | S81 8HN |
| Retford Road | S81 8ER S81 8ES S81 8EY S81 8HB |
| Ryton Close | S81 8DN |
| Ryton Fields | S81 8DP |
| Sheffield Road | S81 8HF |
| Sherwood Crescent | S81 8ED |
| South View | S81 8HX |
| Spital Road | S81 8DT S81 8DU S81 8EF S81 8EL |
| Spitalfields | S81 8EA S81 8EB |
| St Johns | S81 8EJ |
| St Martins Close | S81 8DW |
| St Marys Court | S81 8GW |
| Styrrup Road | S81 8JB |
| Symmetry Drive | S81 8FH |
| Symmetry Way | S81 8PU |
| The Hollies | S81 8FJ |
| The Maltings | S81 8HD |
| The Mount | S81 8HE |
| The Woodlands | S81 8HR |
| Two Acres | S81 8DS |
| Weirside | S81 8HW |
| West View | S81 8JJ |
| Wheatfield View | S81 8FR |
| Whitehouse Mews | S81 8FB |
| Worksop Road | S81 8DX S81 8DY |
| Wynlea Drive | S81 8HY |
| S81 0TX |
Property price trends in Blyth
According to the latest Land Registry data, the average home in Blyth sold for £435,000 in 2026. That figure comes from 771 sales logged over the past 31 years.
Prices have continued to climb over the last three years. Compared with 2023, when the typical sale came in around £328,400, that's a rise of roughly 32.5%.
Looking back five years, average prices are up about 47.9% since 2021, a gain of around £140,903 in cash terms.
Zoom out to the past decade for the fuller picture. Back in 2016, homes here averaged £210,890, so the typical sold price has climbed about 106.3% since then, roughly 7.5% a year. Stretch the view to fifteen years and that annual pace eases back to about 4%.
Frequently asked questions about Blyth
What is the average price for a property for sale in Blyth?
The average price for a property for sale in Blyth is £339,476. This amount is 74% higher than the average price in Worksop. There are 187 property listings for sale in Blyth.
What streets have the most expensive properties for sale in Blyth?
The streets with the most expensive properties for sale in Blyth are Main Street at an average of £490,000, Two Acres at an average of £461,500 and Bawtry Road at an average of £459,600.
What streets have the most affordable properties for sale in Blyth?
The streets with the most affordable properties for sale in Blyth are Wynlea Drive at an average of £143,500, Doncaster Road at an average of £149,000 and Lawson Square at an average of £160,000.
Which train stations are available in or near Blyth?
Some of the train stations available in or near Blyth are Worksop, Shireoaks and Retford.
Property Price Paid in Blyth by Year
The average sold property price by year was:
| Year | Average Sold Price | Price Change |
Sold Properties
|
|---|---|---|---|
| 2026 | £435,000 | 21% |
1 Property |
| 2025 | £341,868 | -1% |
19 Properties |
| 2024 | £346,275 | 5% |
20 Properties |
| 2023 | £328,400 | -15% |
25 Properties |
| 2022 | £376,160 | 22% |
25 Properties |
| 2021 | £294,097 | -10% |
24 Properties |
| 2020 | £324,243 | 0,1% |
15 Properties |
| 2019 | £323,888 | 21% |
36 Properties |
| 2018 | £257,062 | 1% |
32 Properties |
| 2017 | £255,264 | 17% |
32 Properties |
Property Price per Property Type in Blyth
Here you can find historic sold price data in order to help with your property search.
The average Property Paid Price for specific property types in the last three years are:
| Property Type | Average Sold Price | Sold Properties |
|---|---|---|
| Semi Detached House | £251,473.00 | 19 Semi Detached Houses |
| Detached House | £400,439.00 | 41 Detached Houses |
| Terraced House | £174,000.00 | 5 Terraced Houses |
