Houses for sale & to rent in Ketton, Stamford
House Prices in Ketton
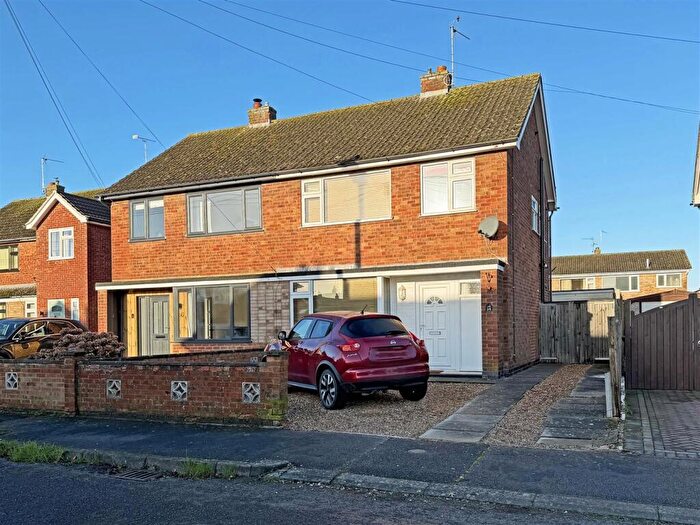
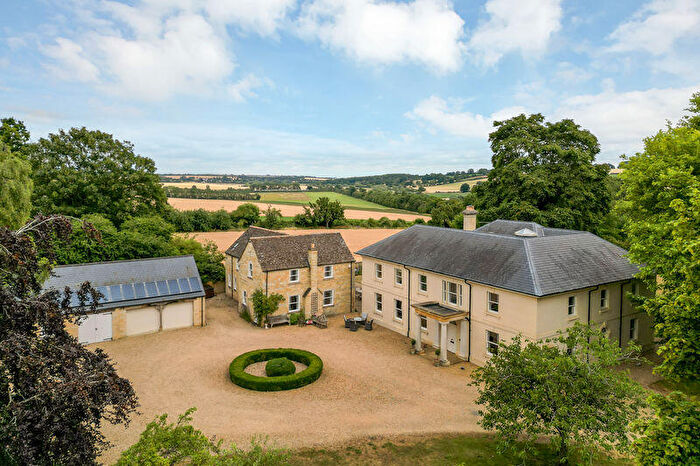
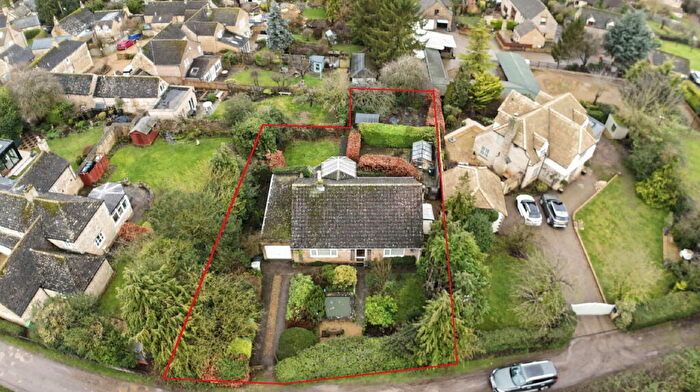
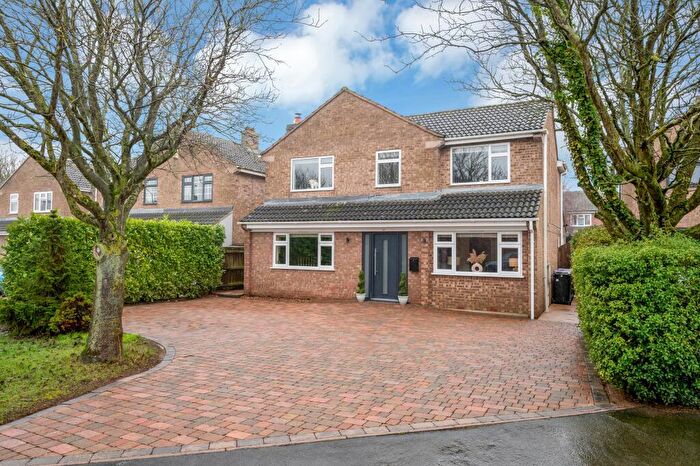
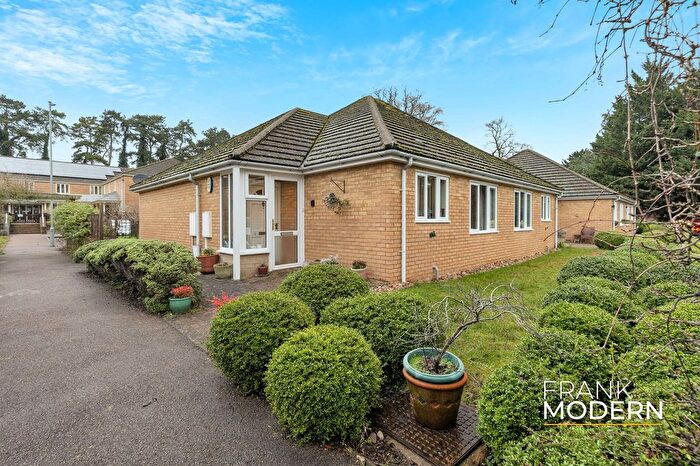
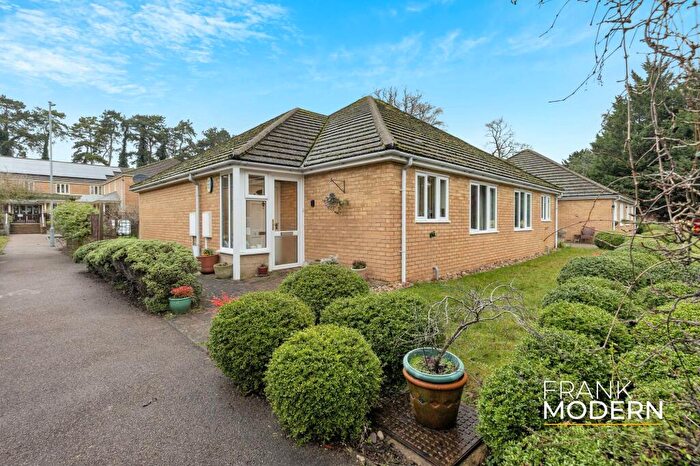
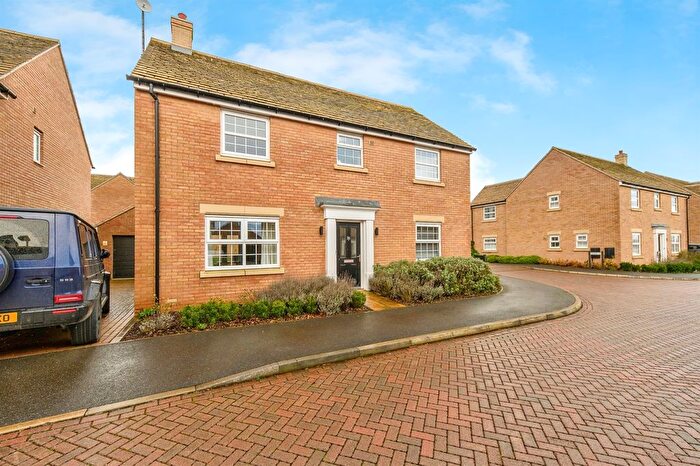
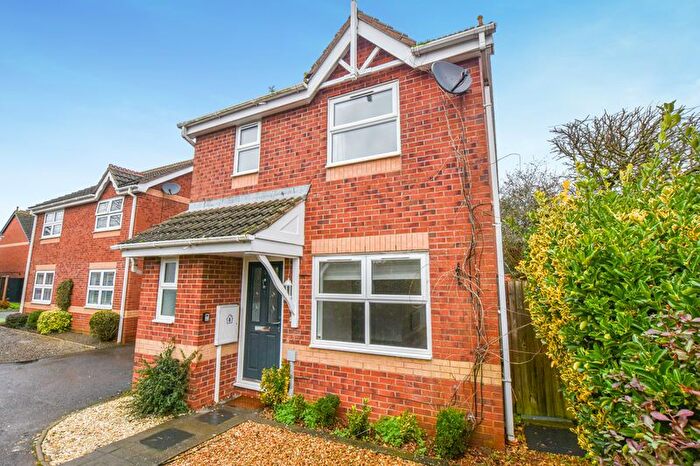
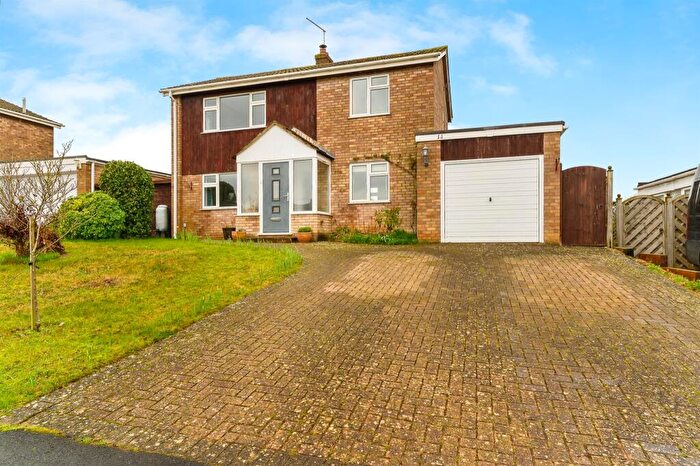
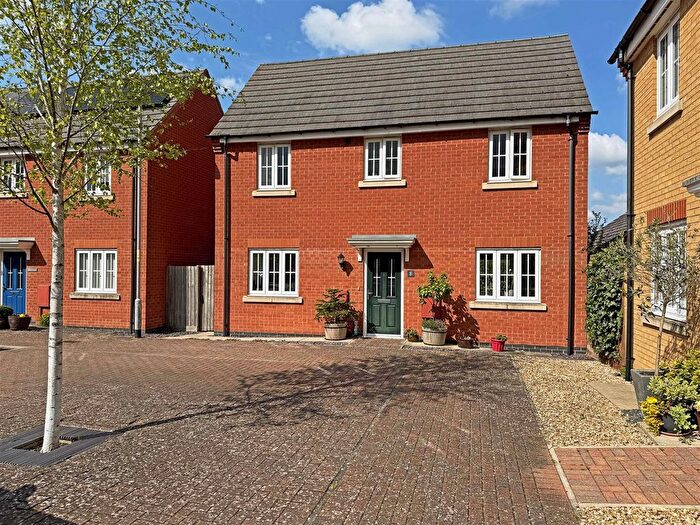
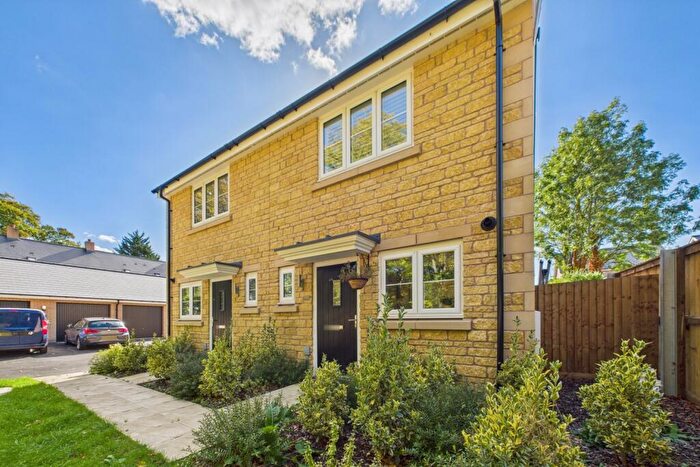
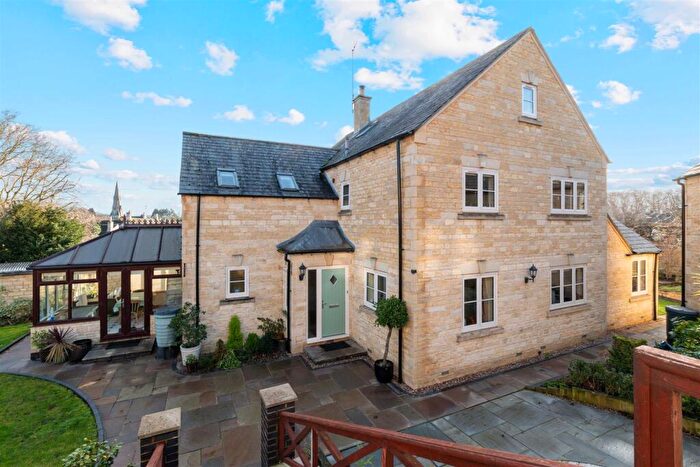
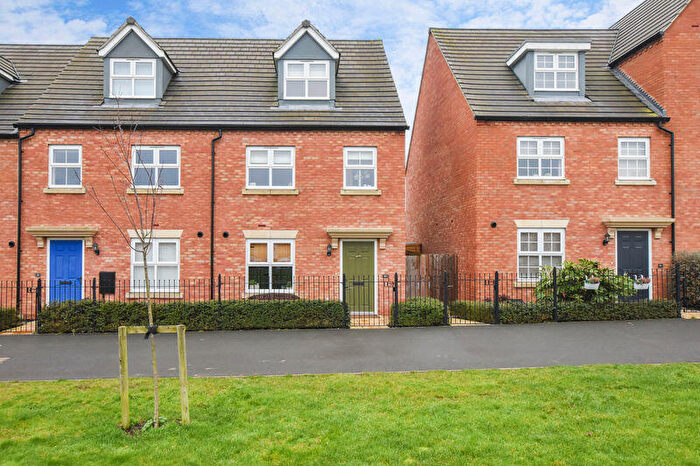
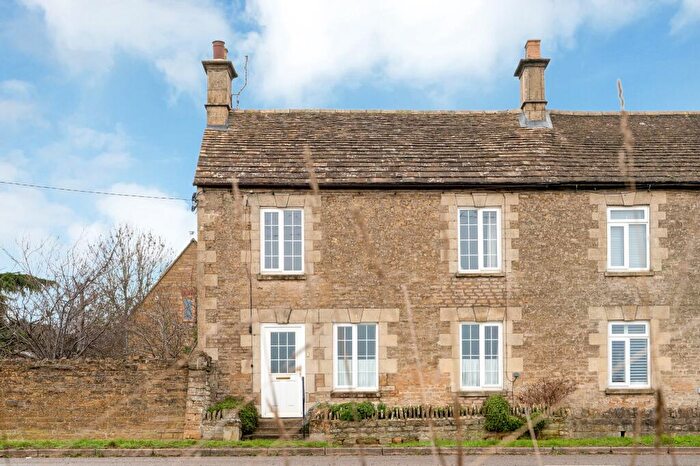
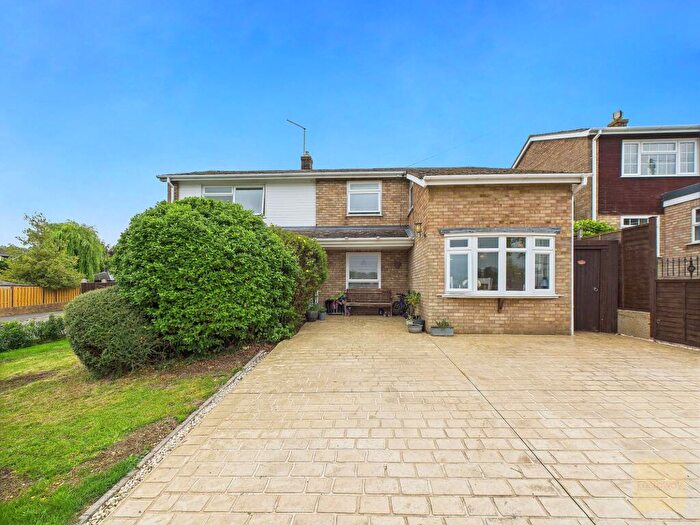
Properties in Ketton have an average house price of £547,039.00 and had 88 Property Transactions within the last 3 years¹.
Ketton is an area in Stamford, Rutland with 945 households², where the most expensive property was sold for £1,545,000.00.
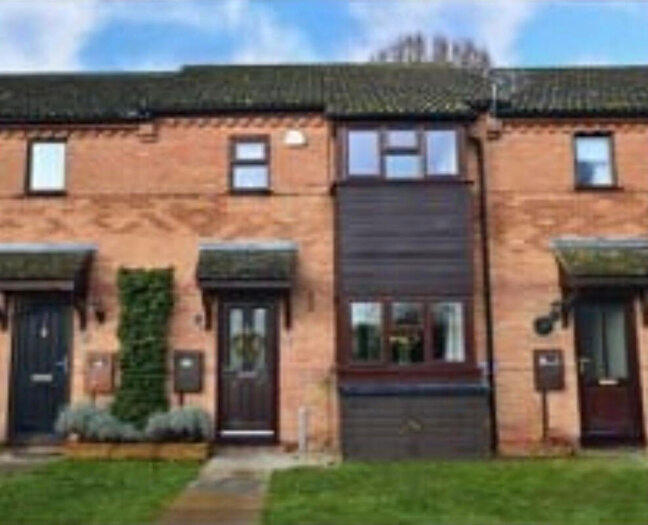
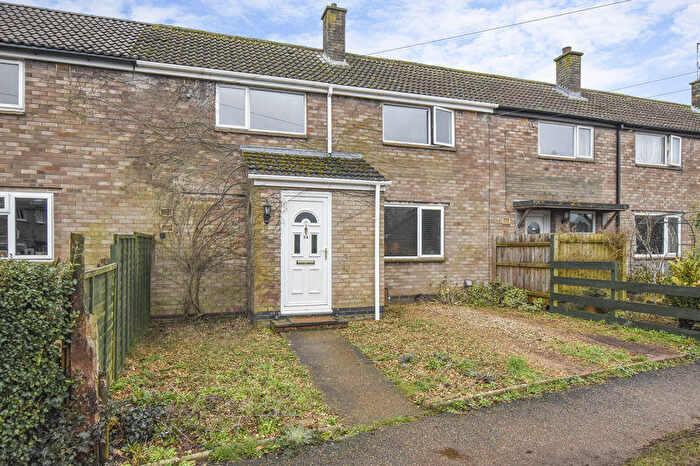
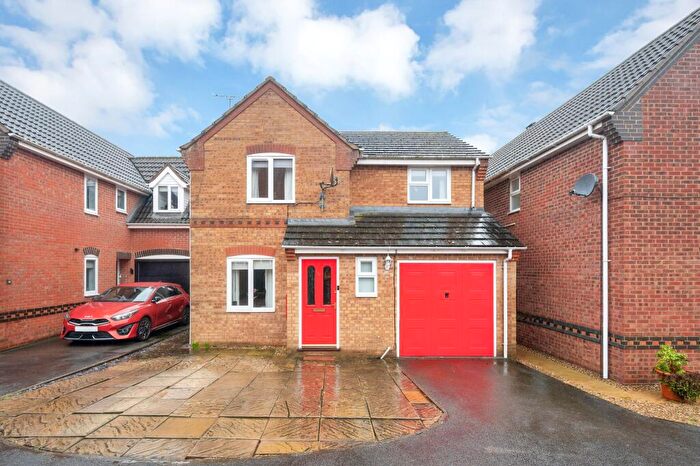
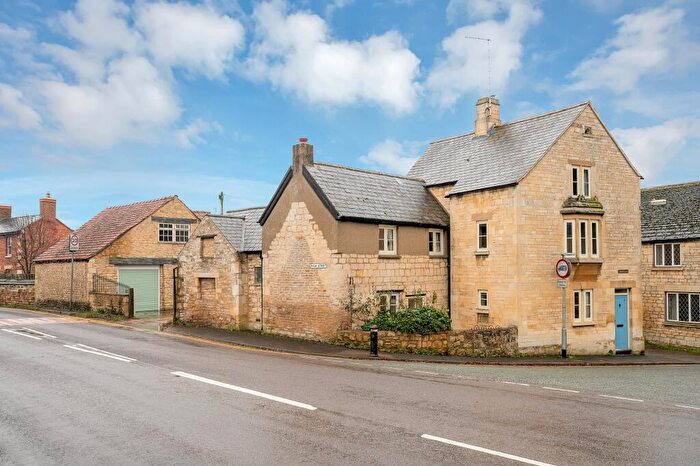
Properties for sale in Ketton
Roads and Postcodes in Ketton
Navigate through our locations to find the location of your next house in Ketton, Stamford for sale or to rent.
| Streets | Postcodes |
|---|---|
| Aldgate | PE9 3TD |
| Aldgate Court | PE9 3AY |
| Aveland Road | PE9 3SH |
| Barrowden Road | PE9 3RJ PE9 3RL |
| Bartles Hollow | PE9 3SF |
| Braithwaite Close | PE9 3SP |
| Bull Lane | PE9 3TB |
| Burnhams Road | PE9 3SJ |
| Capendale Close | PE9 3RU |
| Carver Court | PE9 3RT |
| Casterton Lane | PE9 3UQ |
| Chapel Lane | PE9 3RF |
| Chater Mews | PE9 3TN |
| Church Road | PE9 3RD |
| Coronation Villas | PE9 3UF |
| Council Houses | PE9 3UE |
| Edmunds Drive | PE9 3TH |
| Empingham Road | PE9 3RP PE9 3UH PE9 3UL |
| Geeston Road | PE9 3RH |
| Grenehams Close | PE9 3SG |
| High Street | PE9 3TA PE9 3TE PE9 3TJ |
| Holme Close | PE9 3US |
| Holmes Drive | PE9 3YB |
| Hunts Lane | PE9 3TG |
| Ingthorpe | PE9 4AZ |
| Kelthorpe Close | PE9 3RS |
| Ketco Avenue | PE9 3SU |
| Luffenham Road | PE9 3RN |
| Main Street | PE9 3UD |
| Manor Green | PE9 3TL |
| Manor View | PE9 3TQ |
| Mill Lane | PE9 3UW PE9 3RE |
| North Luffenham Road | PE9 3UR |
| Northwick Road | PE9 3SA PE9 3SB PE9 3SD |
| Park Road | PE9 3SL |
| Pied Bull Close | PE9 3AX |
| Pinfold Gate | PE9 3TR |
| Pit Lane | PE9 3SZ PE9 3FL |
| Redmiles Lane | PE9 3RG |
| Sand Furrows | PE9 3SS |
| Sharpes Plain | PE9 3RZ |
| Spencers Road | PE9 3SE |
| Spinney Road | PE9 3SQ |
| Stamford Road | PE9 3ST |
| Station Road | PE9 3RQ |
| Steadfold Lane | PE9 3UN |
| Stocks Hill Lane | PE9 3TW |
| Stocks Hill Mews | PE9 3TF |
| Sulthorpe Road | PE9 3SN |
| The Crescent | PE9 3SY |
| The Green | PE9 3RA |
| The Long Barn Mews | PE9 3TP |
| The Paddocks | PE9 3UZ |
| Timbergate Road | PE9 3SW |
| Tixover Grange | PE9 3QN PE9 3QR |
| West End Villas | PE9 3UG |
| Wheatlands Close | PE9 3RX |
| Winston Close | PE9 3RW |
| Wotton Close | PE9 3DA |
| Wytchley Road | PE9 3SR |
| PE9 3QJ PE9 3QL PE9 3RB PE9 3UJ PE9 3SX |
Transport near Ketton
- FAQ
- Price Paid By Year
- Property Type Price
Frequently asked questions about Ketton
What is the average price for a property for sale in Ketton?
The average price for a property for sale in Ketton is £547,039. This amount is 18% higher than the average price in Stamford. There are 1,100 property listings for sale in Ketton.
What streets have the most expensive properties for sale in Ketton?
The streets with the most expensive properties for sale in Ketton are Redmiles Lane at an average of £1,035,000, Mill Lane at an average of £980,000 and Chapel Lane at an average of £900,000.
What streets have the most affordable properties for sale in Ketton?
The streets with the most affordable properties for sale in Ketton are Sharpes Plain at an average of £179,000, Tixover Grange at an average of £231,695 and Manor Green at an average of £234,166.
Which train stations are available in or near Ketton?
Some of the train stations available in or near Ketton are Stamford, Oakham and Corby.
Property Price Paid in Ketton by Year
The average sold property price by year was:
| Year | Average Sold Price | Price Change |
Sold Properties
|
|---|---|---|---|
| 2025 | £629,404 | 21% |
21 Properties |
| 2024 | £499,472 | -15% |
47 Properties |
| 2023 | £572,337 | 11% |
20 Properties |
| 2022 | £507,164 | -19% |
34 Properties |
| 2021 | £603,346 | 25% |
62 Properties |
| 2020 | £451,788 | 2% |
37 Properties |
| 2019 | £442,462 | 13% |
20 Properties |
| 2018 | £386,454 | -29% |
34 Properties |
| 2017 | £498,686 | 34% |
30 Properties |
| 2016 | £329,144 | 9% |
42 Properties |
| 2015 | £297,896 | -16% |
47 Properties |
| 2014 | £347,005 | 13% |
39 Properties |
| 2013 | £303,528 | -22% |
38 Properties |
| 2012 | £369,959 | 28% |
32 Properties |
| 2011 | £265,363 | -45% |
22 Properties |
| 2010 | £384,117 | 23% |
34 Properties |
| 2009 | £296,557 | 16% |
41 Properties |
| 2008 | £249,513 | -27% |
34 Properties |
| 2007 | £316,832 | 11% |
48 Properties |
| 2006 | £280,855 | -15% |
46 Properties |
| 2005 | £323,166 | 24% |
49 Properties |
| 2004 | £245,068 | 10% |
50 Properties |
| 2003 | £220,679 | 10% |
50 Properties |
| 2002 | £198,729 | 4% |
67 Properties |
| 2001 | £191,482 | 8% |
59 Properties |
| 2000 | £176,593 | 32% |
38 Properties |
| 1999 | £120,430 | 3% |
48 Properties |
| 1998 | £117,229 | 11% |
42 Properties |
| 1997 | £104,129 | 28% |
52 Properties |
| 1996 | £75,443 | -6% |
36 Properties |
| 1995 | £80,134 | - |
19 Properties |
Property Price per Property Type in Ketton
Here you can find historic sold price data in order to help with your property search.
The average Property Paid Price for specific property types in the last three years are:
| Property Type | Average Sold Price | Sold Properties |
|---|---|---|
| Semi Detached House | £446,684.00 | 19 Semi Detached Houses |
| Detached House | £683,189.00 | 50 Detached Houses |
| Terraced House | £298,558.00 | 17 Terraced Houses |
| Flat | £208,750.00 | 2 Flats |

