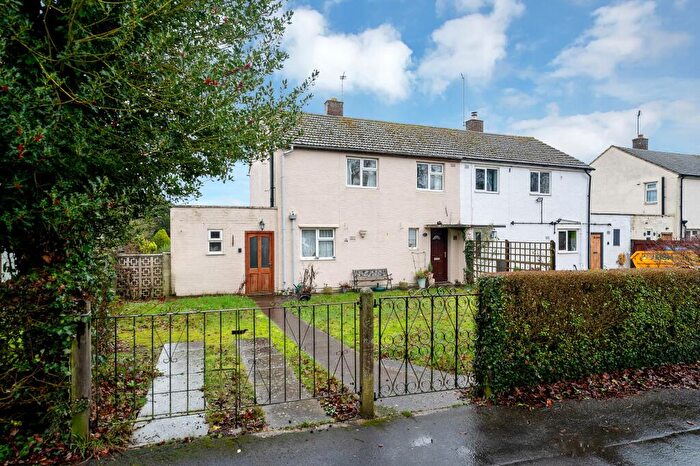
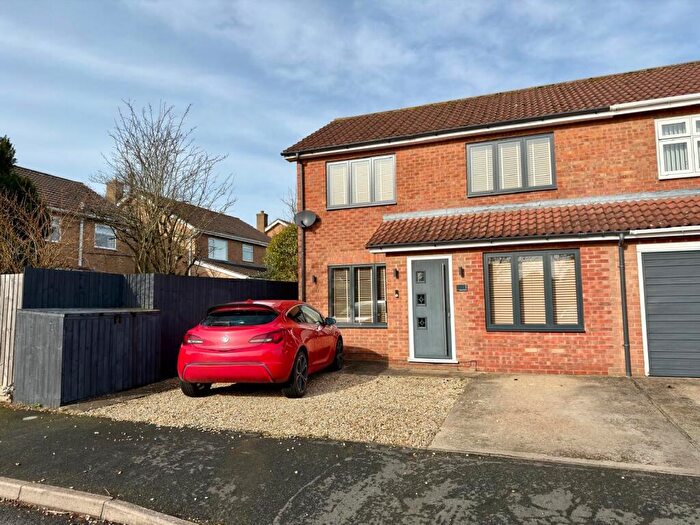
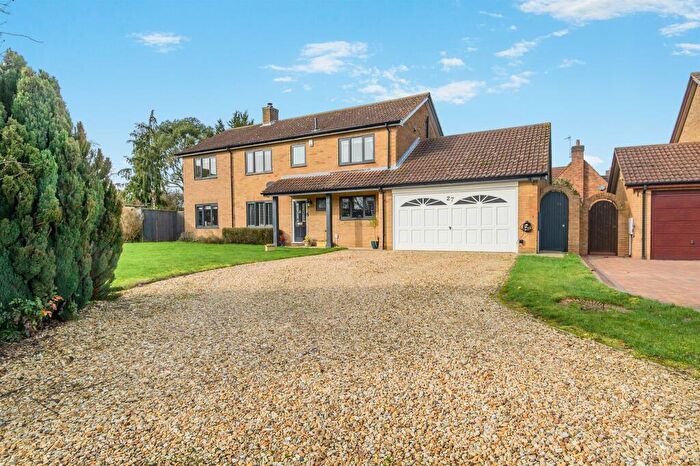
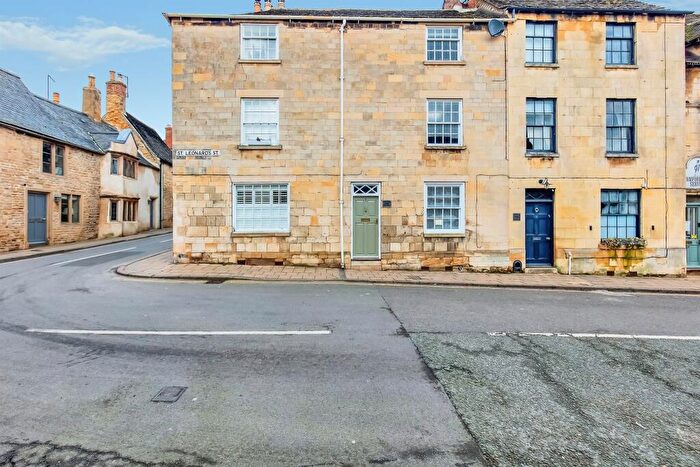
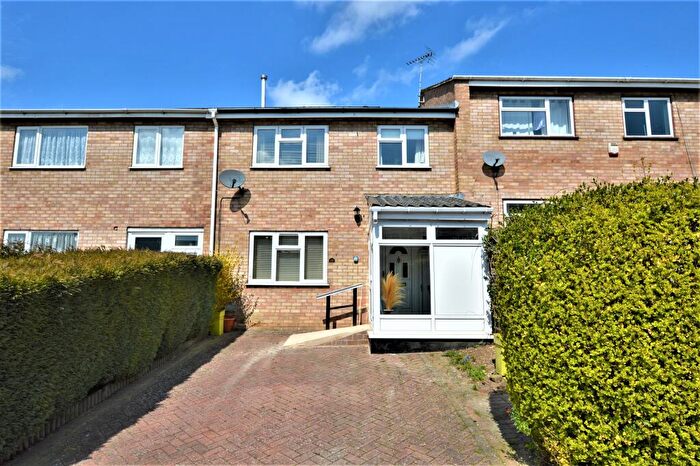
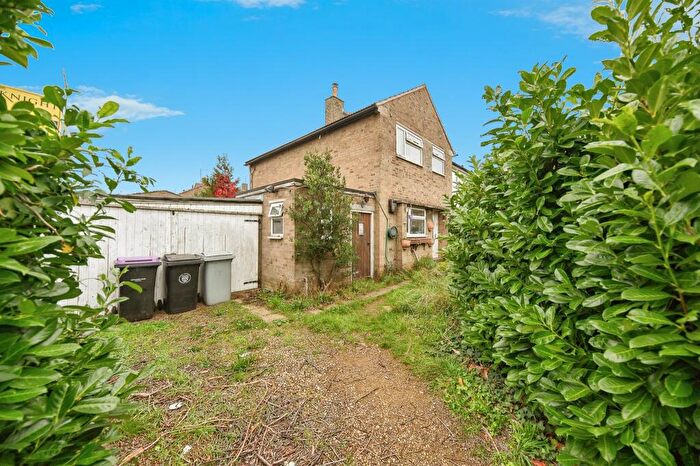
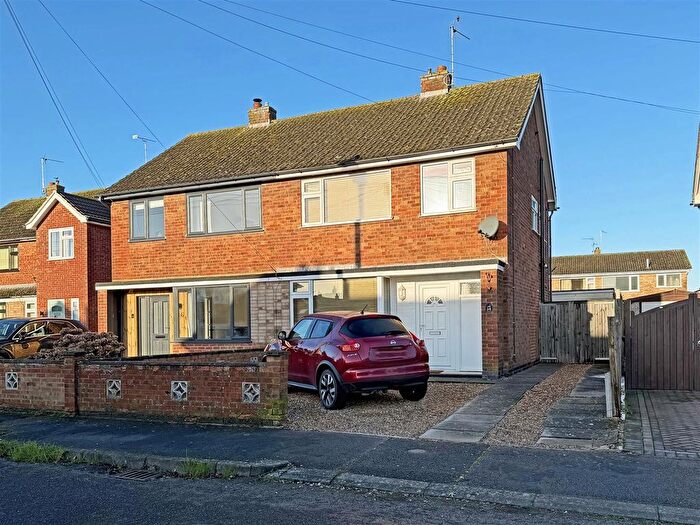
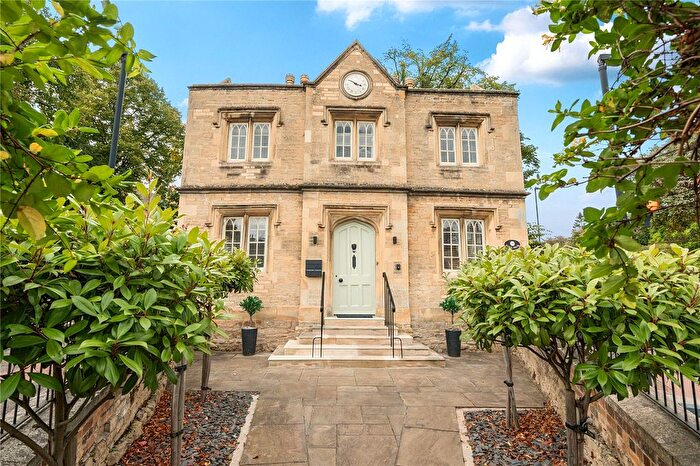
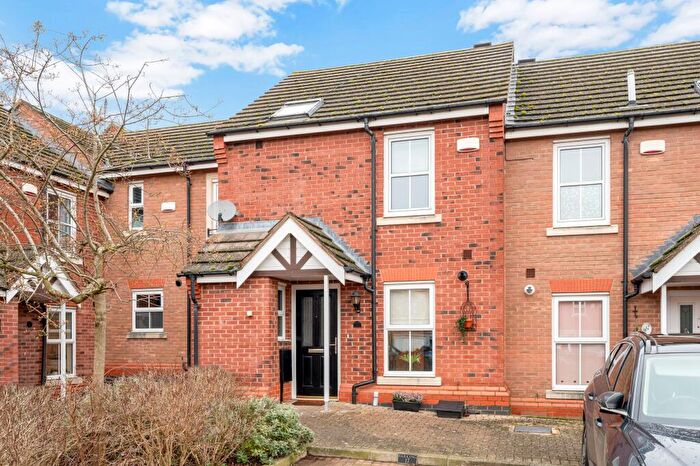
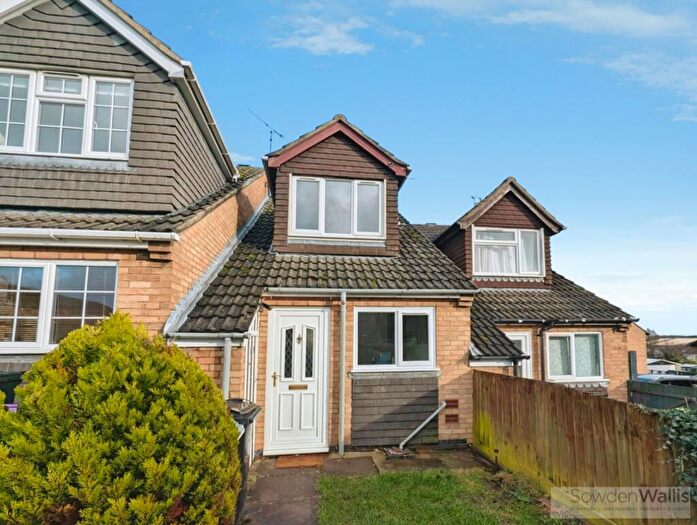
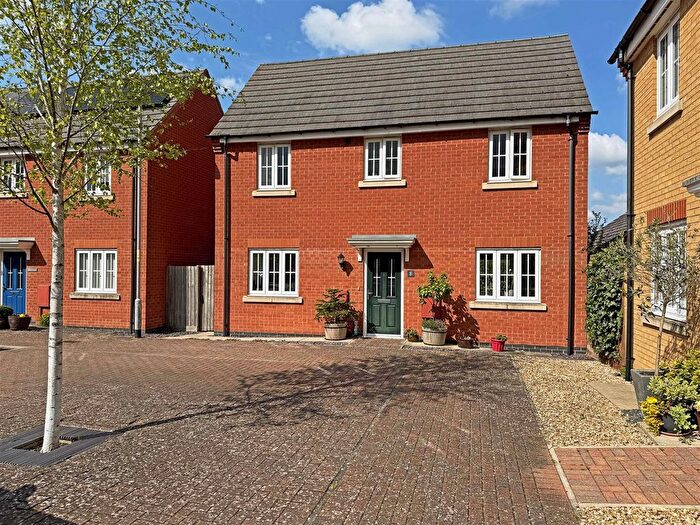
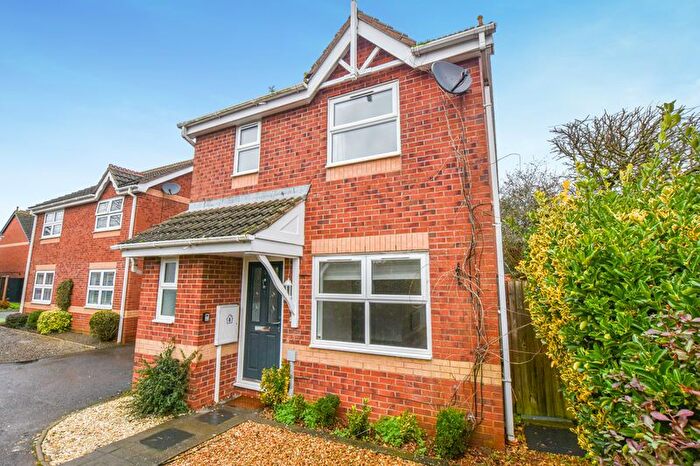
Houses for sale & to rent in Ryhall And Casterton, Stamford
House Prices in Ryhall And Casterton
Properties in Ryhall And Casterton have an average house price of £390,179.00 and had 102 Property Transactions within the last 3 years¹.
Ryhall And Casterton is an area in Stamford, Rutland with 1,099 households², where the most expensive property was sold for £950,000.00.
Properties for sale in Ryhall And Casterton
Roads and Postcodes in Ryhall And Casterton
Navigate through our locations to find the location of your next house in Ryhall And Casterton, Stamford for sale or to rent.
| Streets | Postcodes |
|---|---|
| Avocet Close | PE9 4UT |
| Balk Road | PE9 4HT |
| Beech Drive | PE9 4EW |
| Bourne Road | PE9 4LH |
| Bridge Street | PE9 4HH |
| Burley Road | PE9 4EL |
| Castle Rise | PE9 4JL |
| Church Street | PE9 4HP PE9 4HR PE9 4HW |
| College Close | PE9 4AW |
| Coppice Road | PE9 4HY |
| Crown Street | PE9 4HQ |
| Dunlin Road | PE9 4UU |
| Ermine Rise | PE9 4AJ |
| Essendine Road | PE9 4HE PE9 4JN |
| Flint Close | PE9 4JS |
| Foundry Road | PE9 4JA |
| Glen Crescent | PE9 4LP |
| Gwash Close | PE9 4NZ |
| High Crescent | PE9 4AY |
| Highlands | PE9 4HN |
| Home Farm Close | PE9 4AN |
| Lea View | PE9 4HZ |
| Main Street | PE9 4AA PE9 4AP PE9 4JQ |
| Mallard Close | PE9 4UP |
| Manor Close | PE9 4JB |
| Manor Farm Lane | PE9 4LA |
| Meadow Lane | PE9 4EP |
| Mill Street | PE9 4HF PE9 4HG |
| New Road | PE9 4HL |
| Parker Close | PE9 2NN |
| Parkfield Road | PE9 4ER |
| Pickworth Road | PE9 4AU |
| Plover Road | PE9 4UR |
| Post Office Lane | PE9 4JP |
| Rutland Way | PE9 4ET |
| Ryhall Road | PE9 4AR |
| Shepherds Walk | PE9 4JG |
| Spinney Lane | PE9 4HU |
| St Johns Close | PE9 4HS |
| St Tibba Way | PE9 4EN |
| Stamford Road | PE9 4HB PE9 4LG PE9 4LQ |
| Station Road | PE9 4LF |
| The Crescent | PE9 4JE |
| The Drift | PE9 4EF |
| The Square | PE9 4HJ |
| Toll Bar | PE9 4BA PE9 4BB |
| Turnpike Road | PE9 4HD |
| Waterside | PE9 4EY |
| West View | PE9 4AB |
| Windyridge Pickworth Road | PE9 4AX |
| PE9 4AE PE9 4BE PE9 4BH |
Transport near Ryhall And Casterton
- FAQ
- Price Paid By Year
- Property Type Price
Frequently asked questions about Ryhall And Casterton
What is the average price for a property for sale in Ryhall And Casterton?
The average price for a property for sale in Ryhall And Casterton is £390,179. This amount is 16% lower than the average price in Stamford. There are 2,236 property listings for sale in Ryhall And Casterton.
What streets have the most expensive properties for sale in Ryhall And Casterton?
The streets with the most expensive properties for sale in Ryhall And Casterton are Home Farm Close at an average of £687,500, Ryhall Road at an average of £657,000 and Main Street at an average of £564,228.
What streets have the most affordable properties for sale in Ryhall And Casterton?
The streets with the most affordable properties for sale in Ryhall And Casterton are Plover Road at an average of £227,000, High Crescent at an average of £235,000 and Coppice Road at an average of £245,035.
Which train stations are available in or near Ryhall And Casterton?
Some of the train stations available in or near Ryhall And Casterton are Stamford, Oakham and Peterborough.
Property Price Paid in Ryhall And Casterton by Year
The average sold property price by year was:
| Year | Average Sold Price | Price Change |
Sold Properties
|
|---|---|---|---|
| 2025 | £392,111 | 0,3% |
38 Properties |
| 2024 | £390,831 | 1% |
33 Properties |
| 2023 | £387,116 | -3% |
31 Properties |
| 2022 | £397,805 | -6% |
40 Properties |
| 2021 | £421,928 | 27% |
58 Properties |
| 2020 | £309,535 | -14% |
35 Properties |
| 2019 | £354,336 | 19% |
43 Properties |
| 2018 | £285,492 | -10% |
41 Properties |
| 2017 | £315,254 | 4% |
43 Properties |
| 2016 | £304,012 | 6% |
41 Properties |
| 2015 | £286,275 | 2% |
39 Properties |
| 2014 | £279,307 | 13% |
54 Properties |
| 2013 | £244,091 | -9% |
49 Properties |
| 2012 | £266,639 | 19% |
32 Properties |
| 2011 | £215,952 | -18% |
32 Properties |
| 2010 | £254,346 | 4% |
32 Properties |
| 2009 | £244,553 | -28% |
45 Properties |
| 2008 | £312,058 | 3% |
30 Properties |
| 2007 | £302,577 | 29% |
43 Properties |
| 2006 | £214,196 | -0,4% |
65 Properties |
| 2005 | £215,020 | -1% |
64 Properties |
| 2004 | £217,437 | 28% |
53 Properties |
| 2003 | £156,893 | 1% |
43 Properties |
| 2002 | £154,892 | 14% |
69 Properties |
| 2001 | £133,564 | 18% |
59 Properties |
| 2000 | £109,810 | 16% |
69 Properties |
| 1999 | £92,145 | 3% |
67 Properties |
| 1998 | £89,013 | 11% |
37 Properties |
| 1997 | £79,540 | 1% |
51 Properties |
| 1996 | £78,890 | -3% |
51 Properties |
| 1995 | £81,484 | - |
43 Properties |
Property Price per Property Type in Ryhall And Casterton
Here you can find historic sold price data in order to help with your property search.
The average Property Paid Price for specific property types in the last three years are:
| Property Type | Average Sold Price | Sold Properties |
|---|---|---|
| Semi Detached House | £309,937.00 | 45 Semi Detached Houses |
| Detached House | £496,676.00 | 43 Detached Houses |
| Terraced House | £321,000.00 | 14 Terraced Houses |

