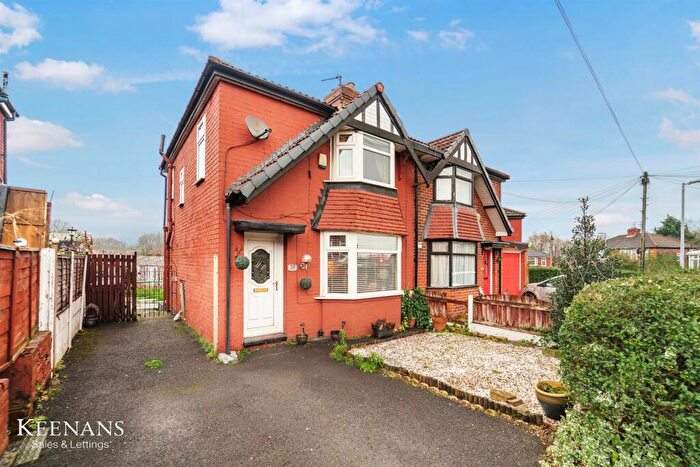
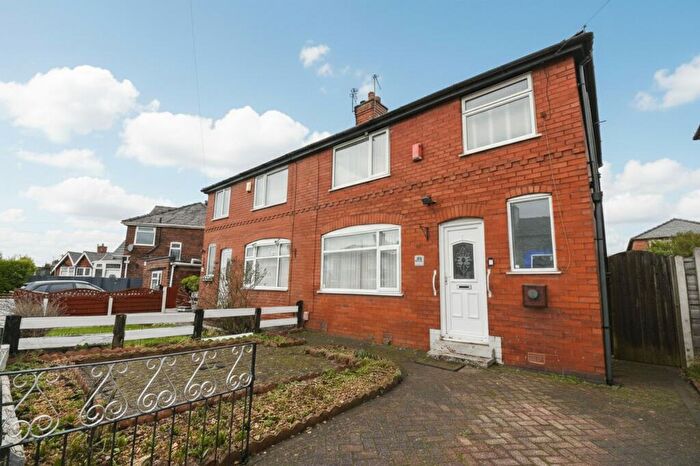
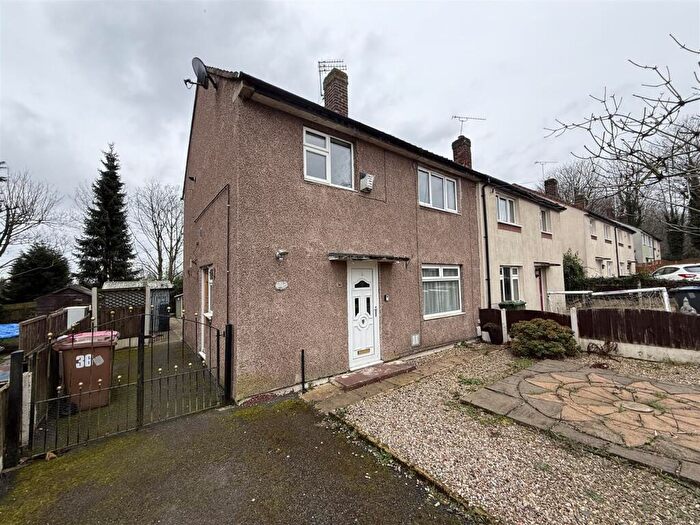
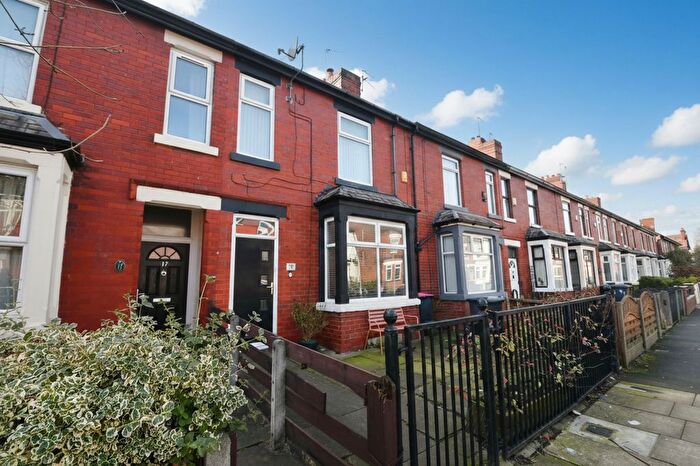
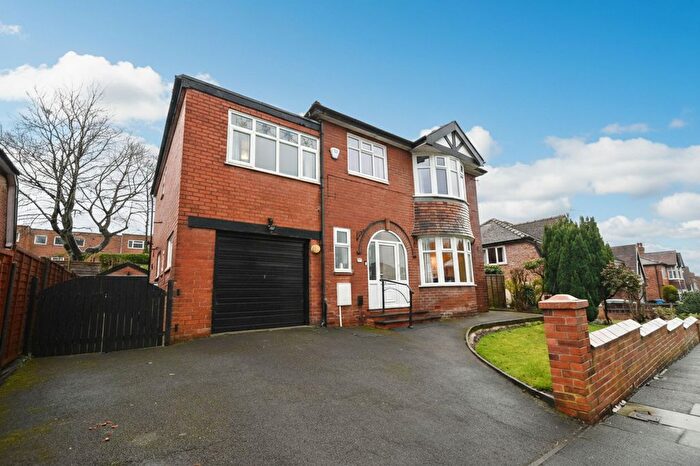
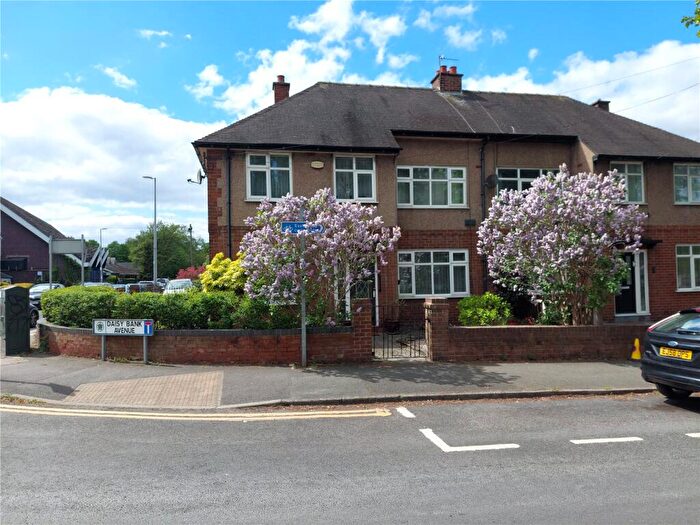
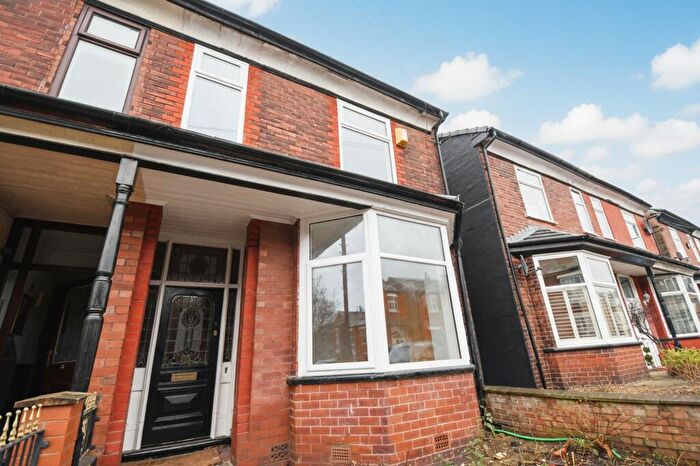
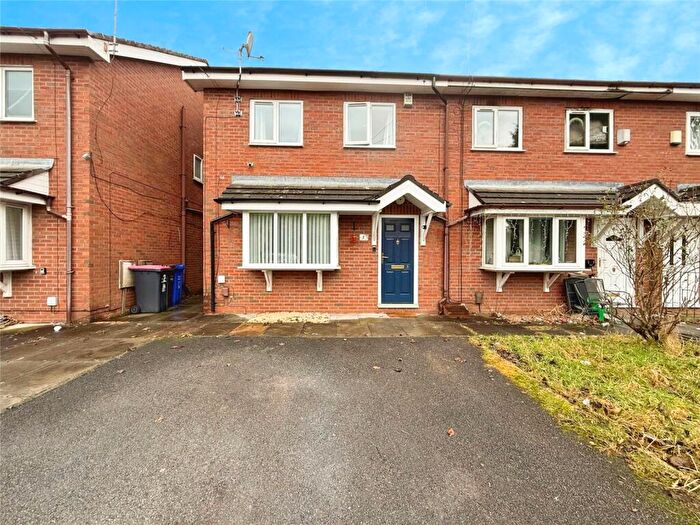
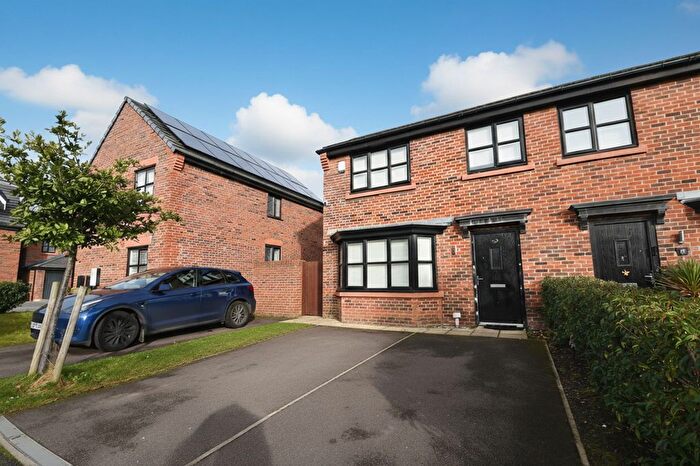
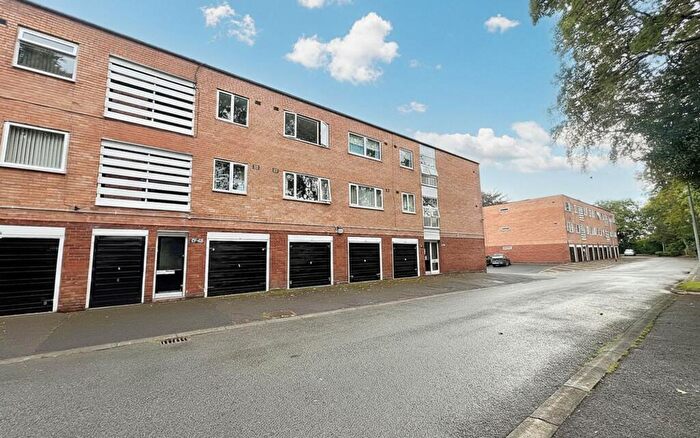
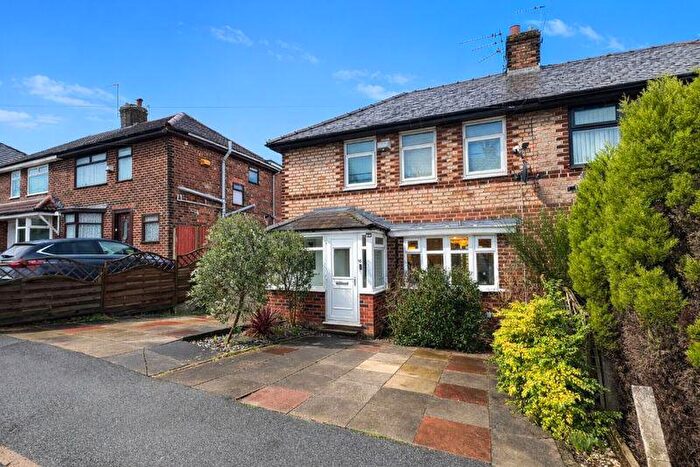
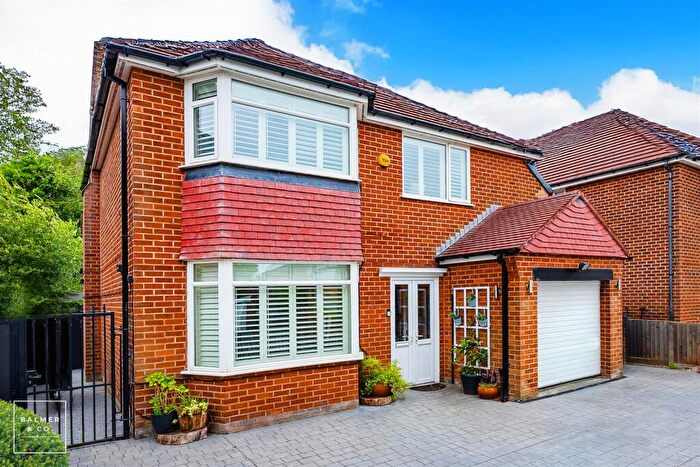
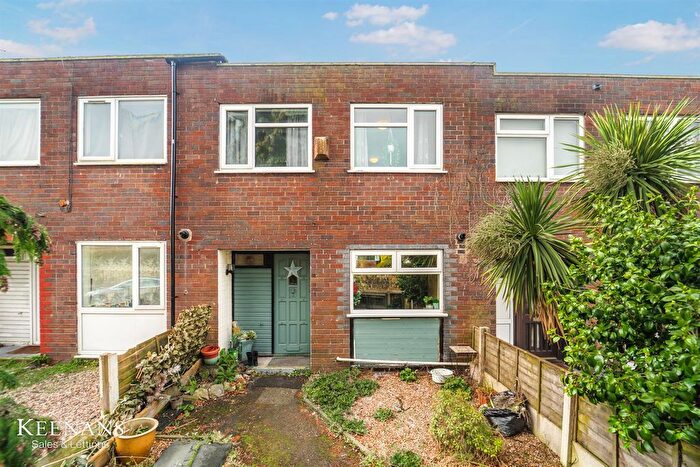
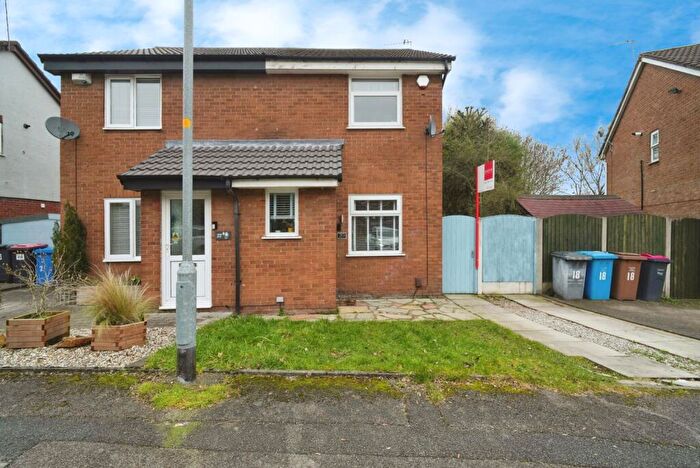
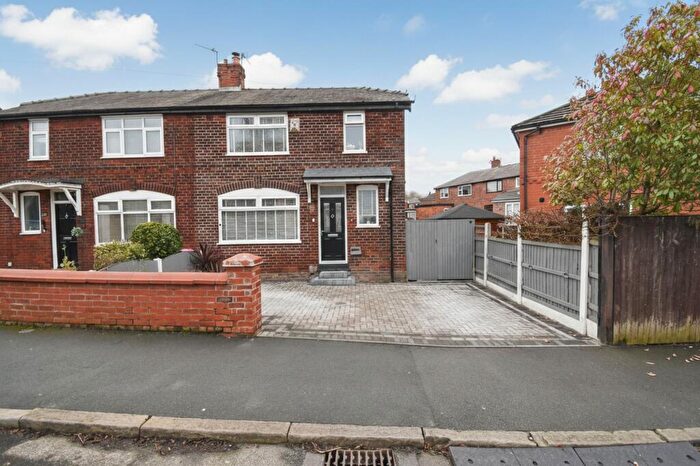
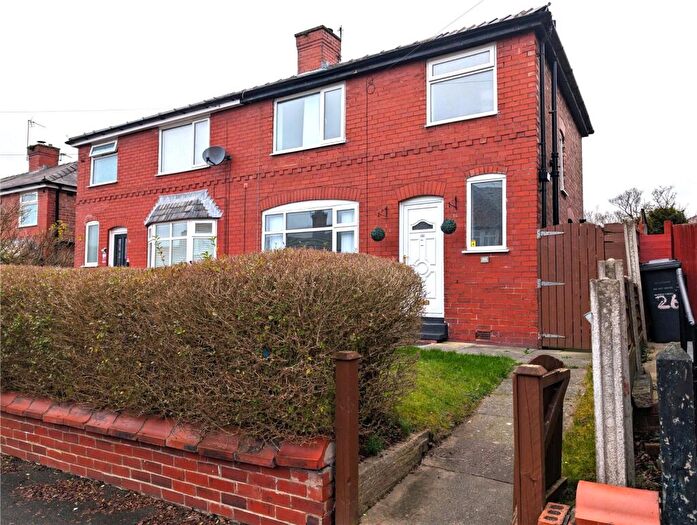
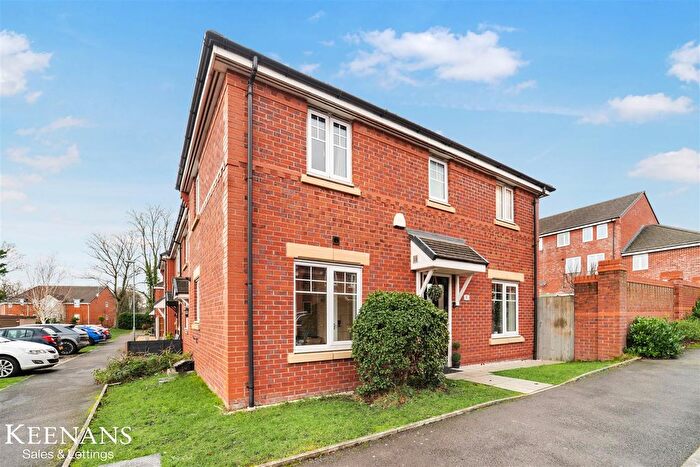
Houses for sale & to rent in Claremont, Manchester
House Prices in Claremont
Properties in Claremont have an average house price of £263,103.00 and had 102 Property Transactions within the last 3 years¹.
Claremont is an area in Manchester, Salford with 969 households², where the most expensive property was sold for £620,000.00.
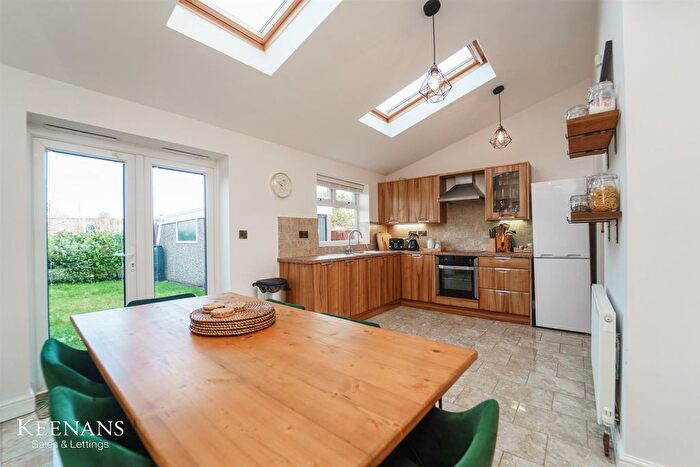
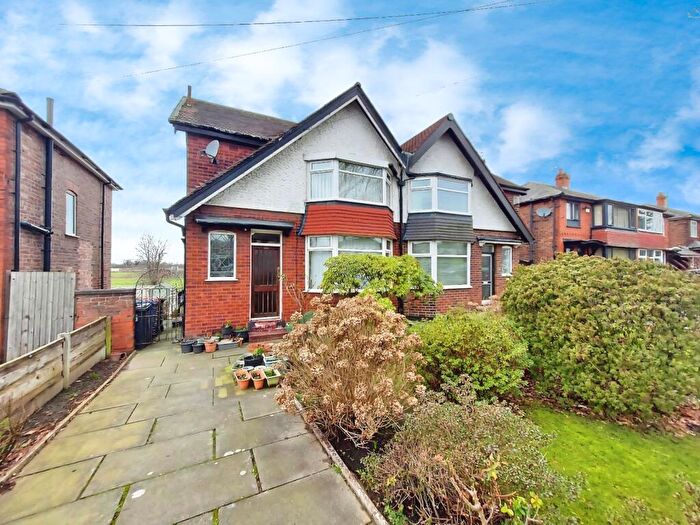
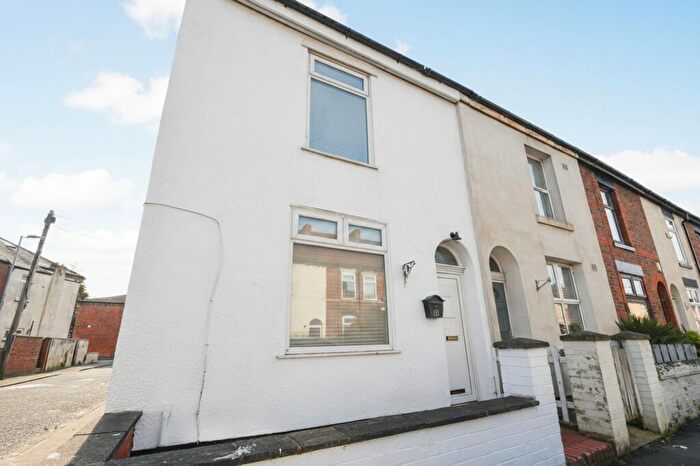
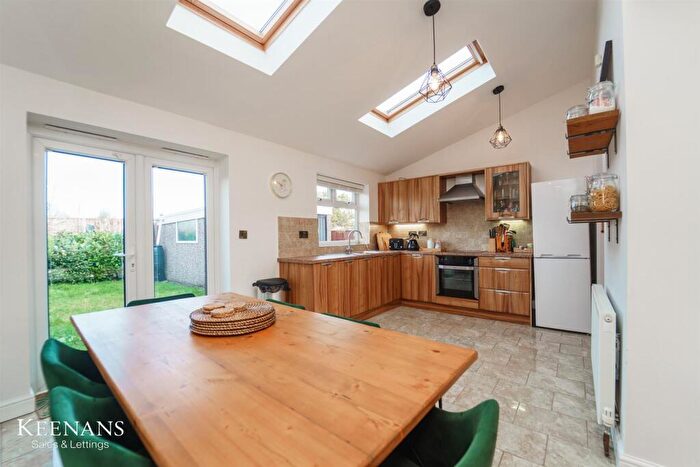
Properties for sale in Claremont
Roads and Postcodes in Claremont
Navigate through our locations to find the location of your next house in Claremont, Manchester for sale or to rent.
| Streets | Postcodes |
|---|---|
| Beverley Road | M27 4HY M27 4HZ |
| Blantyre Road | M27 5ER |
| Bolton Road | M27 8UP M27 8UZ M27 8XA M27 8XB |
| Cliftonville Drive | M27 5NA |
| Craignair Court | M27 4EW |
| Cranford Close | M27 5LZ |
| Daisy Bank Avenue | M27 5FU |
| Danesway | M27 4JG M27 4JQ M27 4JS |
| East Lancashire Road | M27 5LX M27 5LY |
| Fairway | M27 4JD |
| Hawthorn Drive | M27 4HR |
| Highfield Drive | M27 4JE M27 4JR |
| Holden Drive | M27 4FR |
| Hospital Road | M27 4EX |
| Kingsway | M27 4JU M27 4JW M27 4JX |
| Manchester Road | M27 5ET M27 5EX M27 5FG M27 5FX |
| May Road | M27 5FR M27 5FS |
| Newlands Drive | M27 4JY |
| Osborne Drive | M27 4HT |
| Parkstone Drive | M27 5NB |
| Parksway | M27 4JF M27 4JL M27 4JN |
| Ranelagh Road | M27 4HG M27 4HQ |
| Redcar Road | M27 4HS |
| Rothesay Road | M27 4HU |
| Runnymeade | M27 5WA |
| Shirley Avenue | M27 4HX |
| Sillavan Close | M27 4FS |
| Silver Birch Grove | M27 5FZ |
| Springwood Avenue | M27 5EA |
| St Austells Drive | M27 4JH |
| Stancliffe Drive | M27 4FU |
| The Westlands | M27 5FT |
| Torrington Road | M27 5ES |
| Waverley Road | M27 4JA M27 4JB |
| Westwood Drive | M27 4JJ M27 4JP |
| Wilton Avenue | M27 4JT |
| Wrigley Avenue | M27 4FT |
Transport near Claremont
-
Swinton (Greater Manchester) Station
-
Clifton Station
-
Eccles Station
-
Moorside Station
-
Salford Crescent Station
-
Patricroft Station
-
Salford Central Station
- FAQ
- Price Paid By Year
- Property Type Price
Frequently asked questions about Claremont
What is the average price for a property for sale in Claremont?
The average price for a property for sale in Claremont is £263,103. This amount is 7% higher than the average price in Manchester. There are 1,634 property listings for sale in Claremont.
What streets have the most expensive properties for sale in Claremont?
The streets with the most expensive properties for sale in Claremont are The Westlands at an average of £476,166, May Road at an average of £355,000 and Newlands Drive at an average of £350,000.
What streets have the most affordable properties for sale in Claremont?
The streets with the most affordable properties for sale in Claremont are Craignair Court at an average of £105,250, Bolton Road at an average of £160,666 and Waverley Road at an average of £210,250.
Which train stations are available in or near Claremont?
Some of the train stations available in or near Claremont are Swinton (Greater Manchester), Clifton and Eccles.
Property Price Paid in Claremont by Year
The average sold property price by year was:
| Year | Average Sold Price | Price Change |
Sold Properties
|
|---|---|---|---|
| 2025 | £270,108 | -1% |
23 Properties |
| 2024 | £272,112 | 7% |
36 Properties |
| 2023 | £251,813 | -9% |
43 Properties |
| 2022 | £273,627 | 18% |
44 Properties |
| 2021 | £223,287 | 13% |
66 Properties |
| 2020 | £194,090 | -6% |
41 Properties |
| 2019 | £206,562 | 4% |
41 Properties |
| 2018 | £197,899 | 6% |
58 Properties |
| 2017 | £185,599 | 7% |
53 Properties |
| 2016 | £172,807 | -9% |
59 Properties |
| 2015 | £188,552 | 13% |
39 Properties |
| 2014 | £163,781 | -3% |
75 Properties |
| 2013 | £168,628 | -6% |
85 Properties |
| 2012 | £179,120 | 27% |
54 Properties |
| 2011 | £130,748 | -7% |
35 Properties |
| 2010 | £139,338 | 9% |
25 Properties |
| 2009 | £127,176 | -6% |
18 Properties |
| 2008 | £135,354 | -6% |
16 Properties |
| 2007 | £143,506 | -2% |
51 Properties |
| 2006 | £146,806 | 9% |
43 Properties |
| 2005 | £133,920 | 9% |
37 Properties |
| 2004 | £121,560 | 11% |
44 Properties |
| 2003 | £107,663 | 15% |
47 Properties |
| 2002 | £91,762 | 26% |
47 Properties |
| 2001 | £67,988 | 12% |
50 Properties |
| 2000 | £59,725 | 2% |
54 Properties |
| 1999 | £58,769 | 13% |
57 Properties |
| 1998 | £50,911 | 10% |
52 Properties |
| 1997 | £45,881 | -17% |
30 Properties |
| 1996 | £53,462 | 16% |
42 Properties |
| 1995 | £44,710 | - |
27 Properties |
Property Price per Property Type in Claremont
Here you can find historic sold price data in order to help with your property search.
The average Property Paid Price for specific property types in the last three years are:
| Property Type | Average Sold Price | Sold Properties |
|---|---|---|
| Semi Detached House | £263,496.00 | 64 Semi Detached Houses |
| Detached House | £344,105.00 | 19 Detached Houses |
| Terraced House | £217,250.00 | 5 Terraced Houses |
| Flat | £167,750.00 | 14 Flats |

