
Houses for sale in Manchester, Salford
House Prices in Manchester
Properties in Manchester have an average house price of £246k and had 6,421 Property Transactions within the last 3 years.¹
Manchester is an area in Salford with 68,396 households², where the most expensive property was sold for £1.7M.
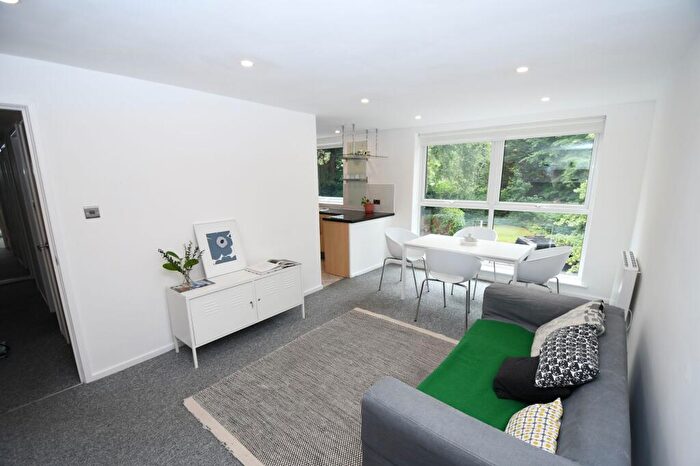
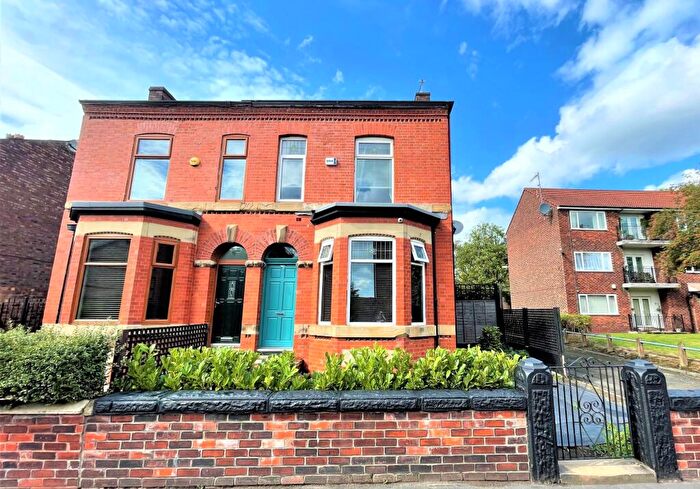
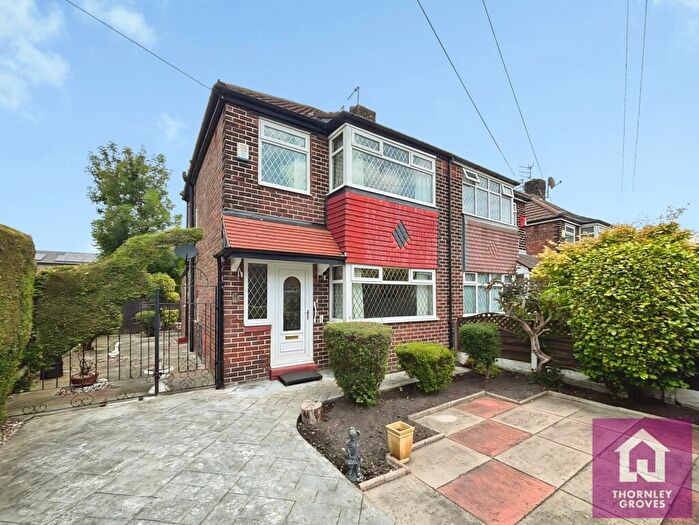
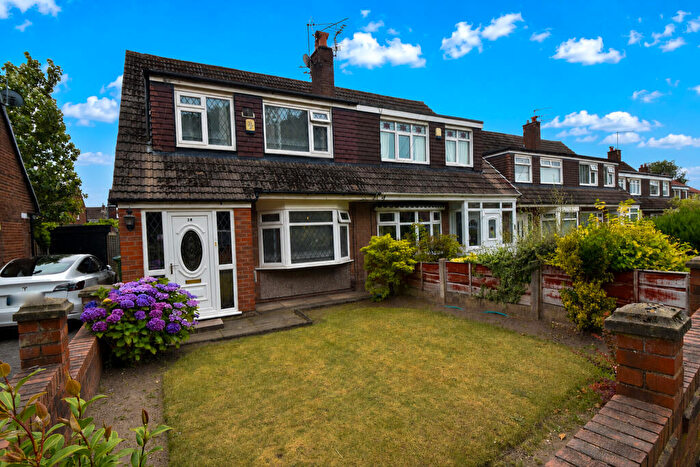
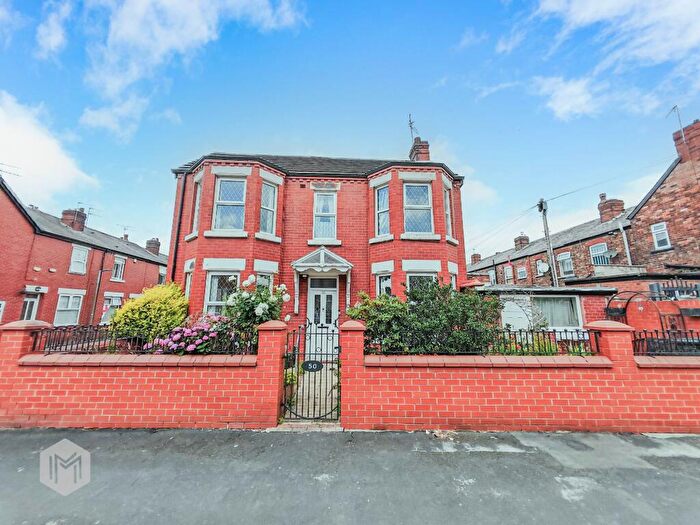
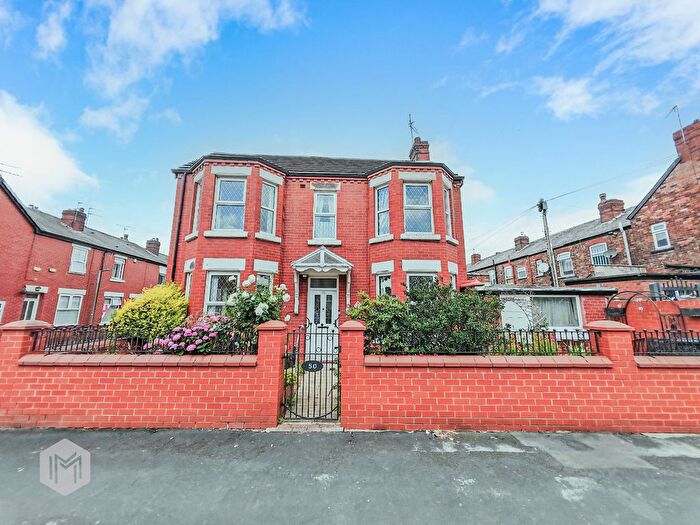
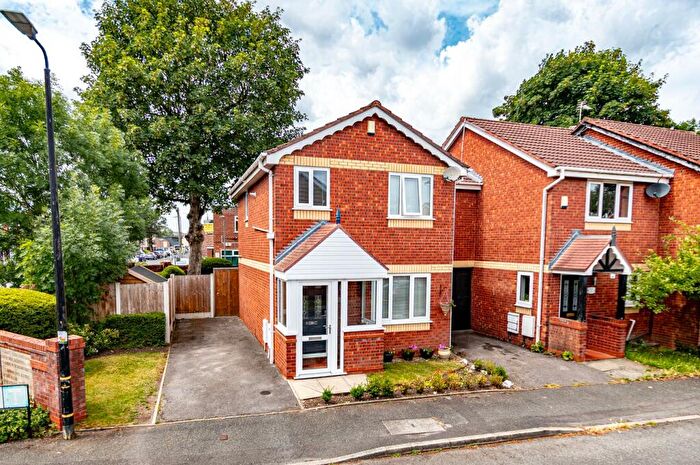
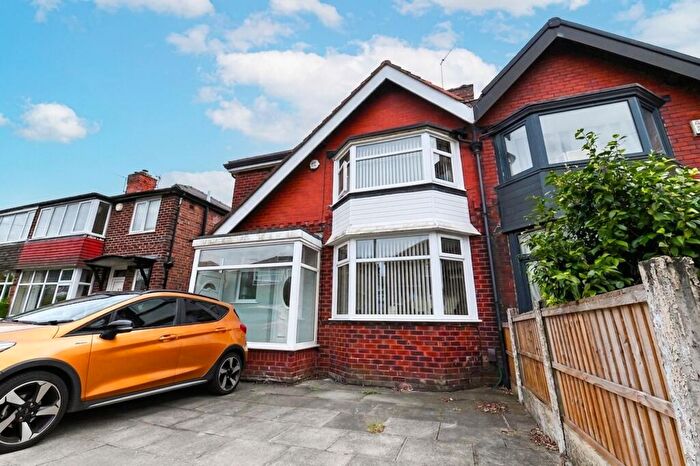
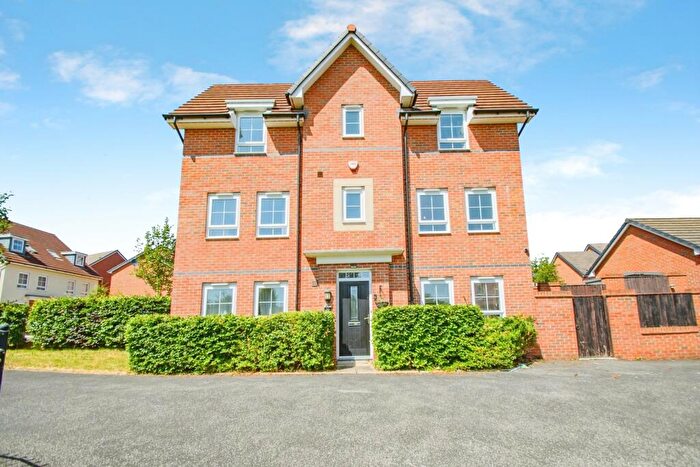
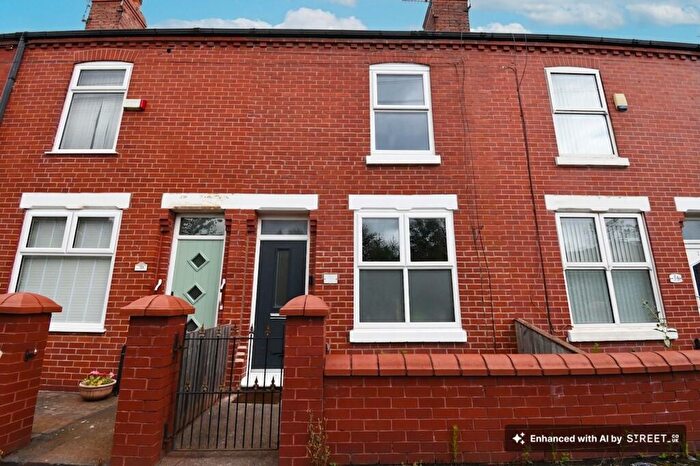
Properties for sale in Manchester
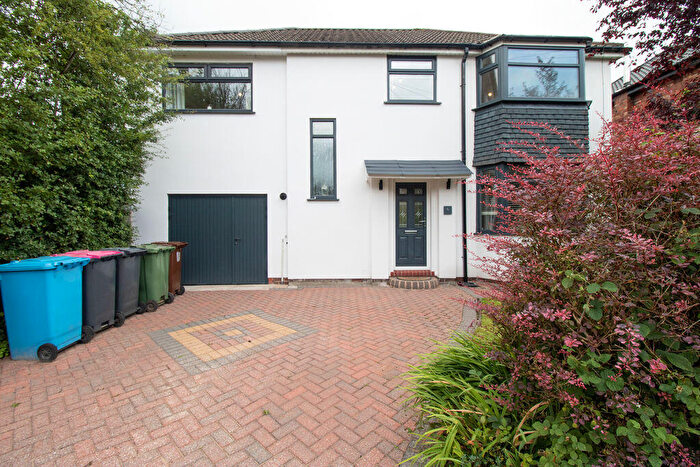
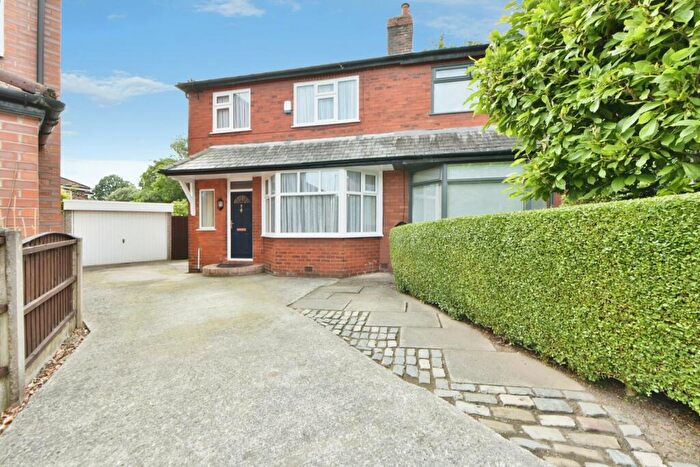
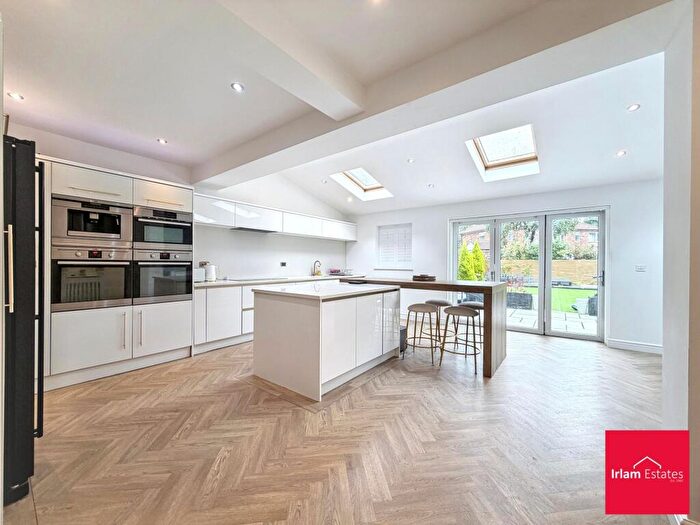
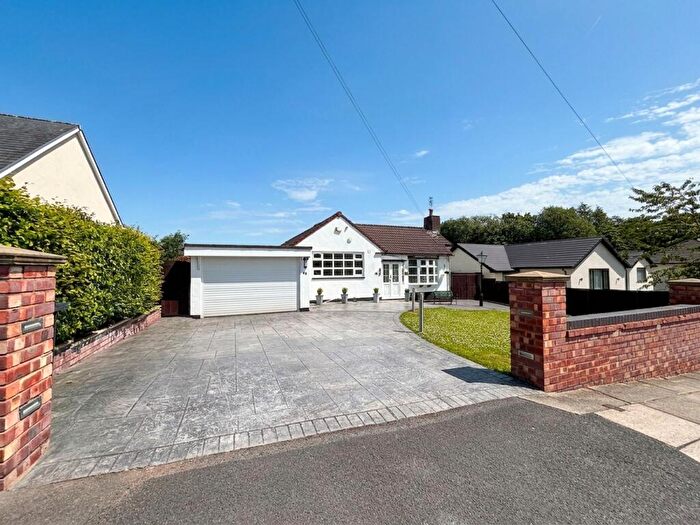
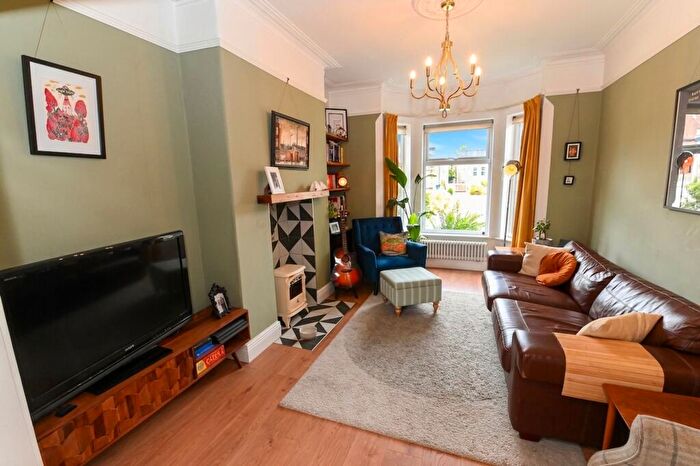
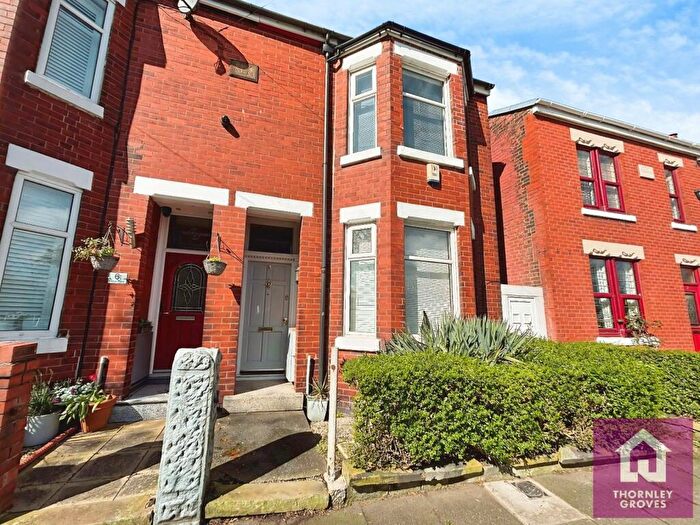
![]()
If you are looking to sell your house, let it out, or receive a property valuation, an expert can help you.
Click the button below to get started.
Neighbourhoods in Manchester
Navigate through our locations to find the location of your next house in Manchester, Salford for sale or to rent.
- Barton
- Boothstown And Ellenbrook
- Broughton
- Cadishead
- Claremont
- Eccles
- Irlam
- Irwell Riverside
- Kersal
- Little Hulton
- Pendlebury
- Swinton North
- Swinton South
- Walkden North
- Walkden South
- Weaste And Seedley
- Winton
- Worsley
- Worsley & Westwood Park
- Swinton & Wardley
- Swinton Park
- Pendlebury & Clifton
- Boothstown & Ellenbrook
- Weaste & Seedley
- Barton & Winton
- Higher Irlam & Peel Green
- Cadishead & Lower Irlam
- Blackfriars & Trinity
- Ordsall
Property price trends in Manchester
According to the latest Land Registry data, the average home in Manchester sold for £246,282 in 2026. That figure comes from a substantial record of 74,685 sales logged over the past 31 years.
Prices have moved up over the last three years. Compared with 2023, when the typical sale came in around £236,270, that's a rise of roughly 4.2%.
Looking back five years, average prices are up about 8.8% since 2021, a gain of around £19,948 in cash terms.
Zoom out to the past decade for the fuller picture. Back in 2016, homes here averaged £163,285, so the typical sold price has climbed about 50.8% since then, roughly 4.2% a year. Stretch the view to fifteen years and that annual pace holds at about 4.1%.
Frequently asked questions about Manchester
What is the average price for a property for sale in Manchester?
The average price for a property for sale in Manchester is £246,409. This amount is 4% higher than the average price in Salford. There are more than 10,000 property listings for sale in Manchester.
What locations have the most expensive properties for sale in Manchester?
The locations with the most expensive properties for sale in Manchester are Boothstown & Ellenbrook at an average of £464,783, Worsley at an average of £382,070 and Worsley & Westwood Park at an average of £361,666.
What locations have the most affordable properties for sale in Manchester?
The locations with the most affordable properties for sale in Manchester are Swinton & Wardley at an average of £130,733, Irwell Riverside at an average of £159,500 and Cadishead & Lower Irlam at an average of £170,875.
Which train stations are available in or near Manchester?
Some of the train stations available in or near Manchester are Patricroft, Moorside and Walkden.
Property Price Paid in Manchester by Year
The average sold property price by year was:
| Year | Average Sold Price | Price Change |
Sold Properties
|
|---|---|---|---|
| 2026 | £246,282 | -4% |
126 Properties |
| 2025 | £256,210 | 4% |
2,106 Properties |
| 2024 | £246,319 | 4% |
2,174 Properties |
| 2023 | £236,270 | -6% |
2,015 Properties |
| 2022 | £249,597 | 9% |
2,498 Properties |
| 2021 | £226,334 | 10% |
2,997 Properties |
| 2020 | £202,748 | 7% |
2,298 Properties |
| 2019 | £188,833 | 3% |
2,586 Properties |
| 2018 | £182,331 | 3% |
2,759 Properties |
| 2017 | £177,034 | 8% |
2,853 Properties |
Property Price per Property Type in Manchester
Here you can find historic sold price data in order to help with your property search.
The average Property Paid Price for specific property types in the last three years are:
| Property Type | Average Sold Price | Sold Properties |
|---|---|---|
| Semi Detached House | £263,112.00 | 2,685 Semi Detached Houses |
| Terraced House | £200,050.00 | 2,275 Terraced Houses |
| Detached House | £414,751.00 | 789 Detached Houses |
| Flat | £138,964.00 | 672 Flats |
Transport in Manchester
Please see below transportation links in this area:
