
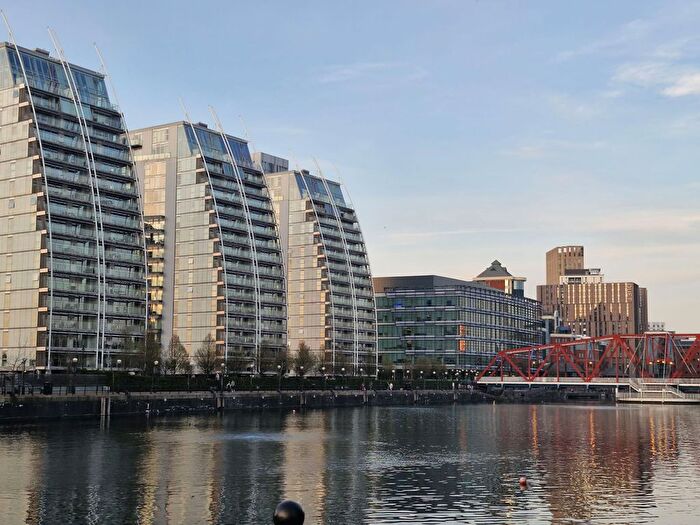
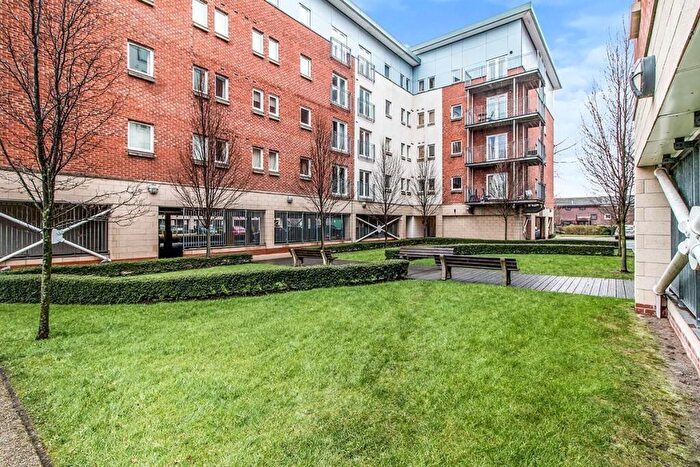
Houses for sale & to rent in Quays, Salford
House Prices in Quays
Properties in Quays have an average house price of £199k and had 312 Property Transactions within the last 3 years¹.
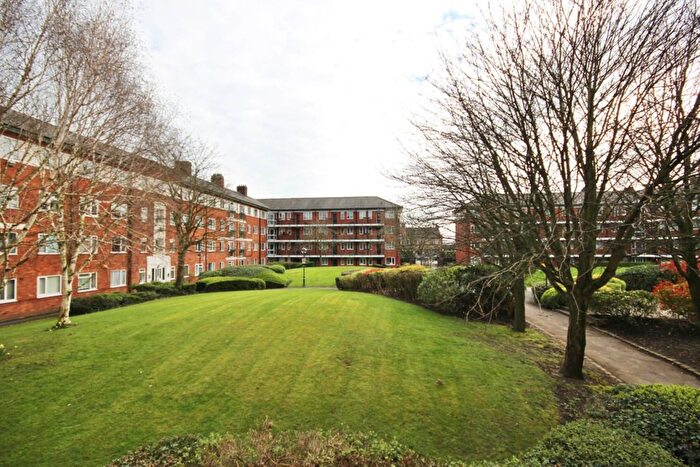
Quays is an area in Salford, Salford with 8 households², where the most expensive property was sold for £420k.
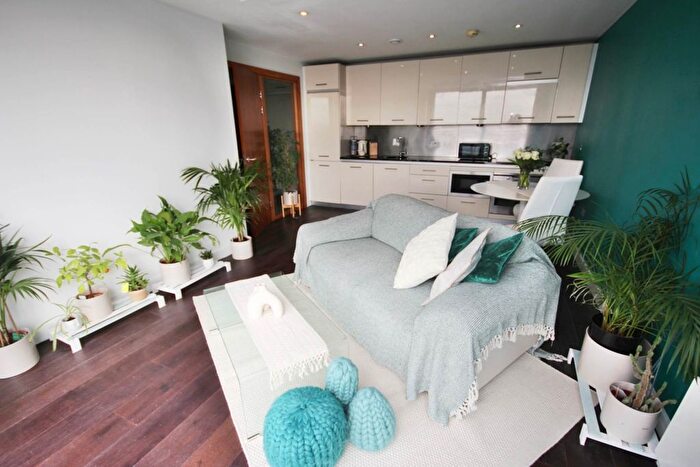
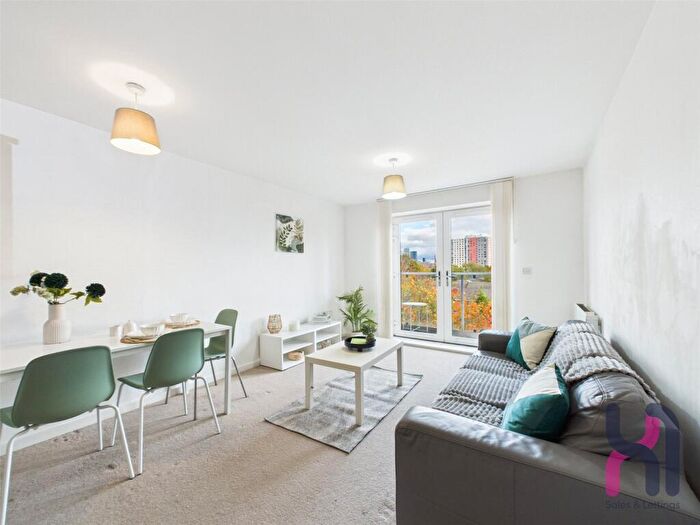
Properties for sale in Quays
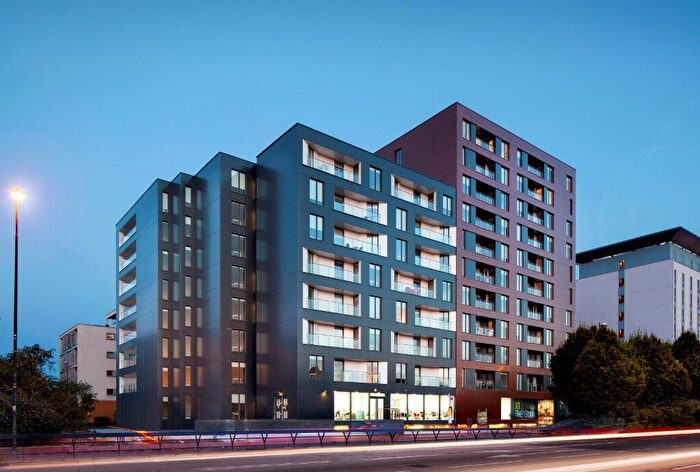
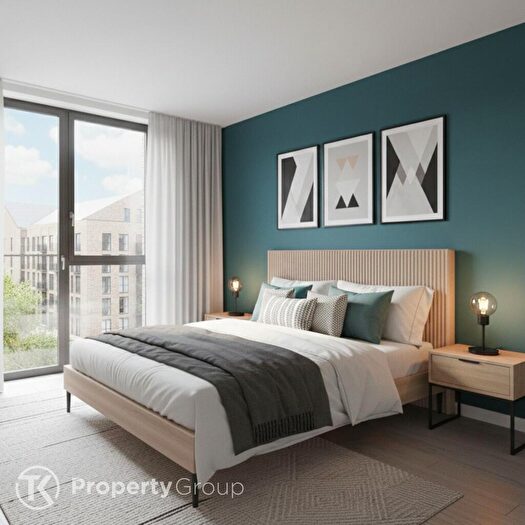

![]()
If you are looking to sell your house, let it out, or receive a property valuation, an expert can help you.
Click the button below to get started.
Roads and Postcodes in Quays
Navigate through our locations to find the location of your next house in Quays, Salford for sale or to rent.
Transport near Quays
-
 Manchester United Football Ground Station
 -
Salford Crescent Station
-
Deansgate Station
-
Salford Central Station
-
Trafford Park Station
-
Manchester Oxford Road Station
-
Manchester Victoria Station
-
Humphrey Park Station
-
Eccles Station
-
Manchester Piccadilly Station
- FAQ
- Price Paid By Year
- Property Type Price
Frequently asked questions about Quays
What is the average price for a property for sale in Quays?
The average price for a property for sale in Quays is £198,763. This amount is 11% lower than the average price in Salford. There are 5,728 property listings for sale in Quays.
What streets have the most expensive properties for sale in Quays?
The streets with the most expensive properties for sale in Quays are Dyer Street at an average of £420,000, Ottinger Close at an average of £256,195 and Lowry Wharf at an average of £239,515.
What streets have the most affordable properties for sale in Quays?
The streets with the most affordable properties for sale in Quays are TRAFFORD ROAD at an average of £124,125, Elmira Way at an average of £148,422 and Michigan Avenue at an average of £155,240.
Which train stations are available in or near Quays?
Some of the train stations available in or near Quays are Manchester United Football Ground, Salford Crescent and Deansgate.
Property Price Paid in Quays by Year
The average sold property price by year was:
| Year | Average Sold Price | Price Change |
Sold Properties
|
|---|---|---|---|
| 2025 | £185,378 | -8% |
69 Properties |
| 2024 | £200,309 | -3% |
142 Properties |
| 2023 | £205,732 | 0,1% |
101 Properties |
| 2022 | £205,475 | 9% |
119 Properties |
| 2021 | £187,972 | -17% |
207 Properties |
| 2020 | £219,008 | 19% |
287 Properties |
| 2019 | £176,792 | 1% |
846 Properties |
| 2018 | £175,521 | 7% |
280 Properties |
| 2017 | £163,003 | 10% |
450 Properties |
| 2016 | £146,630 | -3% |
411 Properties |
| 2015 | £151,386 | -30% |
339 Properties |
| 2014 | £197,280 | 73% |
1 Property |
| 2009 | £54,144 | -823% |
1 Property |
| 2006 | £500,000 | 39% |
1 Property |
| 2005 | £307,500 | 74% |
2 Properties |
| 2003 | £79,000 | 34% |
1 Property |
| 1999 | £52,500 | -195% |
1 Property |
| 1998 | £155,100 | - |
1 Property |
Property Price per Property Type in Quays
Here you can find historic sold price data in order to help with your property search.
The average Property Paid Price for specific property types in the last three years are:
| Property Type | Average Sold Price | Sold Properties |
|---|---|---|
| Flat | £198,763.00 | 312 Flats |