
Houses for sale in Salford, Salford
House Prices in Salford
Properties in Salford have an average house price of £223k and had 4,099 Property Transactions within the last 3 years.¹
Salford is an area in Salford with 47,246 households², where the most expensive property was sold for £5.54M.
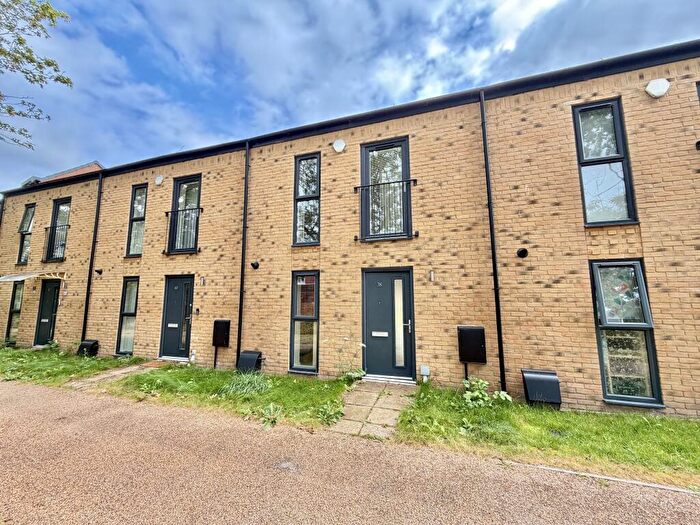
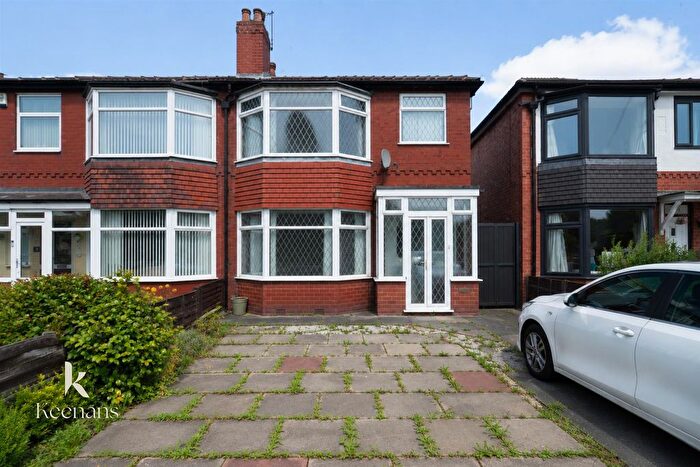
Properties for sale in Salford


![]()
If you are looking to sell your house, let it out, or receive a property valuation, an expert can help you.
Click the button below to get started.
Neighbourhoods in Salford
Navigate through our locations to find the location of your next house in Salford, Salford for sale or to rent.
Property price trends in Salford
According to the latest Land Registry data, the average home in Salford sold for £219,664 in 2026. That figure comes from a substantial record of 53,108 sales logged over the past 31 years.
Prices have moved up over the last three years. Compared with 2023, when the typical sale came in around £213,355, that's a rise of roughly 3%.
Looking back five years, average prices are up about 7.3% since 2021, a gain of around £14,970 in cash terms.
Zoom out to the past decade for the fuller picture. Back in 2016, homes here averaged £156,875, so the typical sold price has climbed about 40% since then, roughly 3.4% a year. Stretch the view to fifteen years and that annual pace edges up closer to 4.2%.
Frequently asked questions about Salford
What is the average price for a property for sale in Salford?
The average price for a property for sale in Salford is £223,279. This amount is 6% lower than the average price in Salford. There are more than 10,000 property listings for sale in Salford.
What locations have the most expensive properties for sale in Salford?
The locations with the most expensive properties for sale in Salford are Kersal & Broughton Park at an average of £391,769, Swinton South at an average of £351,000 and Kersal at an average of £297,821.
What locations have the most affordable properties for sale in Salford?
The locations with the most affordable properties for sale in Salford are Irwell Riverside at an average of £185,431, Ordsall at an average of £197,778 and Quays at an average of £198,231.
Which train stations are available in or near Salford?
Some of the train stations available in or near Salford are Salford Crescent, Salford Central and Manchester Victoria.
Property Price Paid in Salford by Year
The average sold property price by year was:
| Year | Average Sold Price | Price Change |
Sold Properties
|
|---|---|---|---|
| 2026 | £219,664 | -6% |
64 Properties |
| 2025 | £232,493 | 3% |
1,236 Properties |
| 2024 | £225,043 | 5% |
1,422 Properties |
| 2023 | £213,355 | -5% |
1,377 Properties |
| 2022 | £224,481 | 9% |
1,503 Properties |
| 2021 | £204,694 | -1% |
2,050 Properties |
| 2020 | £206,545 | 11% |
1,728 Properties |
| 2019 | £183,393 | 7% |
3,230 Properties |
| 2018 | £170,187 | 1% |
2,583 Properties |
| 2017 | £169,185 | 7% |
2,672 Properties |
Property Price per Property Type in Salford
Here you can find historic sold price data in order to help with your property search.
The average Property Paid Price for specific property types in the last three years are:
| Property Type | Average Sold Price | Sold Properties |
|---|---|---|
| Semi Detached House | £292,978.00 | 697 Semi Detached Houses |
| Terraced House | £235,056.00 | 1,164 Terraced Houses |
| Detached House | £466,173.00 | 144 Detached Houses |
| Flat | £176,830.00 | 2,094 Flats |
Transport in Salford
Please see below transportation links in this area:
