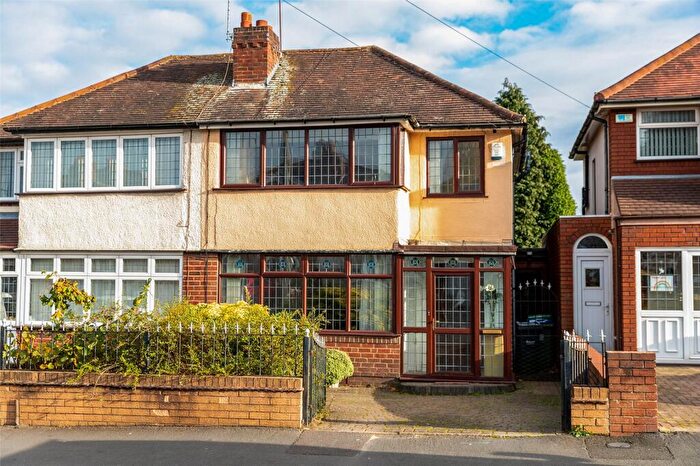
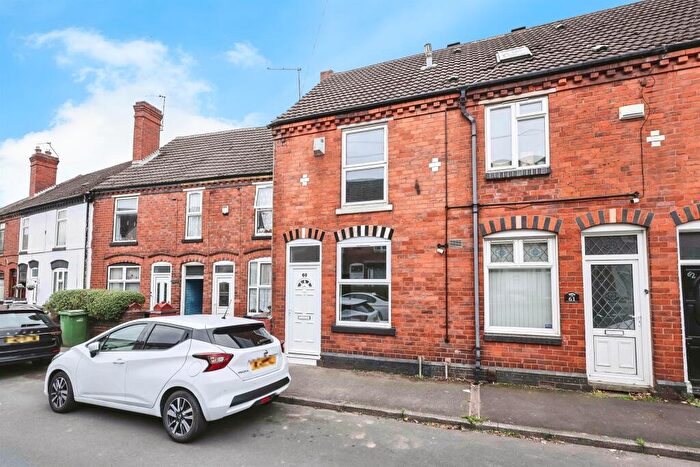
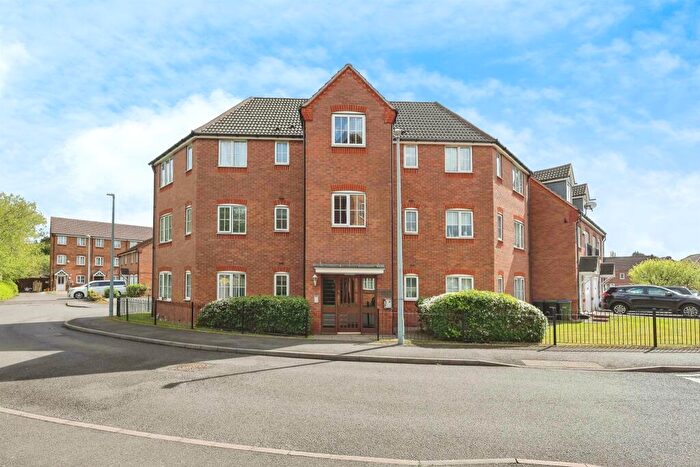
Houses for sale & to rent in Langley, Rowley Regis
House Prices in Langley
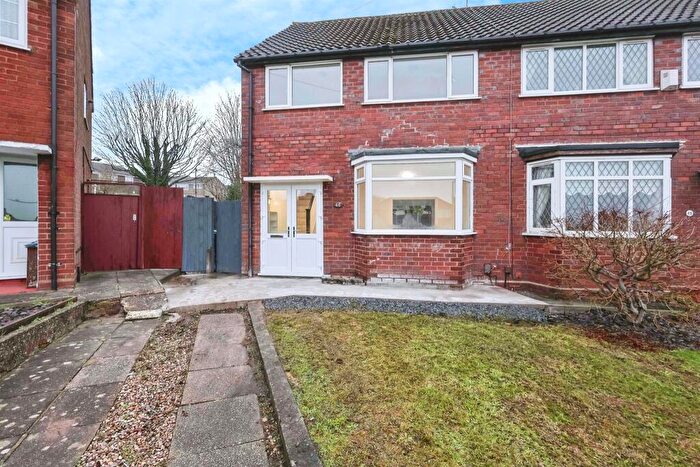
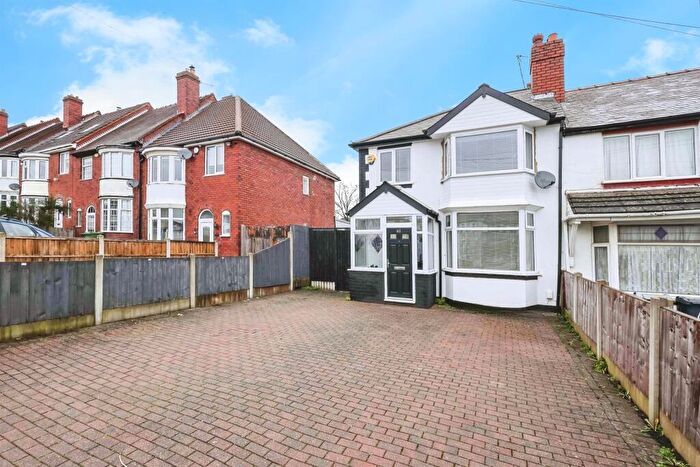
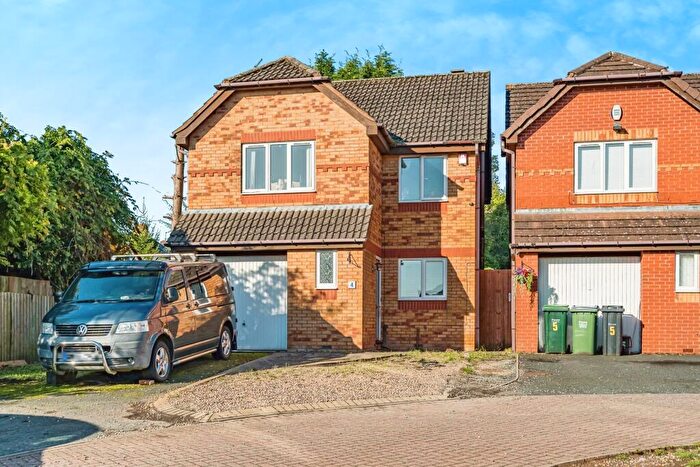
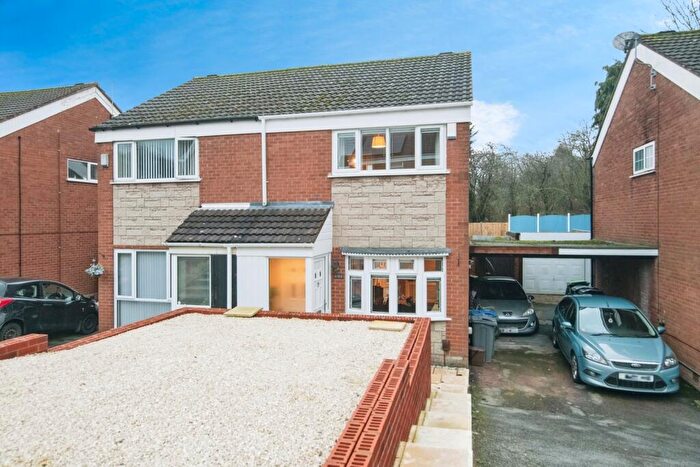
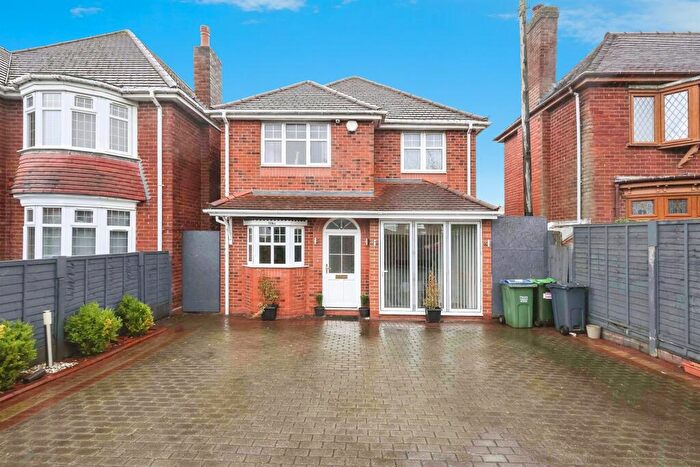
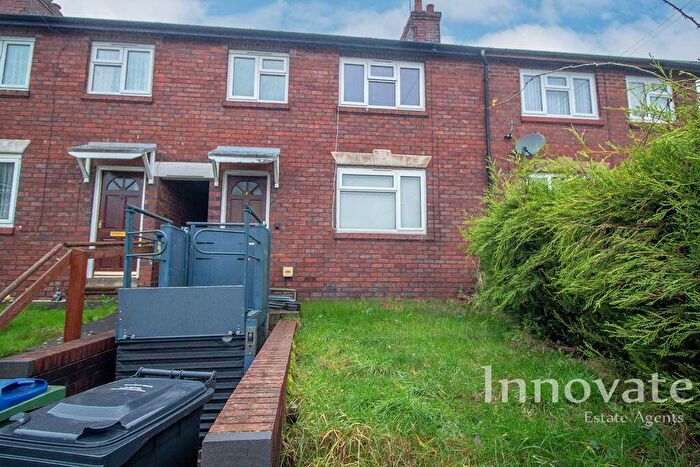
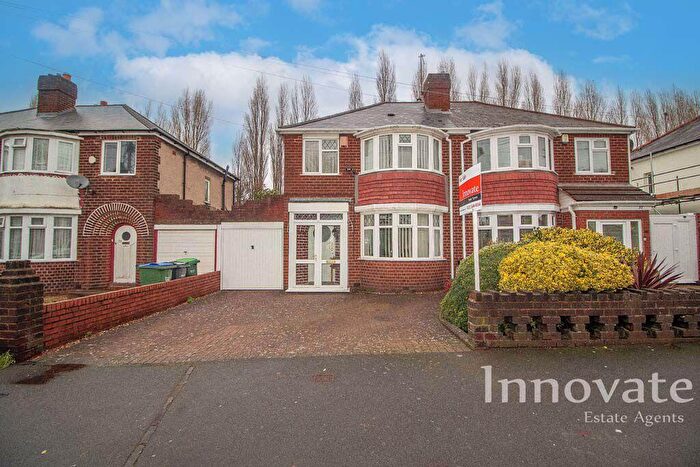
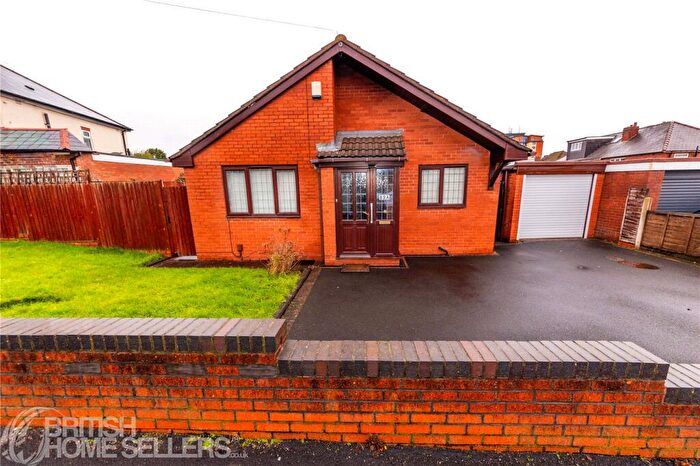
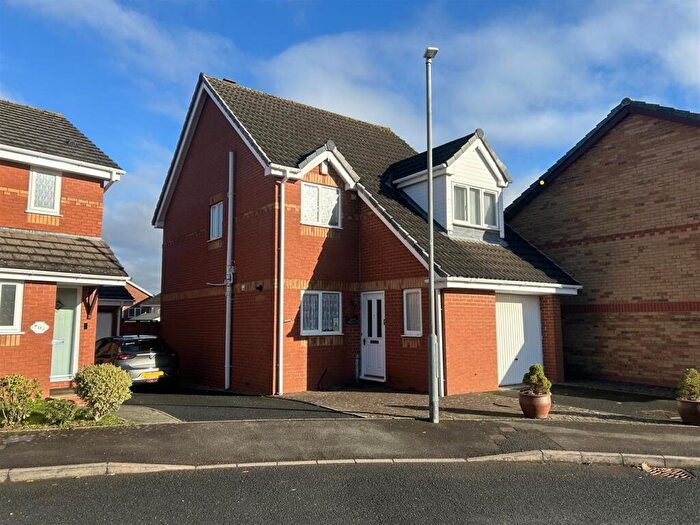
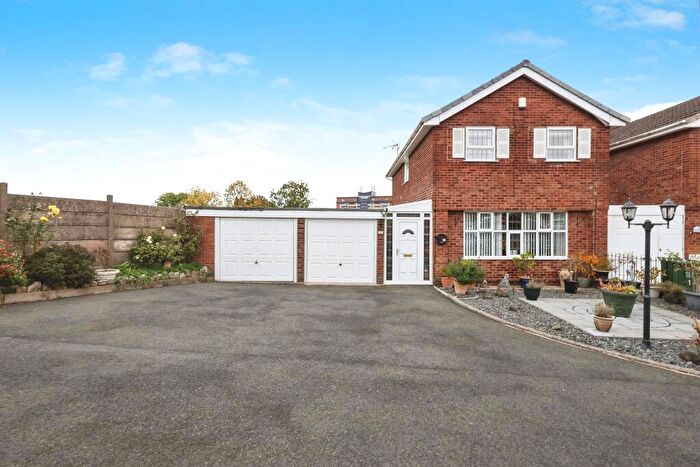
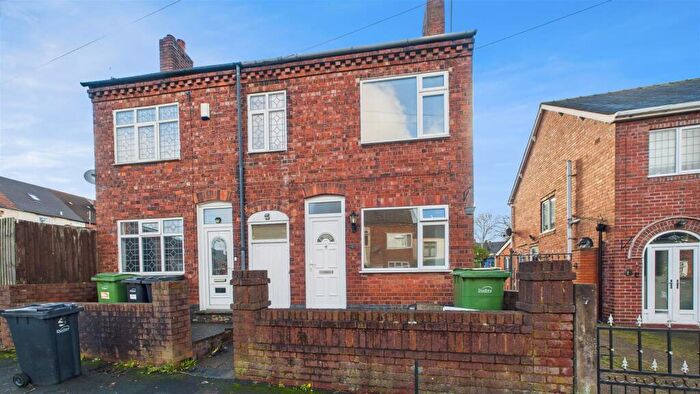
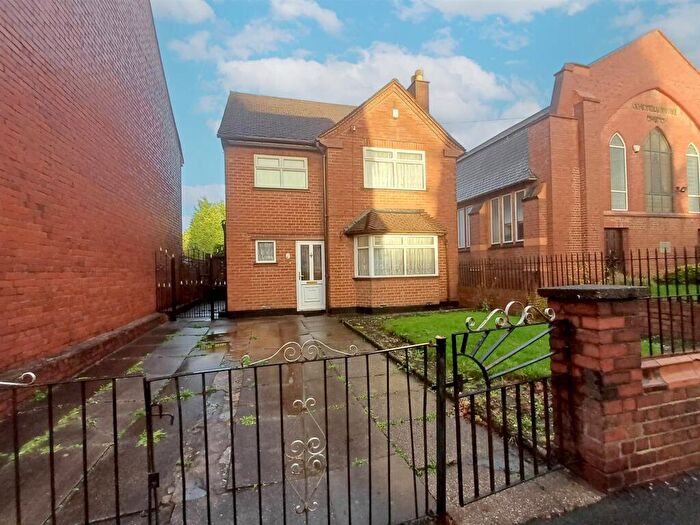
Properties in Langley have an average house price of £186,623.00 and had 93 Property Transactions within the last 3 years¹.
Langley is an area in Rowley Regis, Sandwell with 1,166 households², where the most expensive property was sold for £320,000.00.
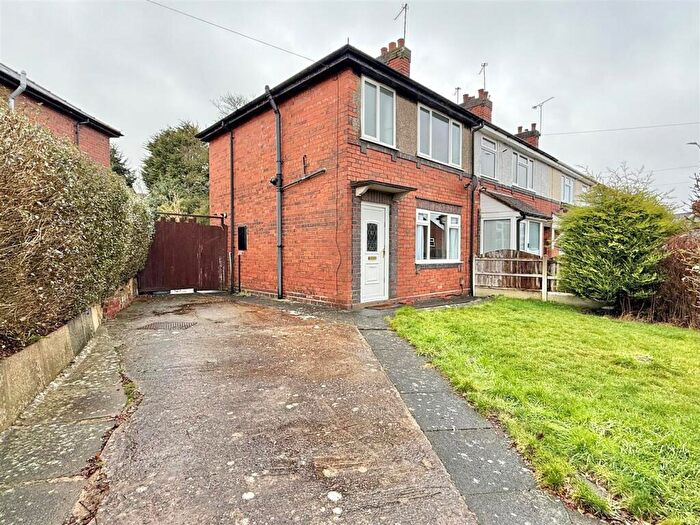
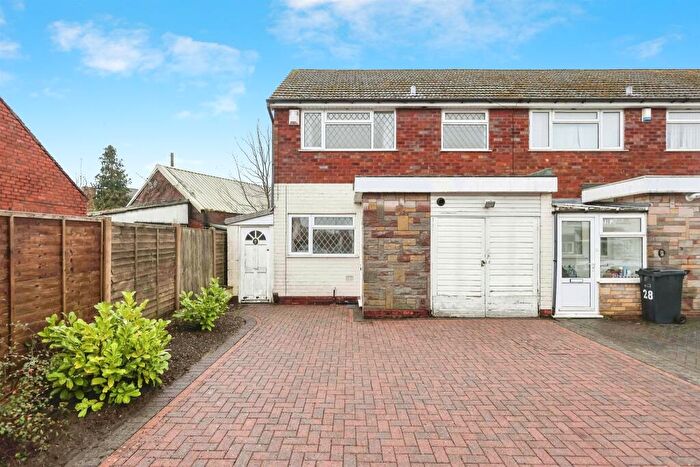
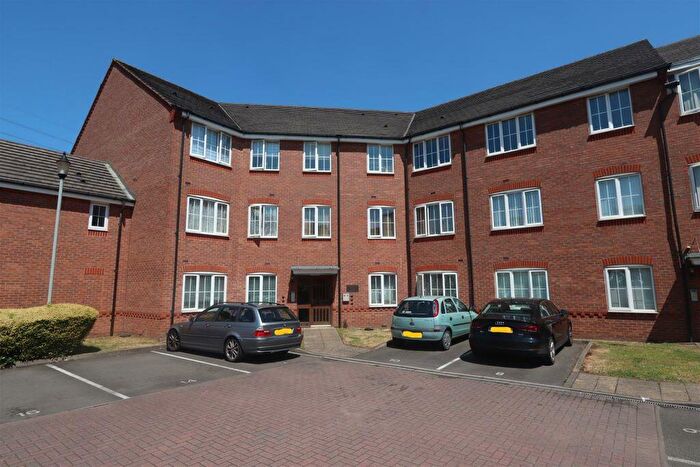
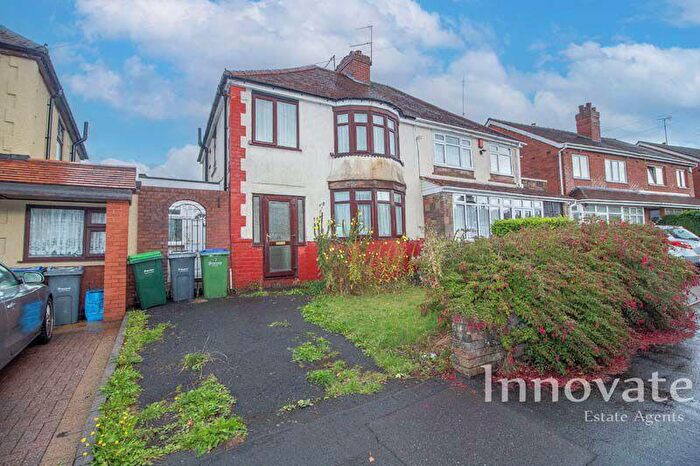
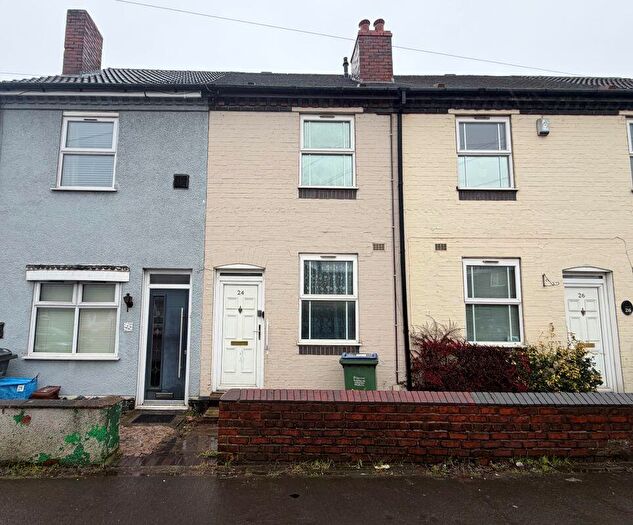
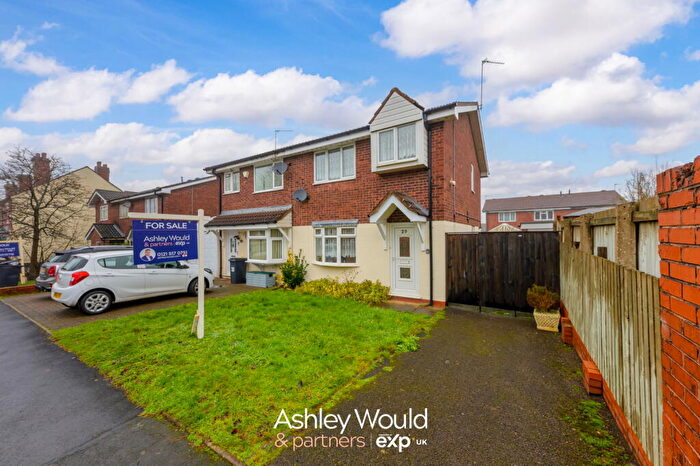
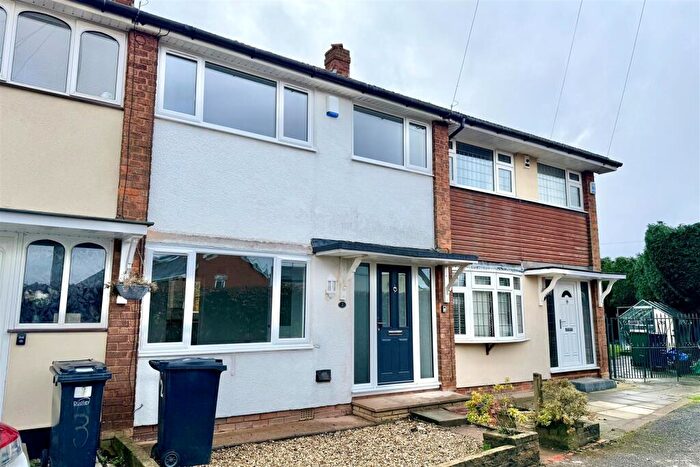
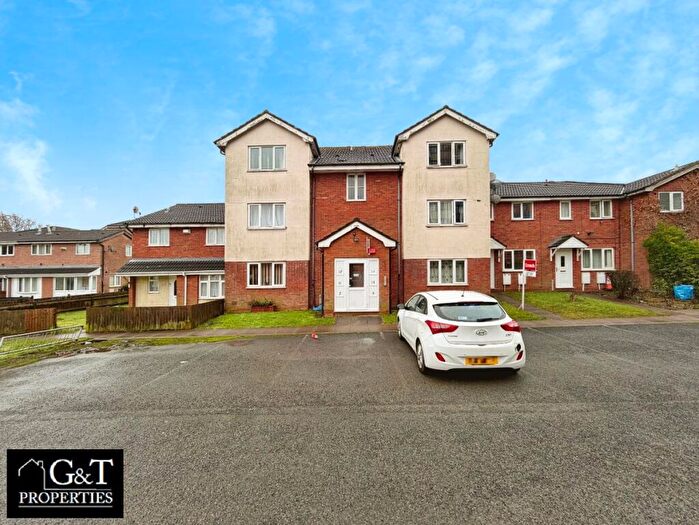
Properties for sale in Langley
Roads and Postcodes in Langley
Navigate through our locations to find the location of your next house in Langley, Rowley Regis for sale or to rent.
| Streets | Postcodes |
|---|---|
| Bond Street | B65 0QQ |
| Boundary Avenue | B65 0NY B65 0NZ |
| Cakemore Road | B65 0RB |
| Canterbury Close | B65 0SQ |
| Chichester Drive | B65 0EW |
| Durham Road | B65 0SD B65 0SH |
| Ely Close | B65 0PU |
| Field View Drive | B65 0RH |
| Griffin Industrial Estate | B65 0SN B65 0SP |
| Hackett Road | B65 0RP |
| Harrold Avenue | B65 0RQ |
| Harrold Road | B65 0RG B65 0RL B65 0RN |
| Jeffrey Road | B65 0RX B65 0SB |
| Minster Close | B65 0RS |
| Mount Road | B65 0RW |
| Oldbury Road | B65 0NN B65 0NW B65 0QG B65 0QJ B65 0QE B65 0QF B65 0QH |
| Penn Road | B65 0PQ |
| Penncricket Lane | B65 0PE B65 0PF B65 0RE B65 0RF B65 0RJ |
| Petersfield Drive | B65 0SA |
| Richards Close | B65 0PZ |
| Throne Road | B65 9JS B65 9JT B65 9JU B65 9LA |
| Titford Lane | B65 0PT B65 0PY |
| Truro Close | B65 0PN |
| Wells Road | B65 0SJ |
| Winchester Close | B65 0PW |
| Winwood Road | B65 0PG |
| Woodnorton Road | B65 0QY B65 0QZ |
| York Road | B65 0RR B65 0RT B65 0SG B65 0RU |
Transport near Langley
-
Rowley Regis Station
-
Langley Green Station
-
Old Hill Station
-
Sandwell and Dudley Station
-
Smethwick Galton Bridge Station
-
Smethwick Rolfe Street Station
-
Cradley Heath Station
-
Dudley Port Station
- FAQ
- Price Paid By Year
- Property Type Price
Frequently asked questions about Langley
What is the average price for a property for sale in Langley?
The average price for a property for sale in Langley is £186,623. This amount is 9% lower than the average price in Rowley Regis. There are 1,018 property listings for sale in Langley.
What streets have the most expensive properties for sale in Langley?
The streets with the most expensive properties for sale in Langley are Jeffrey Road at an average of £245,166, Hackett Road at an average of £232,000 and Boundary Avenue at an average of £231,785.
What streets have the most affordable properties for sale in Langley?
The streets with the most affordable properties for sale in Langley are Truro Close at an average of £76,000, Winchester Close at an average of £77,000 and Durham Road at an average of £102,933.
Which train stations are available in or near Langley?
Some of the train stations available in or near Langley are Rowley Regis, Langley Green and Old Hill.
Property Price Paid in Langley by Year
The average sold property price by year was:
| Year | Average Sold Price | Price Change |
Sold Properties
|
|---|---|---|---|
| 2025 | £180,614 | -9% |
27 Properties |
| 2024 | £196,629 | 7% |
31 Properties |
| 2023 | £182,396 | 11% |
35 Properties |
| 2022 | £162,023 | -4% |
47 Properties |
| 2021 | £168,700 | 16% |
45 Properties |
| 2020 | £141,682 | -4% |
26 Properties |
| 2019 | £147,827 | 10% |
35 Properties |
| 2018 | £133,120 | 9% |
35 Properties |
| 2017 | £120,531 | -8% |
37 Properties |
| 2016 | £130,571 | 20% |
57 Properties |
| 2015 | £103,961 | 5% |
30 Properties |
| 2014 | £98,660 | 8% |
34 Properties |
| 2013 | £90,289 | -3% |
28 Properties |
| 2012 | £93,048 | 8% |
26 Properties |
| 2011 | £85,300 | -11% |
24 Properties |
| 2010 | £94,347 | -18% |
22 Properties |
| 2009 | £111,733 | 15% |
15 Properties |
| 2008 | £94,648 | -14% |
26 Properties |
| 2007 | £107,796 | -1% |
53 Properties |
| 2006 | £108,471 | 8% |
49 Properties |
| 2005 | £100,026 | 11% |
45 Properties |
| 2004 | £89,081 | 22% |
51 Properties |
| 2003 | £69,762 | 20% |
78 Properties |
| 2002 | £55,677 | 21% |
73 Properties |
| 2001 | £43,949 | 0,1% |
62 Properties |
| 2000 | £43,886 | 16% |
44 Properties |
| 1999 | £36,982 | -2% |
46 Properties |
| 1998 | £37,584 | 3% |
36 Properties |
| 1997 | £36,337 | 14% |
47 Properties |
| 1996 | £31,386 | -13% |
34 Properties |
| 1995 | £35,483 | - |
31 Properties |
Property Price per Property Type in Langley
Here you can find historic sold price data in order to help with your property search.
The average Property Paid Price for specific property types in the last three years are:
| Property Type | Average Sold Price | Sold Properties |
|---|---|---|
| Semi Detached House | £213,270.00 | 44 Semi Detached Houses |
| Detached House | £198,700.00 | 5 Detached Houses |
| Terraced House | £190,741.00 | 31 Terraced Houses |
| Flat | £81,969.00 | 13 Flats |

