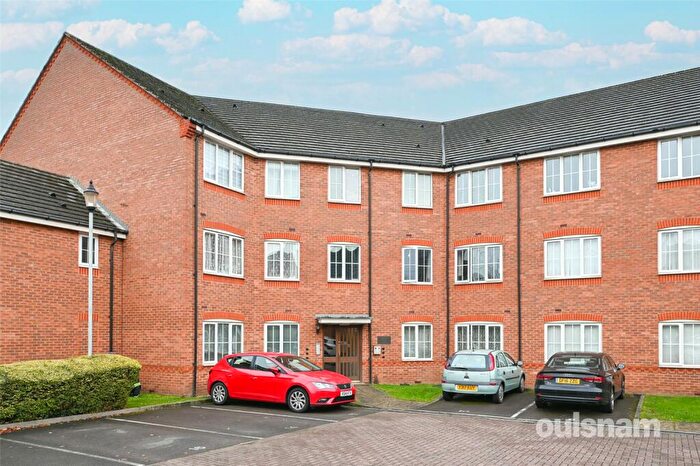
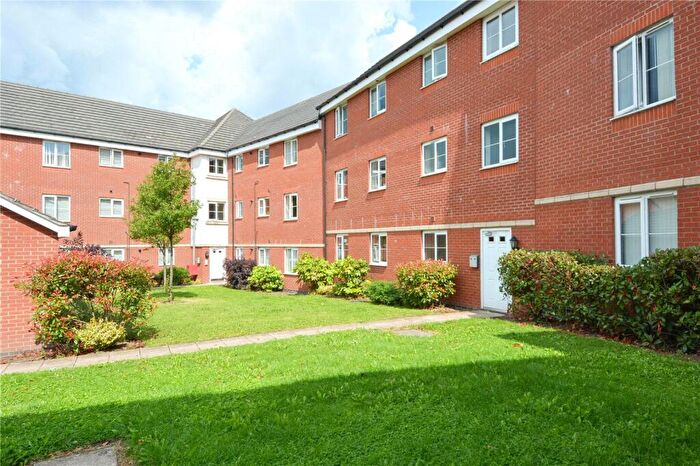
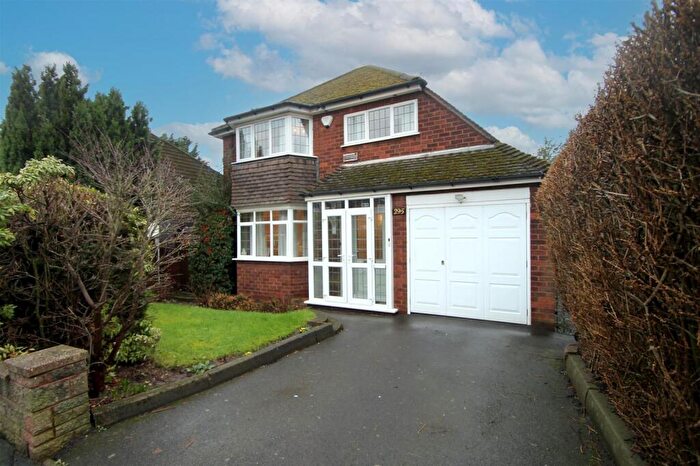
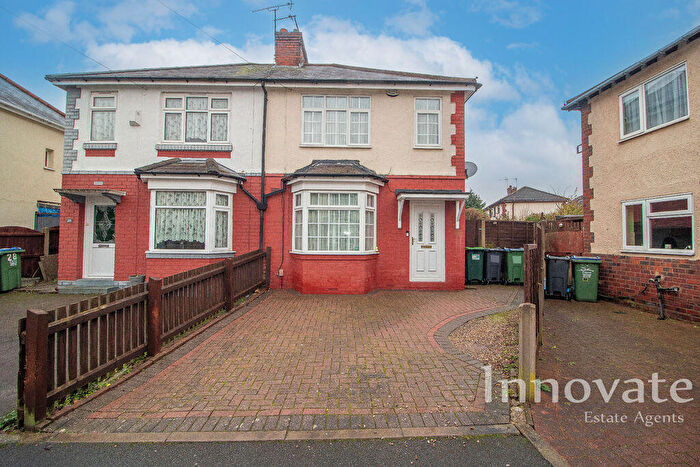
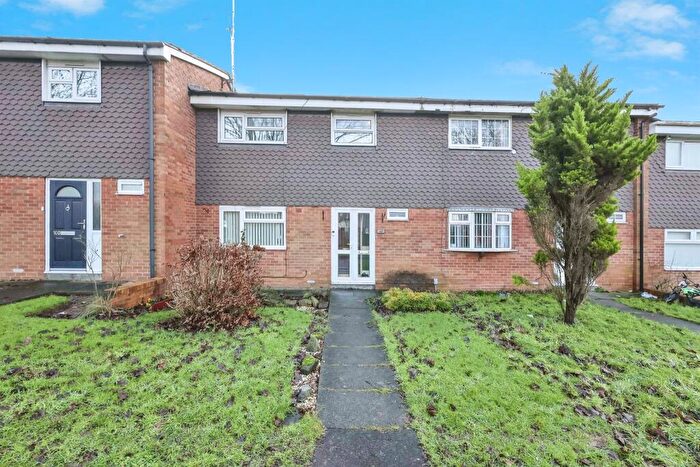
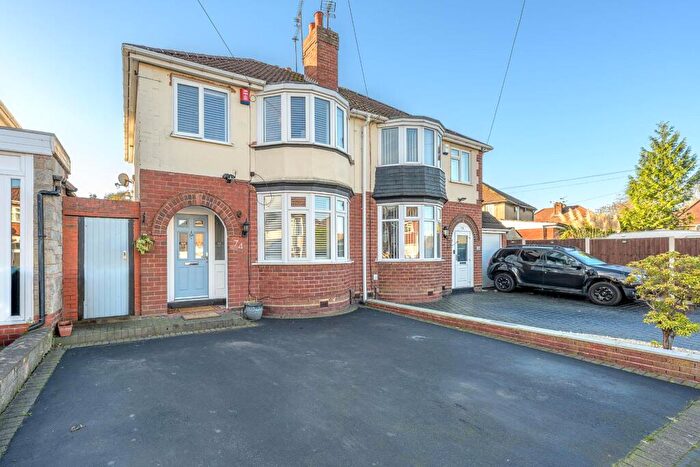
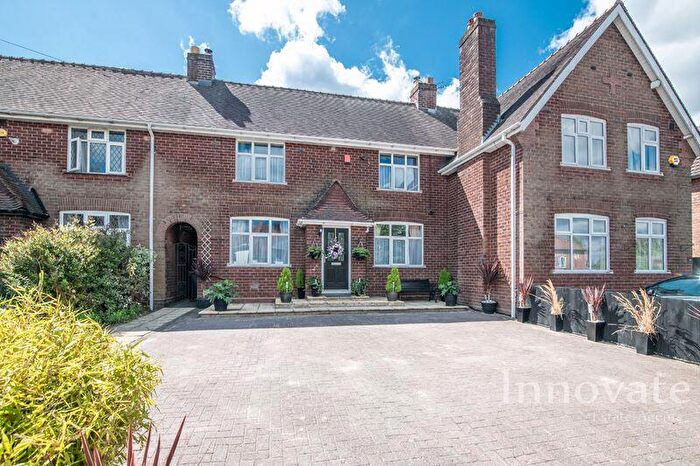
Houses for sale & to rent in Langley, Oldbury
House Prices in Langley
Properties in Langley have an average house price of £192,197.00 and had 298 Property Transactions within the last 3 years¹.
Langley is an area in Oldbury, Sandwell with 4,203 households², where the most expensive property was sold for £415,000.00.
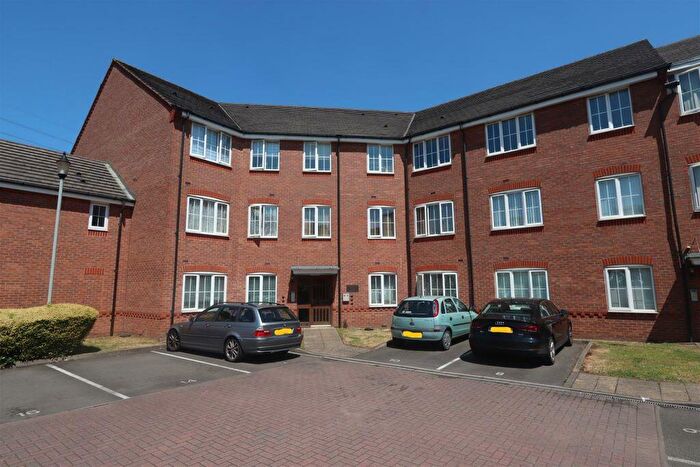
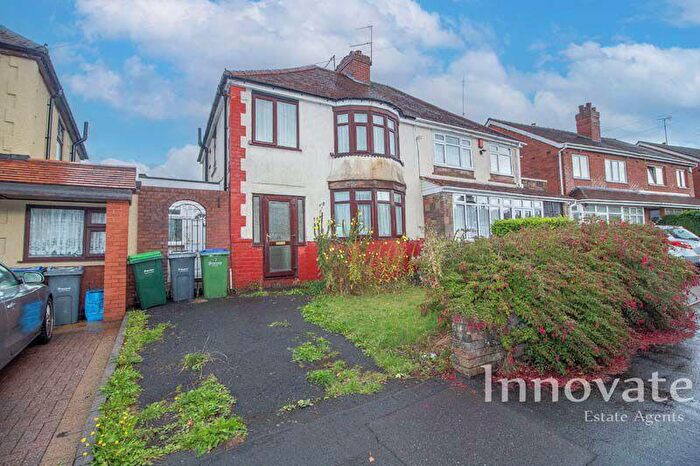
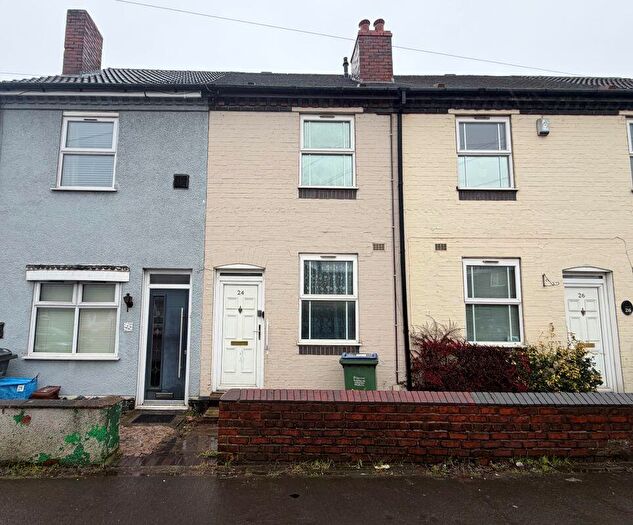
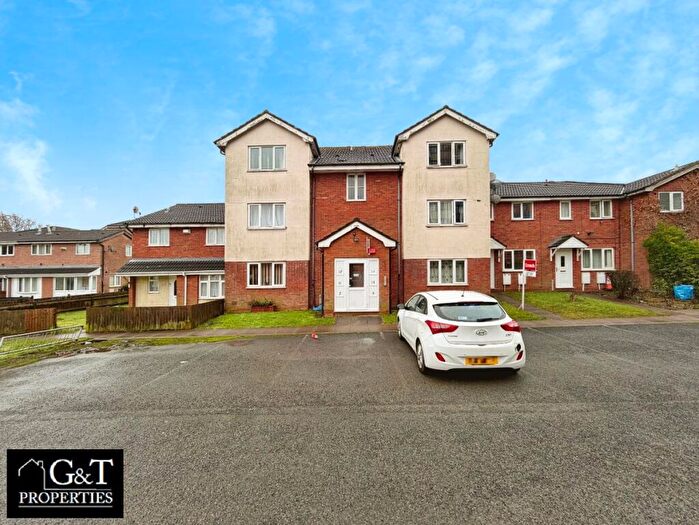
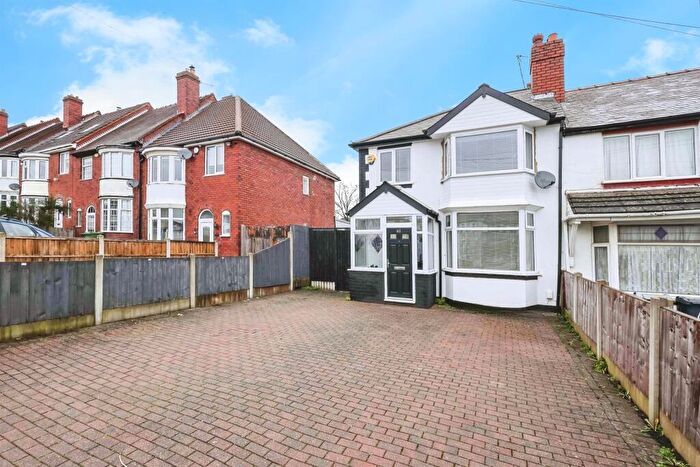
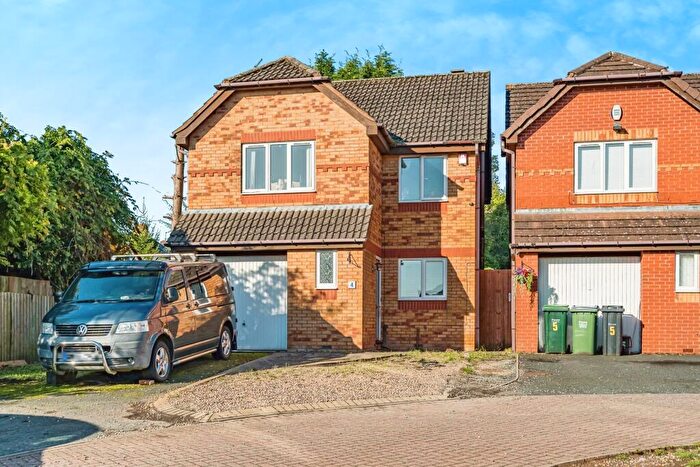
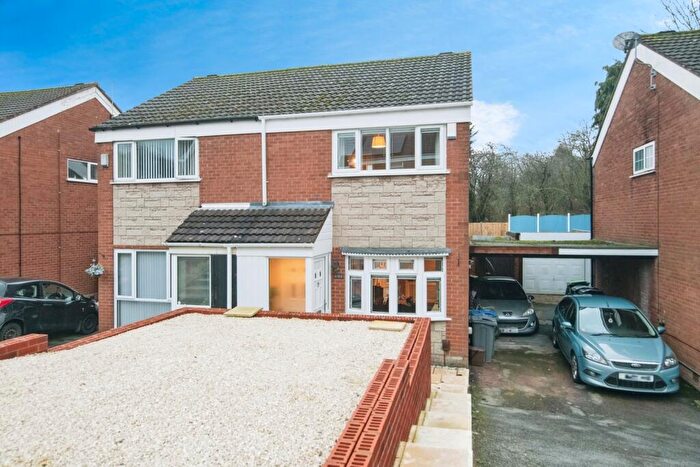
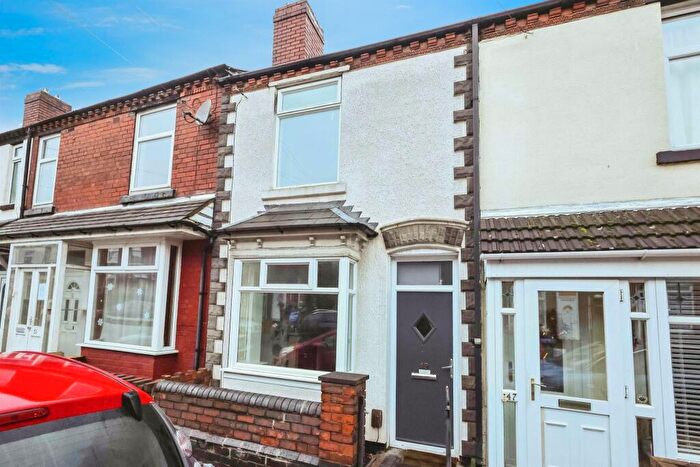
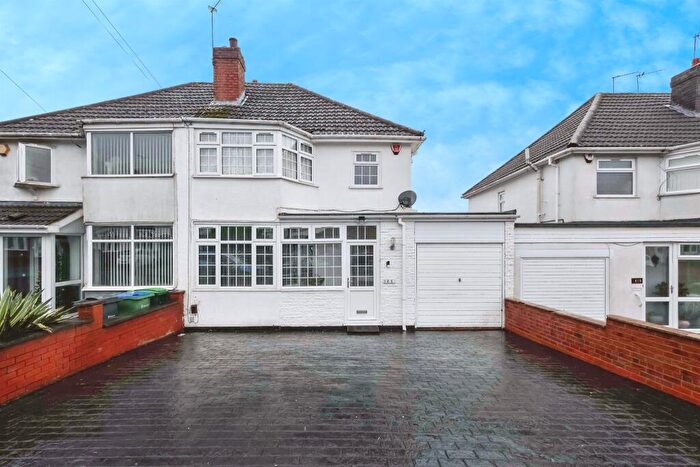
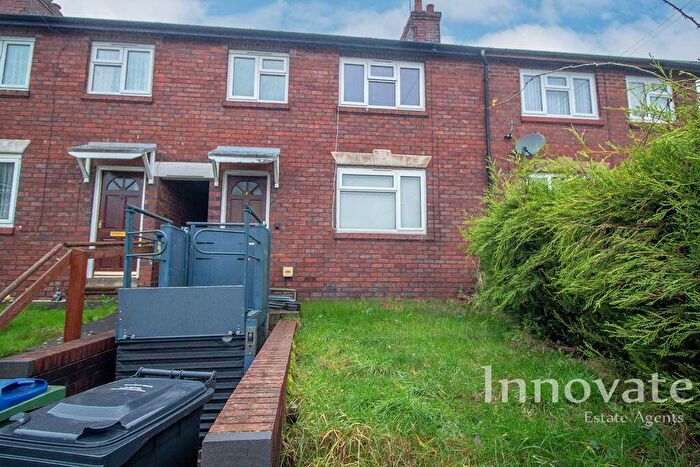
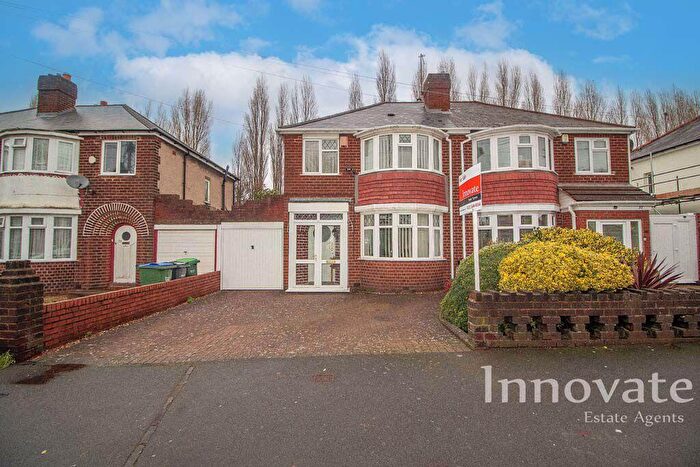
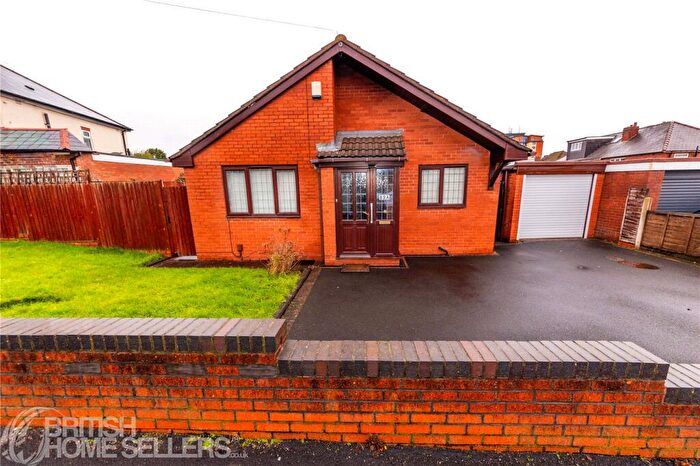
Properties for sale in Langley
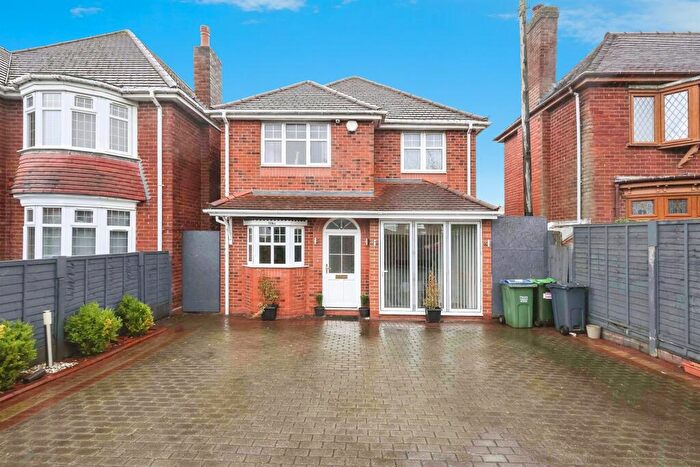
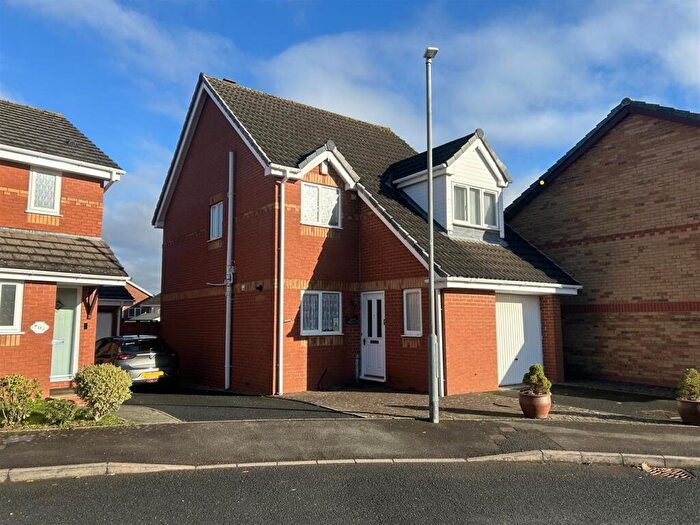
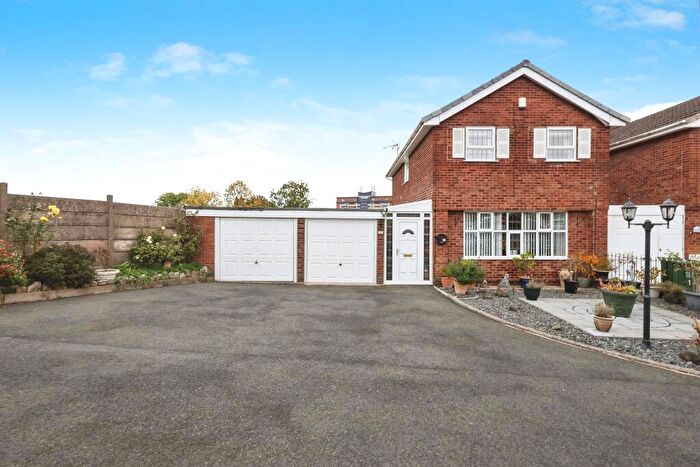
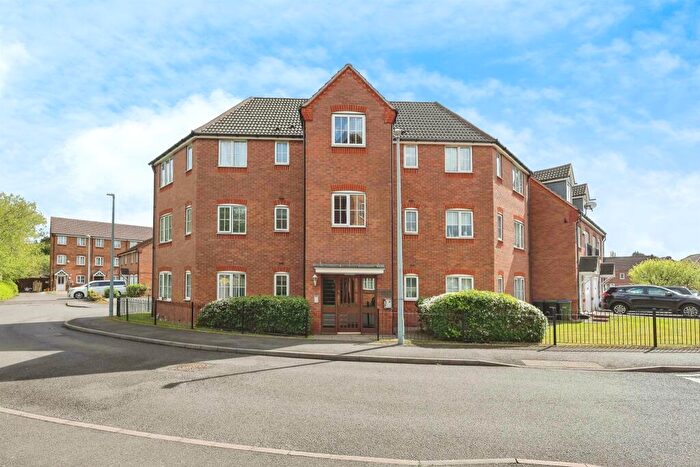
Previously listed properties in Langley
Roads and Postcodes in Langley
Navigate through our locations to find the location of your next house in Langley, Oldbury for sale or to rent.
| Streets | Postcodes |
|---|---|
| All Angels Walk | B68 8RJ |
| Amber Drive | B69 4TS |
| Arden Grove | B69 4SU B69 4SX |
| Arley Close | B69 1EA B69 1EB |
| Ashes Road | B69 4QY B69 4QZ B69 4RB B69 4RD |
| Ashwood Close | B69 4SD |
| Badsey Road | B69 1BU B69 1BX B69 1BY B69 1BZ B69 1DA B69 1DB B69 1DL B69 1EJ B69 1ER |
| Barrs Street | B68 8QU B68 8QT |
| Birchfield Lane | B69 1AE B69 1AF B69 1AG B69 1AQ B69 1AD |
| Birchley Industrial Estate | B69 1DT |
| Blakedown Way | B69 1AT |
| Borough Crescent | B69 1AH B69 1AJ B69 1AX B69 1BB |
| Brandhall Lane | B68 8DF |
| Bredon Road | B69 1EP B69 1DD |
| Bridgewater Avenue | B69 4TL |
| Broad Street | B69 4SE B69 4SF B69 4SH |
| Brook Road | B68 8AA B68 8AD B68 8AE |
| Causeway Green Road | B68 8LA B68 8LD B68 8LE B68 8LF B68 8LJ B68 8LQ B68 8LS B68 8LT B68 8LU |
| Chaddesley Close | B69 1EL |
| Chapel Passage | B69 4TP |
| Clay Lane | B69 4SY B69 4TH |
| Clements Close | B69 4QJ |
| Clifton Close | B69 4TT |
| Cookley Way | B69 1BH |
| Cotswold Close | B69 1FB |
| Cross Street | B68 8QX |
| Crusader Close | B69 1EF |
| Dorgrove Gardens | B68 8LB |
| Edward Street | B68 8RH |
| Ethel Street | B68 8QY |
| Fairway Road | B68 8BE |
| Falcon Road | B68 8AU B68 8AX |
| Farm Road | B68 8PL B68 8PN B68 8QZ B68 8RA B68 8RB B68 8RD |
| Ferndale Road | B68 8AJ B68 8AL B68 8AP B68 8AR B68 8BB B68 8BD B68 8BH |
| Grafton Road | B68 8BJ B68 8BL B68 8BP |
| Grosvenor Road | B68 8LG |
| Hadley Street | B68 8PU |
| Hanbury Drive | B69 1DX |
| Hartlebury Road | B69 1DE B69 1DF B69 1EG B69 1EQ |
| Harvest Gardens | B68 8PY |
| Heron Road | B68 8AG B68 8AQ B68 8AH |
| High Street | B69 4SR |
| Hyacinth Grove | B69 4BZ |
| Inkberrow Close | B69 1DU |
| Jarvis Crescent | B69 4QH |
| Junction Street South | B69 4ST B69 4TA |
| Kempsey Close | B69 1DN B69 1BN |
| Kestrel Road | B68 8AS |
| King Edward Close | B68 8BN |
| Kinnersley Crescent | B69 1DJ |
| Langley Green Road | B69 4TG |
| Langley High Street | B69 4SN B69 4SL |
| Langley Road | B68 8QP |
| Leahouse Road | B68 8NZ |
| Lovett Avenue | B69 1BS B69 1BT B69 1DG B69 1DR B69 1DS B69 1DQ |
| Mallard Drive | B69 4QU |
| Maltings Avenue | B69 4FJ |
| Martley Road | B69 1DY B69 1DZ B69 1ED B69 1EH |
| Mill Lane | B69 4DF B69 4SW |
| New Henry Street | B68 8RG B68 8RQ |
| Oak Green Way | B68 8LR |
| Oakdale Close | B68 8BA |
| Oakdale Road | B68 8AY B68 8AZ |
| Old Chapel Walk | B68 8RS |
| Old College Avenue | B68 8BF B68 8BG |
| Old Park Lane | B69 4PT B69 4PU |
| Ombersley Close | B69 1DP |
| Park Lane | B69 4LP |
| Parkfield Road | B68 8PS B68 8PT |
| Pedmore Walk | B69 1BJ |
| Penncricket Lane | B68 8LX |
| Penstock Drive | B69 4TE |
| Pool Lane | B69 4QS B69 4QX |
| Poplar Avenue | B69 4SS |
| Poppy Avenue | B69 4BS |
| Pound Close | B68 8LZ B68 8NN |
| Pound Road | B68 8LY |
| Pumphouse Way | B69 4TJ |
| Saladin Avenue | B69 1EE |
| Shelsley Avenue | B69 1BQ B69 1BG B69 1BL B69 1BP B69 1BW |
| Spring Walk | B69 4SP |
| St James Gardens | B68 8NJ |
| St Matthews Road | B68 8AB B68 8AF |
| St Michaels Crescent | B69 4RT |
| Stanford Way | B69 1BD |
| Station Road | B69 4LU B69 4SQ |
| Staulton Green | B69 1AU |
| Swan Crescent | B69 4QG B69 4QQ |
| Sycamore Road | B69 4TD |
| The Chilterns | B69 1FE |
| The Lenches | B69 1BF |
| The Templars | B69 1EU |
| Thrush Road | B68 8AT |
| Titford Close | B69 4XA |
| Titford Road | B69 4PY B69 4QA B69 4QD B69 4QE B69 4QF B69 4QN B69 4QP B69 4QR B69 4QT B69 4QW B69 4PZ B69 4QB |
| Uncle Bens Close | B69 4TU |
| Underhill Street | B69 4SJ B69 4FL |
| Underhill Walk | B69 4SA |
| Victoria Mews | B69 4RP |
| Waterside Crescent | B69 4SZ |
| Westgate | B69 1BA |
| Whyley Walk | B69 4SB |
| Windsor Avenue | B68 8PA |
| Windsor Road | B68 8NY B68 8PB |
| Witley Crescent | B69 1BE B69 1FF |
| Wolverhampton Road | B68 8DD B68 8DE B69 4RR B69 4RS B69 4RU B69 4RY B68 8DA B68 8DH B69 2AG B69 2JG B69 4RJ |
| Wolverley Crescent | B69 1AY B69 1AZ B69 1FD B69 1AW |
| Woodfield Avenue | B69 4TB |
Transport near Langley
-
Langley Green Station
-
Rowley Regis Station
-
Sandwell and Dudley Station
-
Old Hill Station
-
Smethwick Galton Bridge Station
-
Smethwick Rolfe Street Station
-
The Hawthorns Station
-
Dudley Port Station
- FAQ
- Price Paid By Year
- Property Type Price
Frequently asked questions about Langley
What is the average price for a property for sale in Langley?
The average price for a property for sale in Langley is £192,197. This amount is 9% lower than the average price in Oldbury. There are 811 property listings for sale in Langley.
What streets have the most expensive properties for sale in Langley?
The streets with the most expensive properties for sale in Langley are Parkfield Road at an average of £299,503, Grosvenor Road at an average of £293,333 and Pound Road at an average of £275,000.
What streets have the most affordable properties for sale in Langley?
The streets with the most affordable properties for sale in Langley are All Angels Walk at an average of £95,000, Crusader Close at an average of £106,333 and Wolverley Crescent at an average of £109,750.
Which train stations are available in or near Langley?
Some of the train stations available in or near Langley are Langley Green, Rowley Regis and Sandwell and Dudley.
Property Price Paid in Langley by Year
The average sold property price by year was:
| Year | Average Sold Price | Price Change |
Sold Properties
|
|---|---|---|---|
| 2025 | £203,075 | 8% |
82 Properties |
| 2024 | £187,011 | -1% |
108 Properties |
| 2023 | £189,125 | 6% |
108 Properties |
| 2022 | £177,668 | 11% |
145 Properties |
| 2021 | £157,564 | 2% |
137 Properties |
| 2020 | £154,121 | 8% |
114 Properties |
| 2019 | £142,478 | 2% |
105 Properties |
| 2018 | £139,225 | -4% |
124 Properties |
| 2017 | £144,678 | 10% |
172 Properties |
| 2016 | £130,044 | 9% |
133 Properties |
| 2015 | £118,904 | -2% |
117 Properties |
| 2014 | £120,824 | 3% |
134 Properties |
| 2013 | £117,074 | 9% |
122 Properties |
| 2012 | £106,568 | 3% |
67 Properties |
| 2011 | £103,444 | -1% |
67 Properties |
| 2010 | £103,994 | 2% |
74 Properties |
| 2009 | £101,785 | -9% |
68 Properties |
| 2008 | £111,206 | -7% |
93 Properties |
| 2007 | £118,525 | -0,4% |
157 Properties |
| 2006 | £118,974 | 6% |
195 Properties |
| 2005 | £112,226 | 5% |
244 Properties |
| 2004 | £107,011 | 15% |
183 Properties |
| 2003 | £91,335 | 16% |
211 Properties |
| 2002 | £76,896 | 31% |
184 Properties |
| 2001 | £52,731 | 4% |
171 Properties |
| 2000 | £50,844 | 16% |
131 Properties |
| 1999 | £42,485 | -5% |
127 Properties |
| 1998 | £44,402 | 12% |
111 Properties |
| 1997 | £39,180 | -0,4% |
94 Properties |
| 1996 | £39,356 | -2% |
92 Properties |
| 1995 | £40,123 | - |
111 Properties |
Property Price per Property Type in Langley
Here you can find historic sold price data in order to help with your property search.
The average Property Paid Price for specific property types in the last three years are:
| Property Type | Average Sold Price | Sold Properties |
|---|---|---|
| Flat | £117,458.00 | 36 Flats |
| Semi Detached House | £214,695.00 | 134 Semi Detached Houses |
| Detached House | £275,318.00 | 11 Detached Houses |
| Terraced House | £181,613.00 | 117 Terraced Houses |

