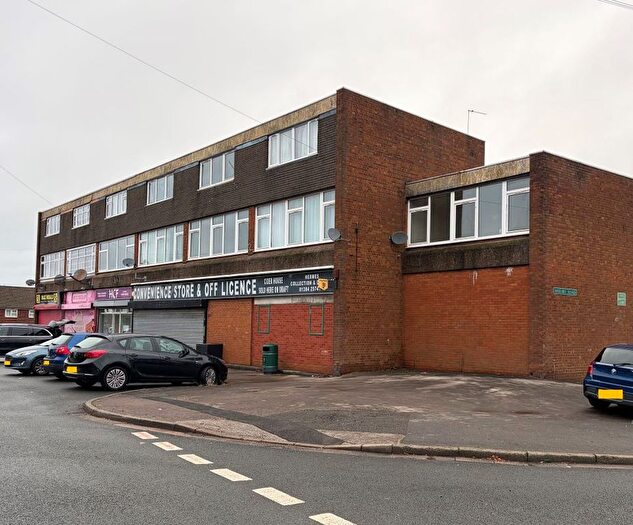
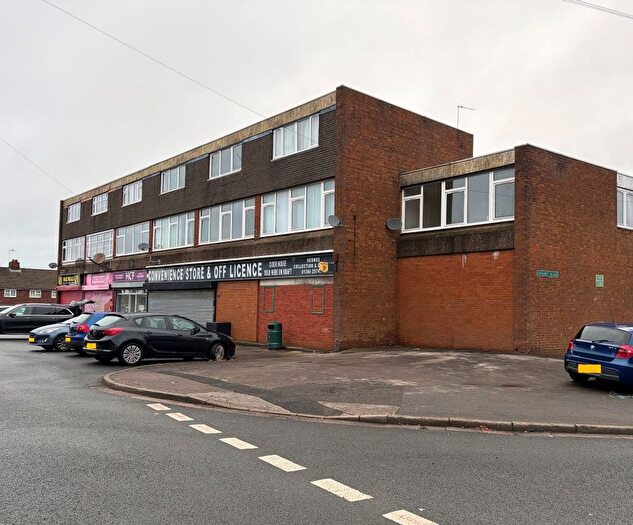
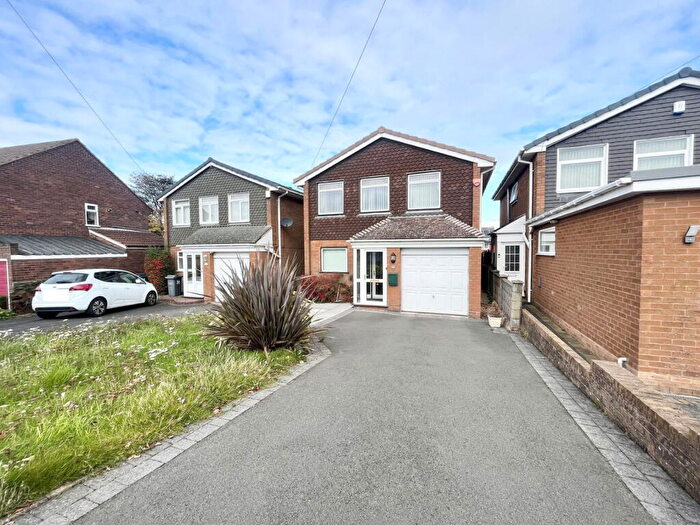
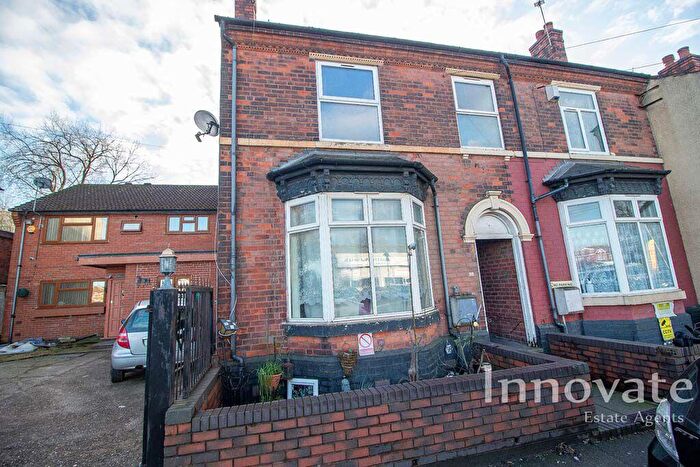
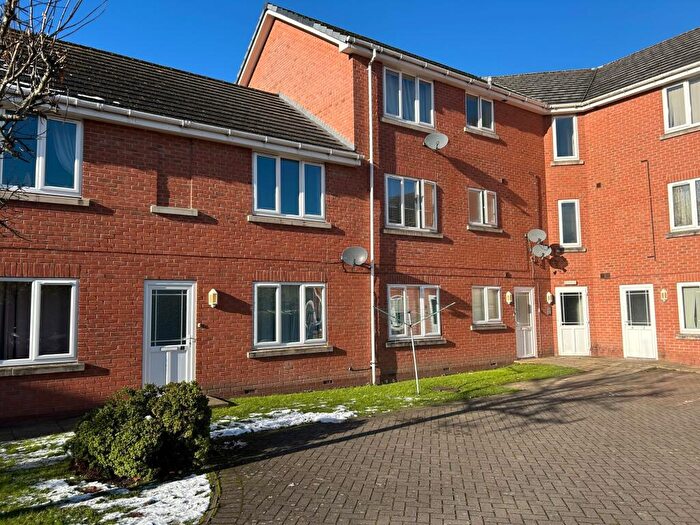
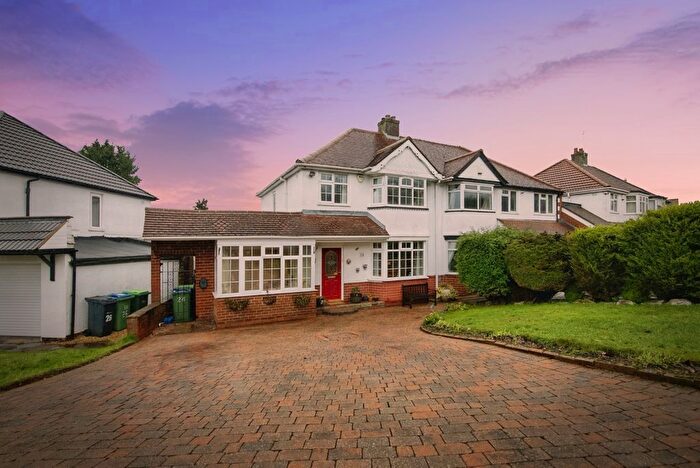
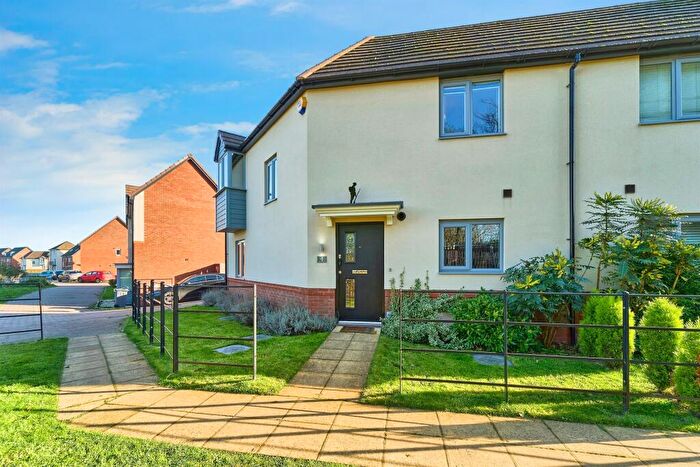
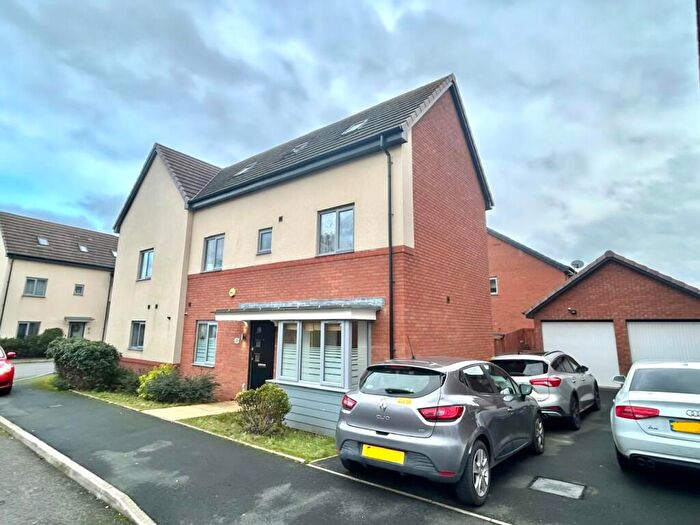
Houses for sale & to rent in Oldbury, Tipton
House Prices in Oldbury
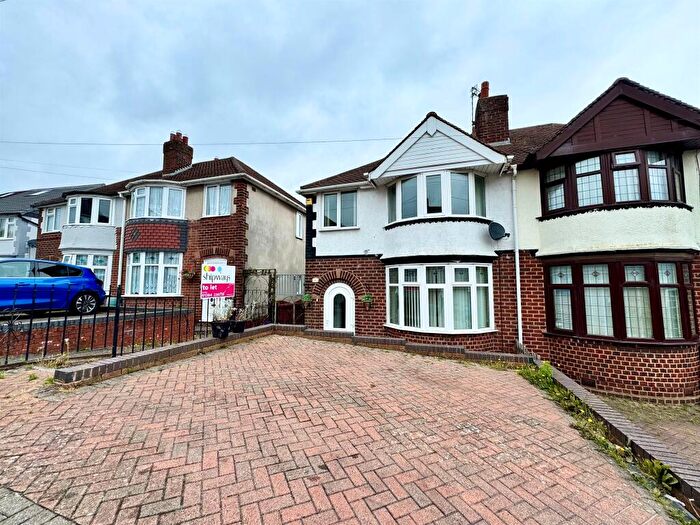
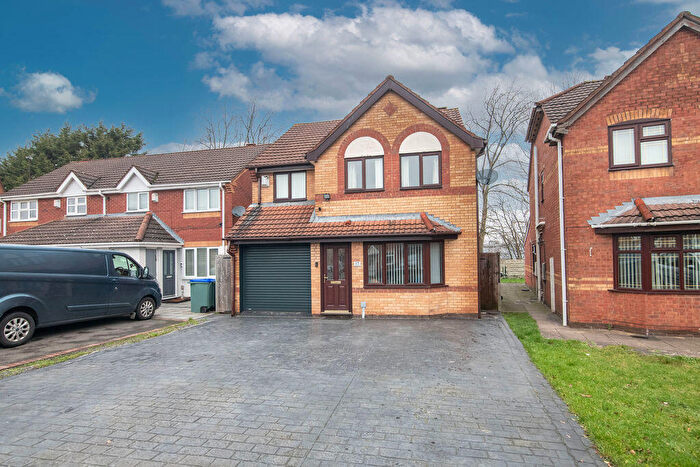
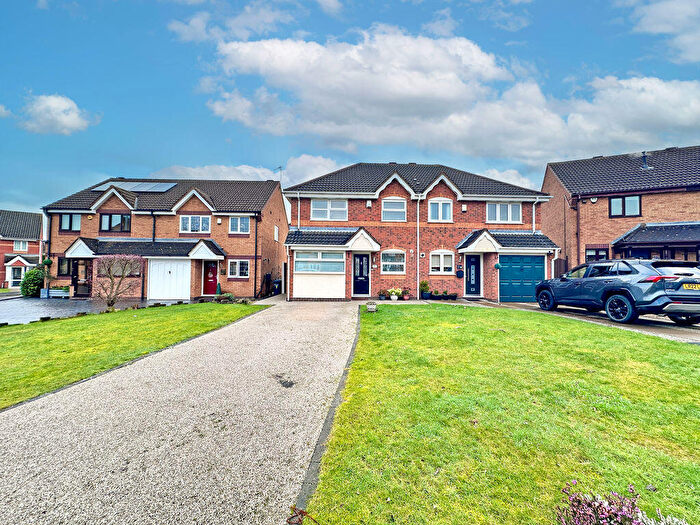
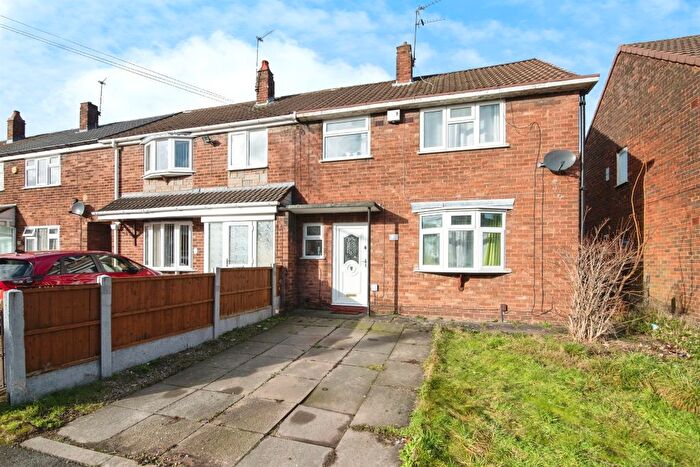
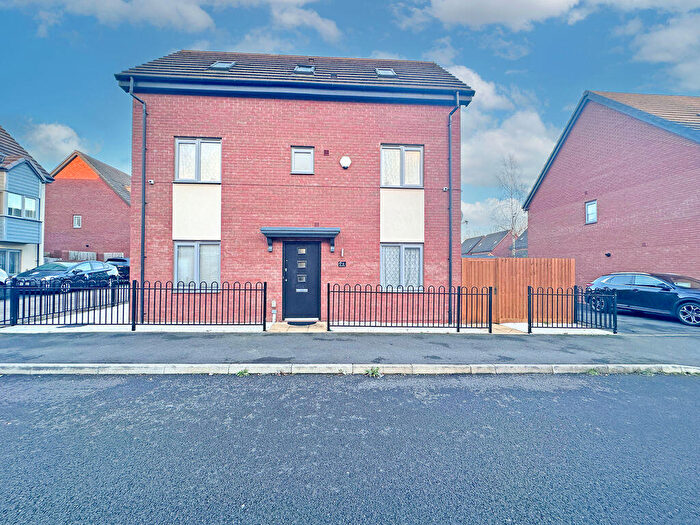
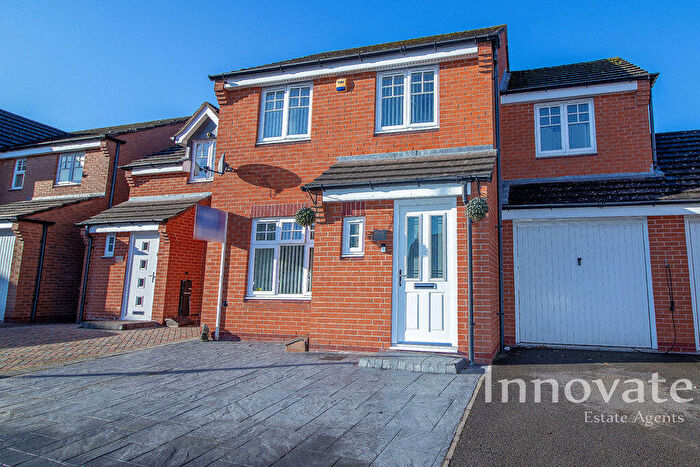
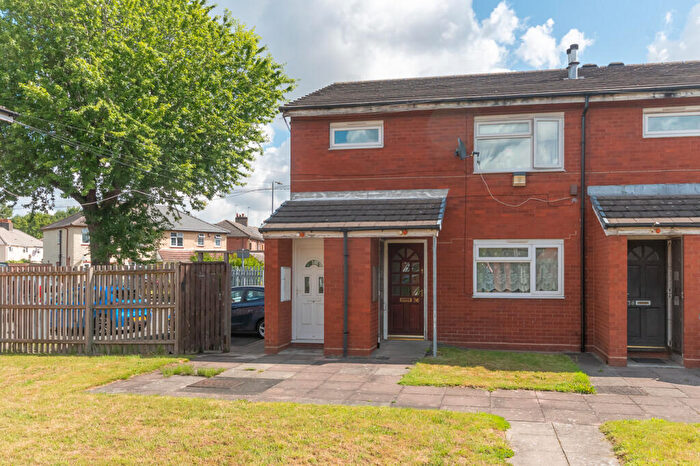
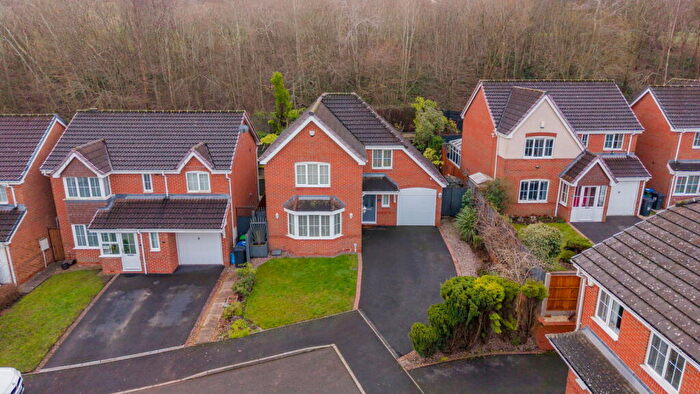
Properties in Oldbury have an average house price of £158,885.00 and had 96 Property Transactions within the last 3 years¹.
Oldbury is an area in Tipton, Sandwell with 1,339 households², where the most expensive property was sold for £405,000.00.
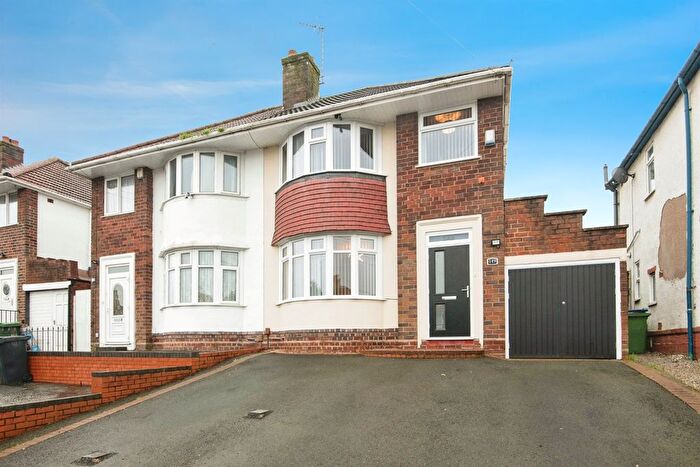
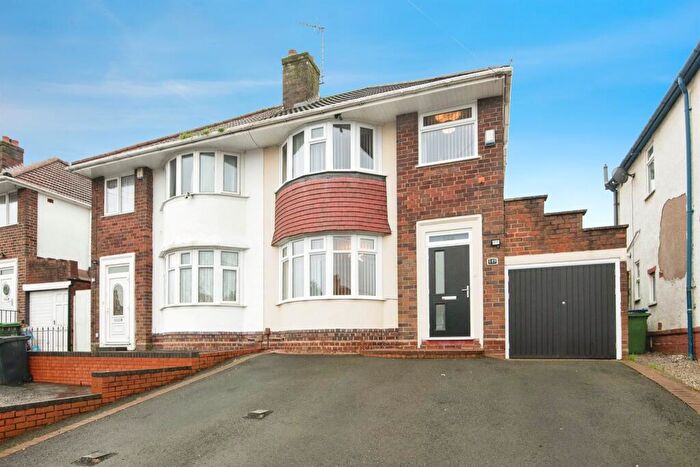
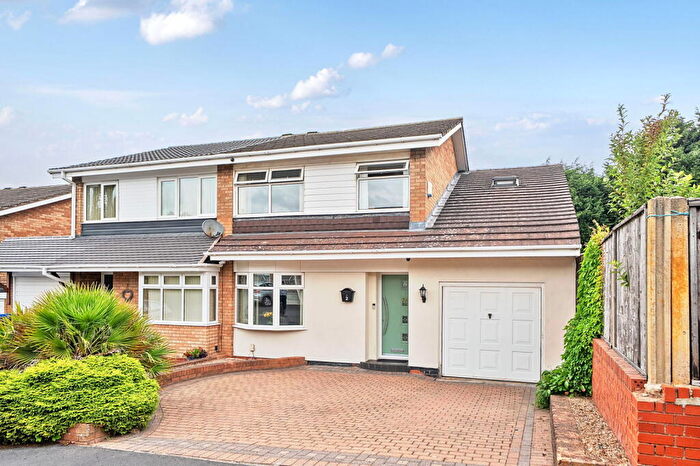
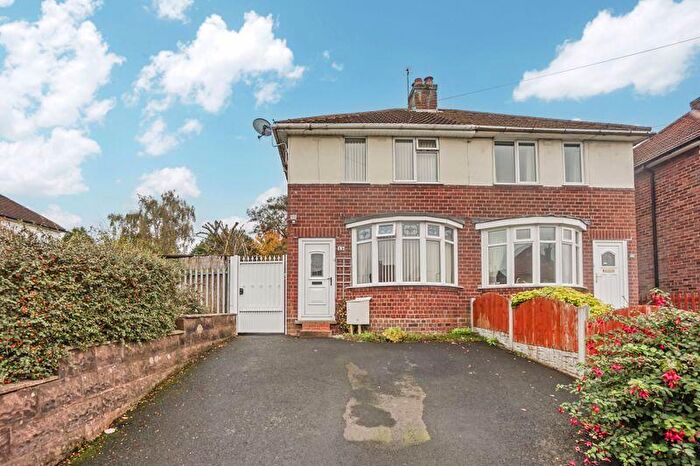
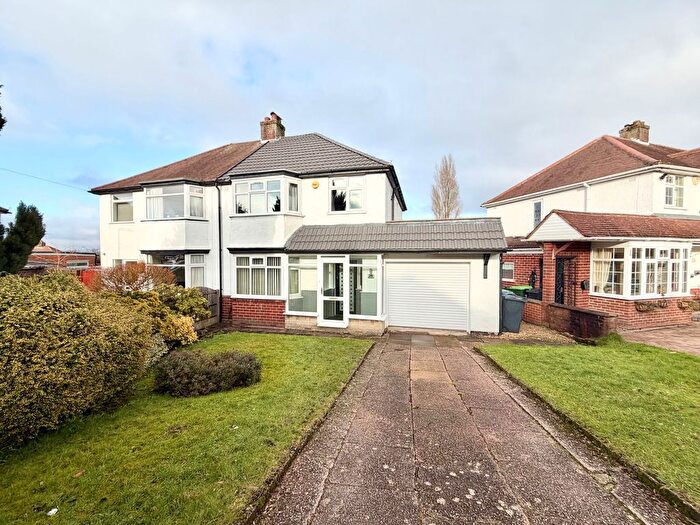
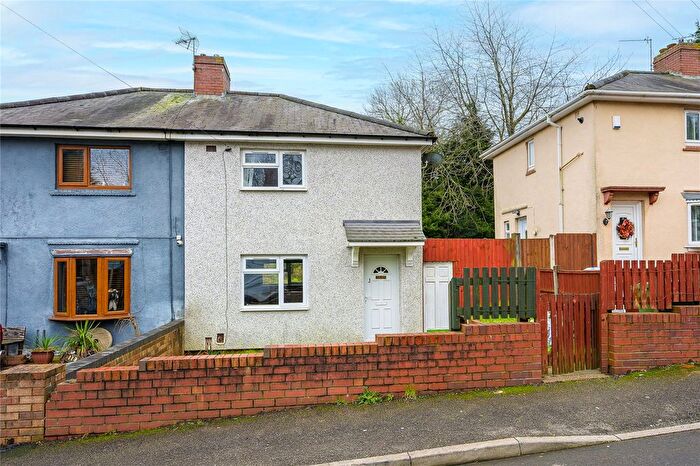
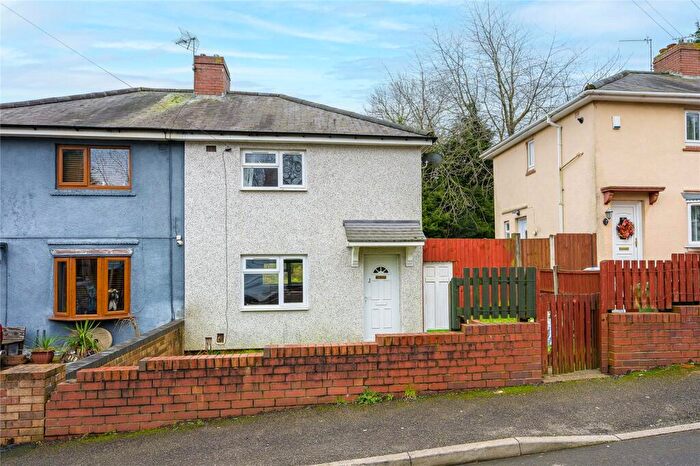
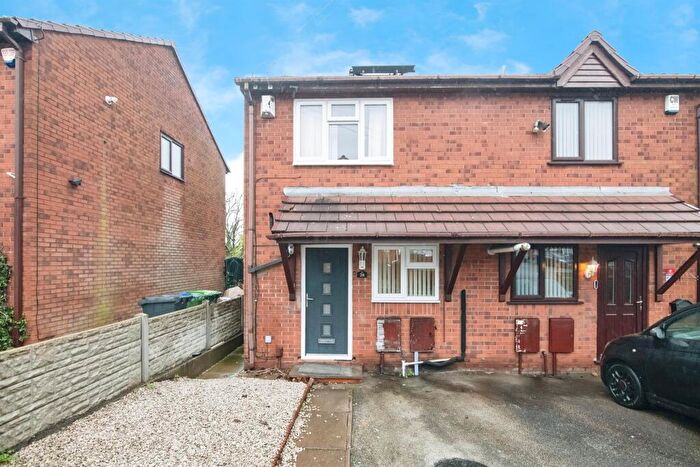
Properties for sale in Oldbury
Roads and Postcodes in Oldbury
Navigate through our locations to find the location of your next house in Oldbury, Tipton for sale or to rent.
| Streets | Postcodes |
|---|---|
| Amphlett Croft | DY4 7RX |
| Anchor Drive | DY4 7RD |
| Anita Avenue | DY4 7XH |
| Ashcroft | DY4 7GZ |
| Bedworth Croft | DY4 7RU |
| Bradley Street | DY4 7TA |
| Bradshaw Close | DY4 7XW |
| Brindlefields Way | DY4 7XL |
| Burnt Tree | DY4 7TY DY4 7TZ |
| Church Street | DY4 7SR |
| Cleton Street | DY4 7TR |
| Crew Drive | DY4 7SS |
| Crown Walk | DY4 7SY |
| Damson Wharf | DY4 7UL |
| Danks Street | DY4 7SU |
| Dudley Port | DY4 7RF DY4 7RB DY4 7SA |
| Dudley Road West | DY4 7TH DY4 7TJ |
| Gate Street | DY4 7SP |
| Gilbert Street | DY4 7SZ |
| Groveland Road | DY4 7TB DY4 7TL DY4 7TN DY4 7UD |
| Haines Close | DY4 7RW |
| Hawkins Croft | DY4 7XX |
| Hellier Avenue | DY4 7RN |
| Holcroft Street | DY4 7SN DY4 7SW |
| Holden Croft | DY4 7XR |
| Hopkins Street | DY4 7ST |
| Kiers Bridge Close | DY4 7UR |
| Lara Grove | DY4 7XG |
| Lissimore Drive | DY4 7SX |
| Monins Avenue | DY4 7XP DY4 7XQ |
| Monk Close | DY4 7TP |
| Old Port Close | DY4 7XN |
| Orchard Street | DY4 7TD |
| Patricia Drive | DY4 7XF |
| Peacock Close | DY4 7RY |
| Peake Drive | DY4 7RJ |
| Portfield Drive | DY4 7UP |
| Reeves Close | DY4 7SQ |
| Royal Way | DY4 7SJ |
| Sedgley Road East | DY4 7TU DY4 7TX DY4 7TS DY4 7TT DY4 7UU |
| St Michaels Way | DY4 7XT |
| Tipton Road | DY4 7XY DY4 7UW |
| Tividale Road | DY4 7TE DY4 7TG DY4 7TF |
| Tividale Street | DY4 7SB DY4 7SD |
| Vaughan Trading Estate | DY4 7UJ |
| Wenyon Close | DY4 7RS |
| Whitehouse Street | DY4 7SE DY4 7SF |
| Wynn Griffith Drive | DY4 7XU |
Transport near Oldbury
-
Dudley Port Station
-
Tipton Station
-
Sandwell and Dudley Station
-
Coseley Station
-
Langley Green Station
-
Rowley Regis Station
- FAQ
- Price Paid By Year
- Property Type Price
Frequently asked questions about Oldbury
What is the average price for a property for sale in Oldbury?
The average price for a property for sale in Oldbury is £158,885. This amount is 12% lower than the average price in Tipton. There are 866 property listings for sale in Oldbury.
What streets have the most expensive properties for sale in Oldbury?
The streets with the most expensive properties for sale in Oldbury are Hellier Avenue at an average of £265,750, Lissimore Drive at an average of £260,000 and Portfield Drive at an average of £256,666.
What streets have the most affordable properties for sale in Oldbury?
The streets with the most affordable properties for sale in Oldbury are Anita Avenue at an average of £78,500, Dudley Road West at an average of £102,875 and Holcroft Street at an average of £116,750.
Which train stations are available in or near Oldbury?
Some of the train stations available in or near Oldbury are Dudley Port, Tipton and Sandwell and Dudley.
Property Price Paid in Oldbury by Year
The average sold property price by year was:
| Year | Average Sold Price | Price Change |
Sold Properties
|
|---|---|---|---|
| 2025 | £165,261 | 2% |
22 Properties |
| 2024 | £161,744 | 6% |
36 Properties |
| 2023 | £152,486 | 4% |
38 Properties |
| 2022 | £145,950 | -1% |
48 Properties |
| 2021 | £147,810 | 6% |
50 Properties |
| 2020 | £138,880 | -6% |
25 Properties |
| 2019 | £147,206 | 20% |
36 Properties |
| 2018 | £118,415 | 4% |
45 Properties |
| 2017 | £113,919 | 6% |
51 Properties |
| 2016 | £107,403 | 5% |
51 Properties |
| 2015 | £102,132 | 11% |
43 Properties |
| 2014 | £90,838 | -25% |
48 Properties |
| 2013 | £113,122 | 12% |
24 Properties |
| 2012 | £99,596 | 1% |
30 Properties |
| 2011 | £99,029 | 2% |
34 Properties |
| 2010 | £97,315 | -12% |
19 Properties |
| 2009 | £109,217 | -2% |
25 Properties |
| 2008 | £111,920 | 5% |
25 Properties |
| 2007 | £106,597 | 3% |
74 Properties |
| 2006 | £103,299 | -22% |
109 Properties |
| 2005 | £126,467 | 14% |
154 Properties |
| 2004 | £108,644 | 34% |
149 Properties |
| 2003 | £71,851 | 17% |
86 Properties |
| 2002 | £59,808 | 11% |
103 Properties |
| 2001 | £53,103 | 8% |
83 Properties |
| 2000 | £48,602 | 13% |
63 Properties |
| 1999 | £42,425 | -9% |
49 Properties |
| 1998 | £46,342 | 6% |
54 Properties |
| 1997 | £43,431 | -13% |
61 Properties |
| 1996 | £49,089 | -0,1% |
87 Properties |
| 1995 | £49,130 | - |
91 Properties |
Property Price per Property Type in Oldbury
Here you can find historic sold price data in order to help with your property search.
The average Property Paid Price for specific property types in the last three years are:
| Property Type | Average Sold Price | Sold Properties |
|---|---|---|
| Semi Detached House | £165,227.00 | 33 Semi Detached Houses |
| Detached House | £282,277.00 | 9 Detached Houses |
| Terraced House | £164,758.00 | 31 Terraced Houses |
| Flat | £93,589.00 | 23 Flats |

