
Houses for sale in Tipton, Sandwell
House Prices in Tipton
Properties in Tipton have an average house price of £181k and had 1,130 Property Transactions within the last 3 years.¹
Tipton is an area in Sandwell with 18,225 households², where the most expensive property was sold for £620k.
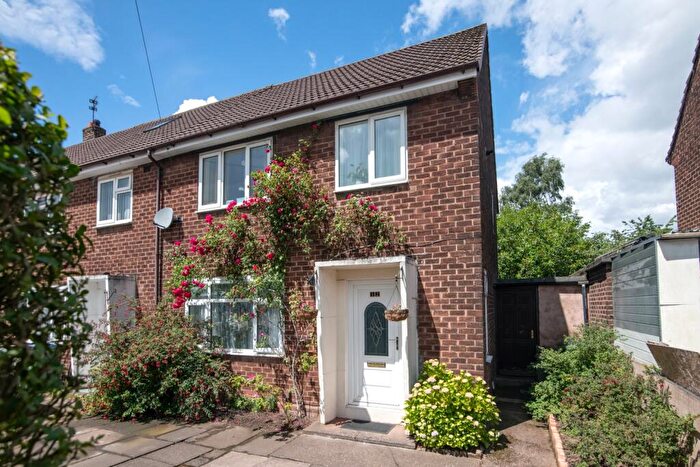
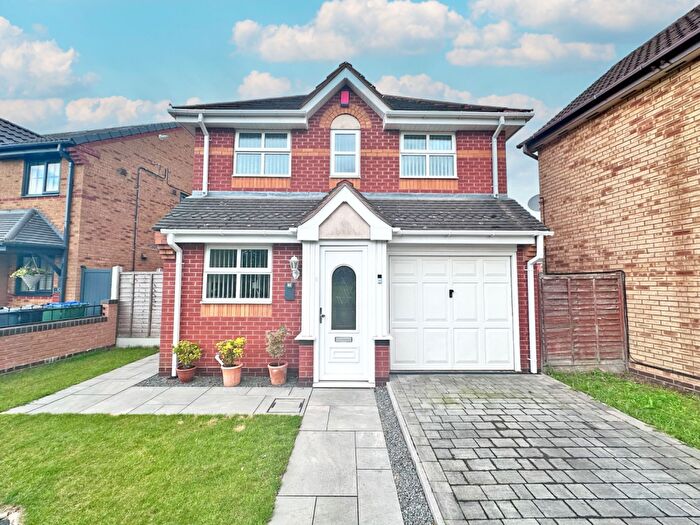
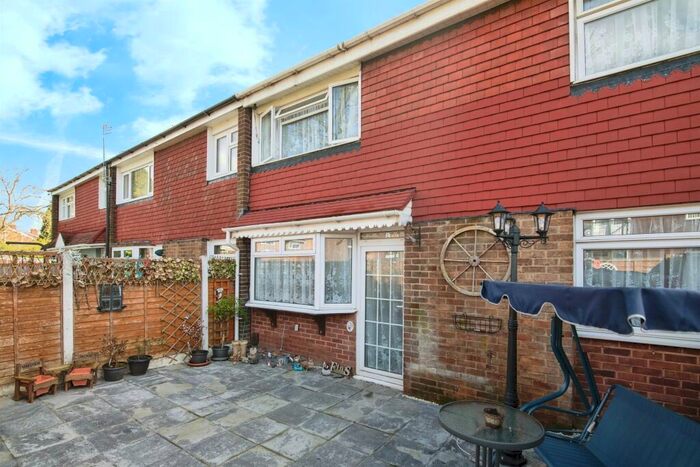
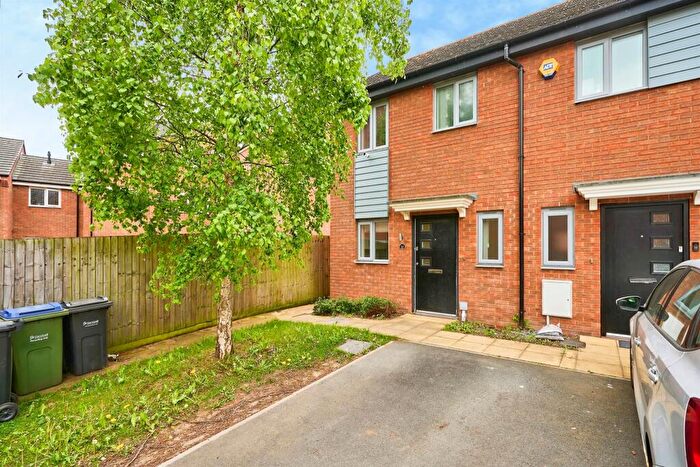
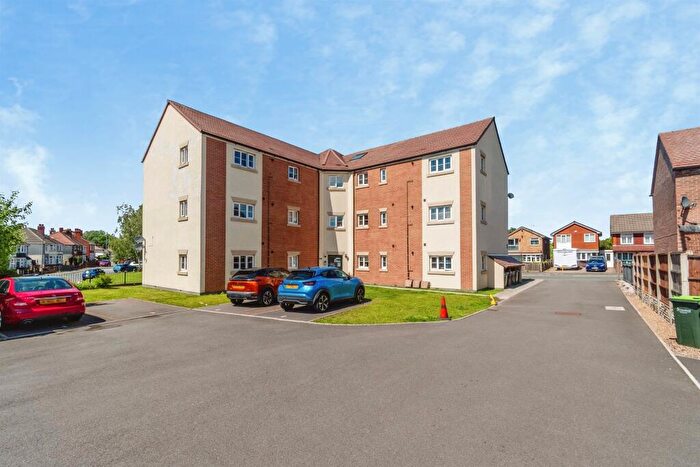
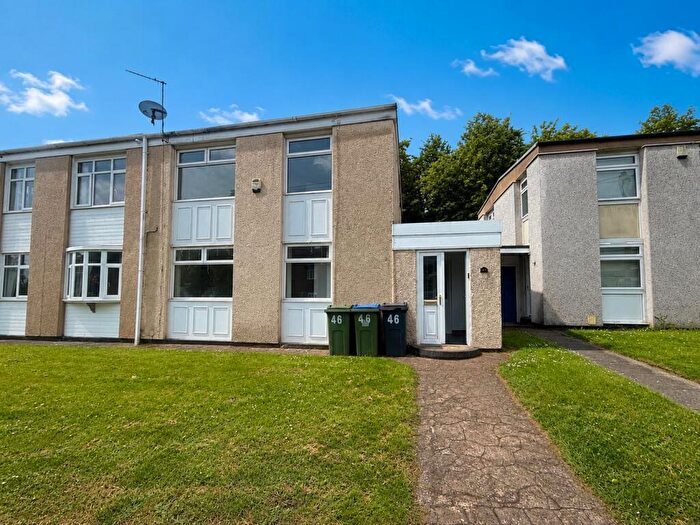
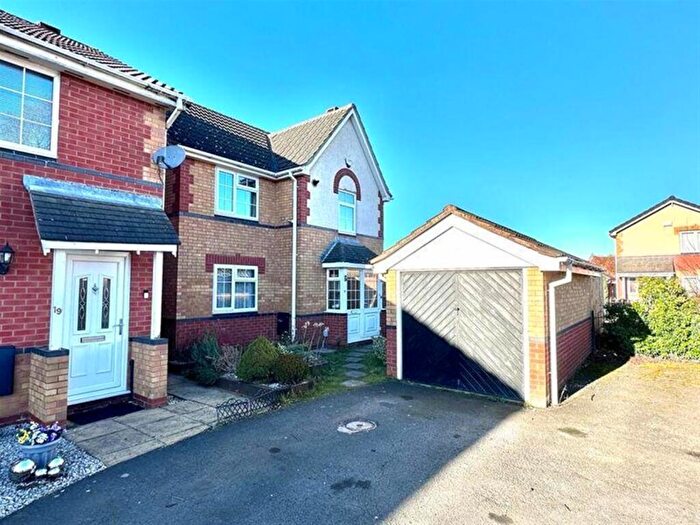
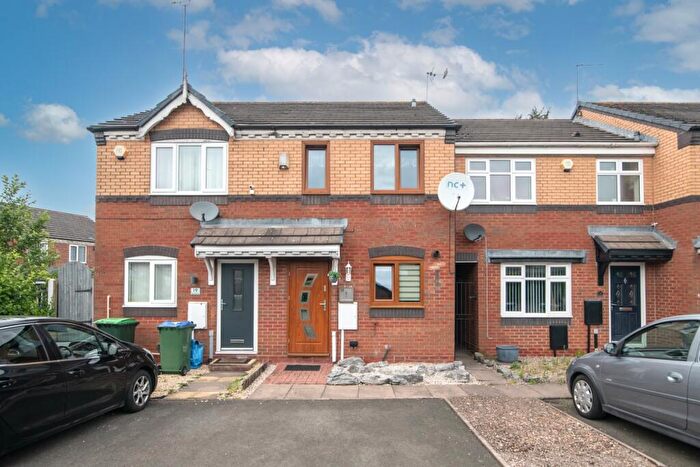
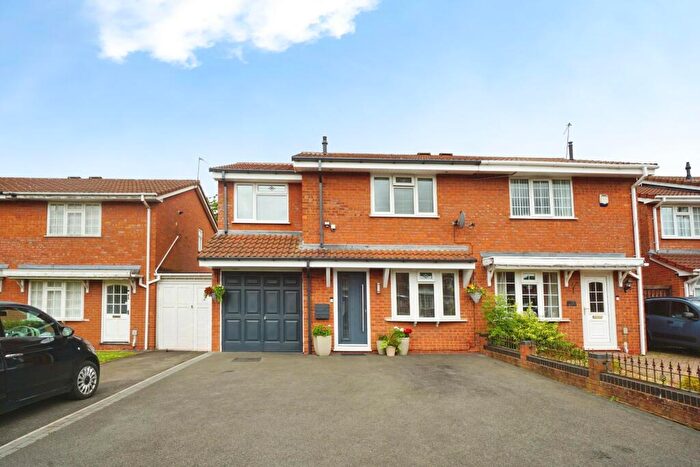
Properties for sale in Tipton
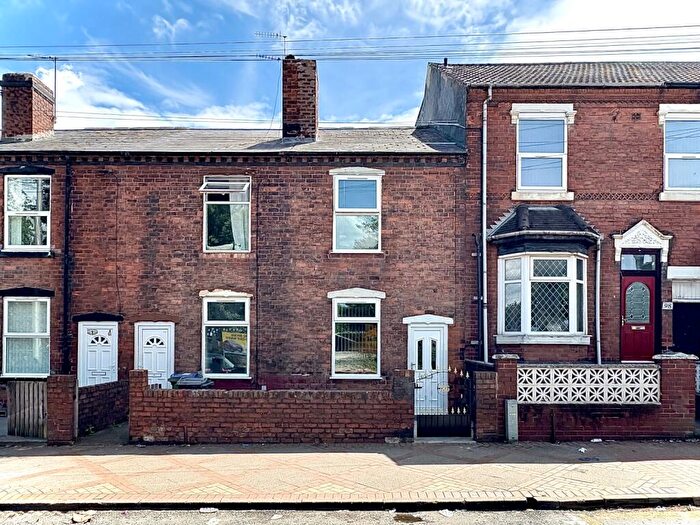
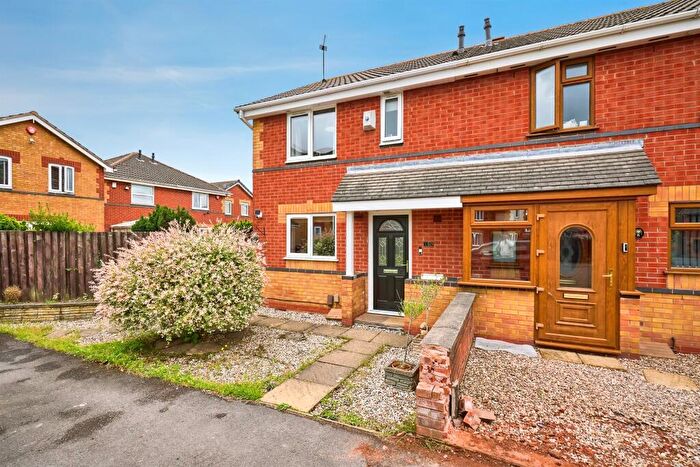
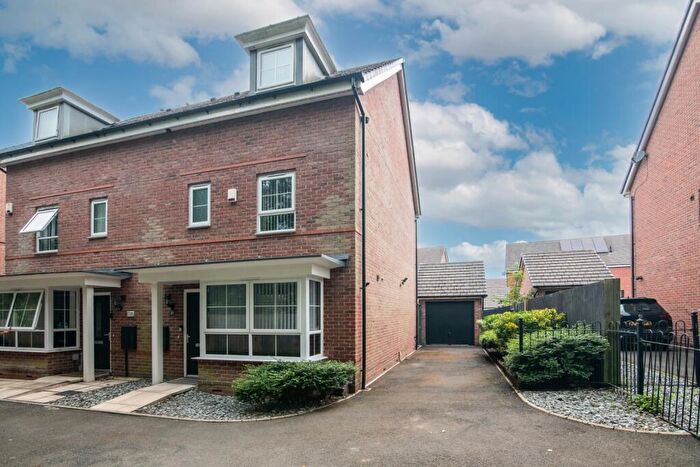
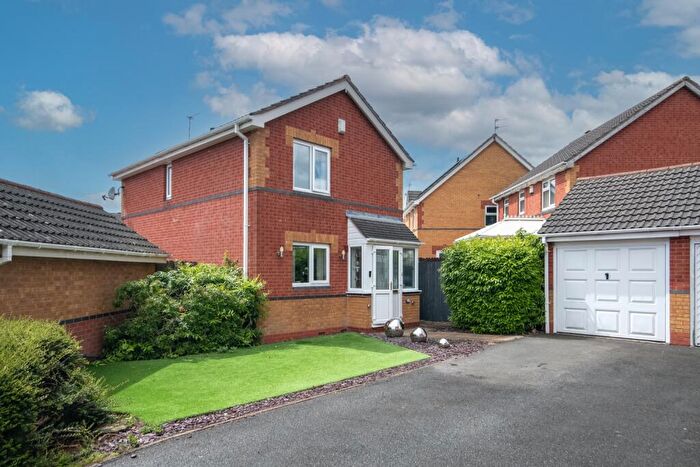
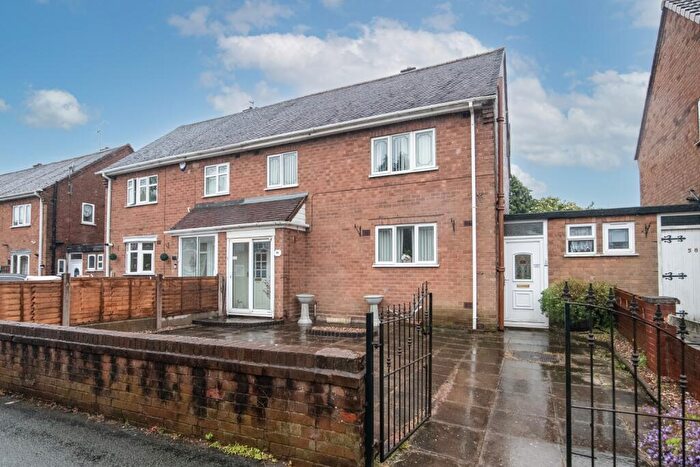
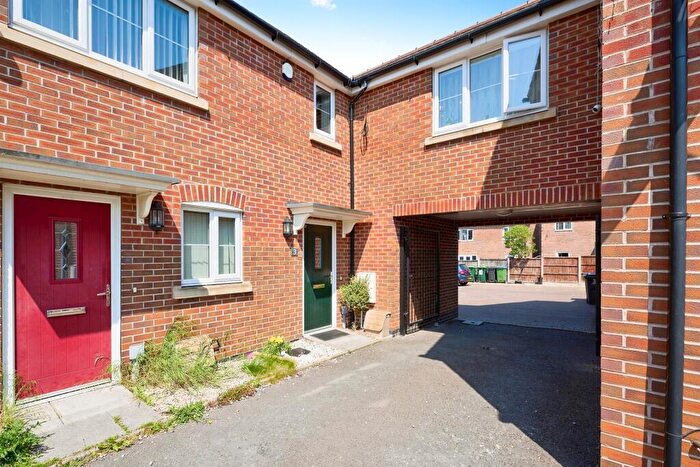
![]()
If you are looking to sell your house, let it out, or receive a property valuation, an expert can help you.
Click the button below to get started.
Neighbourhoods in Tipton
Navigate through our locations to find the location of your next house in Tipton, Sandwell for sale or to rent.
Property price trends in Tipton
According to the latest Land Registry data, the average home in Tipton sold for £183,727 in 2026. That figure comes from a substantial record of 16,276 sales logged over the past 31 years.
Prices have moved up over the last three years. Compared with 2023, when the typical sale came in around £178,908, that's a rise of roughly 2.7%.
Looking back five years, average prices are up about 16.1% since 2021, a gain of around £25,501 in cash terms.
Zoom out to the past decade for the fuller picture. Back in 2016, homes here averaged £116,365, so the typical sold price has climbed about 57.9% since then, roughly 4.7% a year. Stretch the view to fifteen years and that annual pace eases back to about 3.2%.
Frequently asked questions about Tipton
What is the average price for a property for sale in Tipton?
The average price for a property for sale in Tipton is £181,096. This amount is 12% lower than the average price in Sandwell. There are 2,614 property listings for sale in Tipton.
What locations have the most expensive properties for sale in Tipton?
The locations with the most expensive properties for sale in Tipton are Wednesbury South at an average of £240,628, Princes End at an average of £191,768 and Great Bridge at an average of £187,238.
What locations have the most affordable properties for sale in Tipton?
The locations with the most affordable properties for sale in Tipton are Oldbury at an average of £162,333 and Tipton Green at an average of £168,498.
Which train stations are available in or near Tipton?
Some of the train stations available in or near Tipton are Tipton, Dudley Port and Coseley.
Property Price Paid in Tipton by Year
The average sold property price by year was:
| Year | Average Sold Price | Price Change |
Sold Properties
|
|---|---|---|---|
| 2026 | £183,727 | -5% |
11 Properties |
| 2025 | £192,600 | 10% |
336 Properties |
| 2024 | £173,676 | -3% |
417 Properties |
| 2023 | £178,908 | 10% |
366 Properties |
| 2022 | £161,865 | 2% |
440 Properties |
| 2021 | £158,226 | 11% |
530 Properties |
| 2020 | £140,250 | 5% |
373 Properties |
| 2019 | £132,539 | 3% |
466 Properties |
| 2018 | £128,332 | 6% |
564 Properties |
| 2017 | £121,005 | 4% |
601 Properties |
Property Price per Property Type in Tipton
Here you can find historic sold price data in order to help with your property search.
The average Property Paid Price for specific property types in the last three years are:
| Property Type | Average Sold Price | Sold Properties |
|---|---|---|
| Semi Detached House | £200,463.00 | 447 Semi Detached Houses |
| Detached House | £280,074.00 | 126 Detached Houses |
| Terraced House | £183,547.00 | 324 Terraced Houses |
| Flat | £87,007.00 | 233 Flats |
Transport in Tipton
Please see below transportation links in this area:
