
Houses for sale in Derby, Bootle
House Prices in Derby
Properties in Derby have an average house price of £116k and had 475 Property Transactions within the last 3 years¹.
Derby is an area in Bootle, Sefton with 5,706 households², where the most expensive property was sold for £565k.
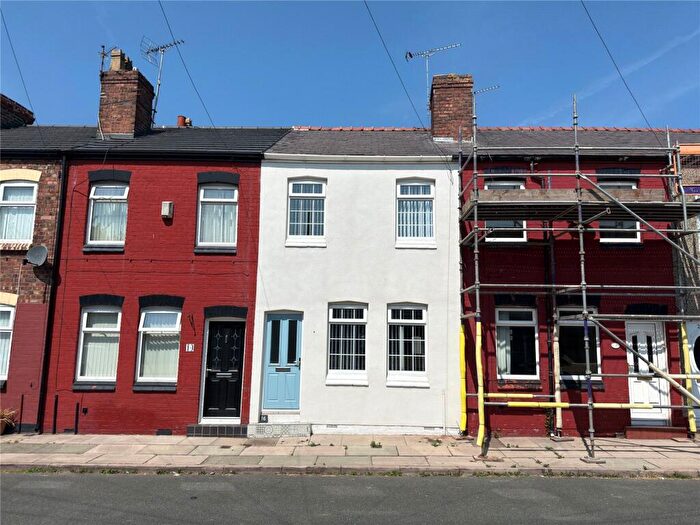
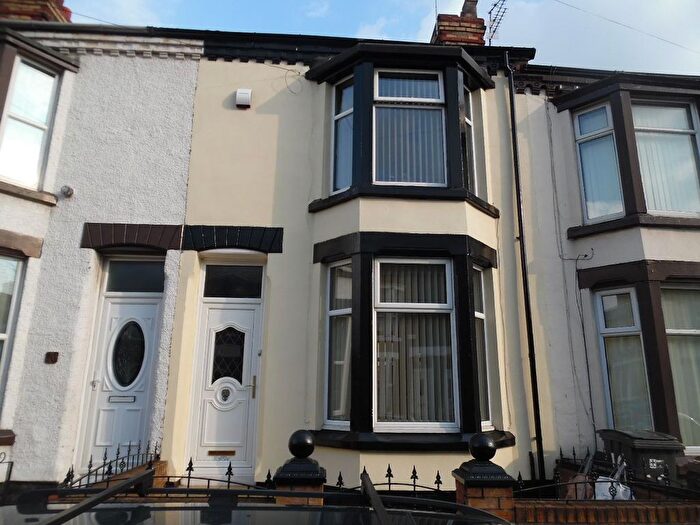
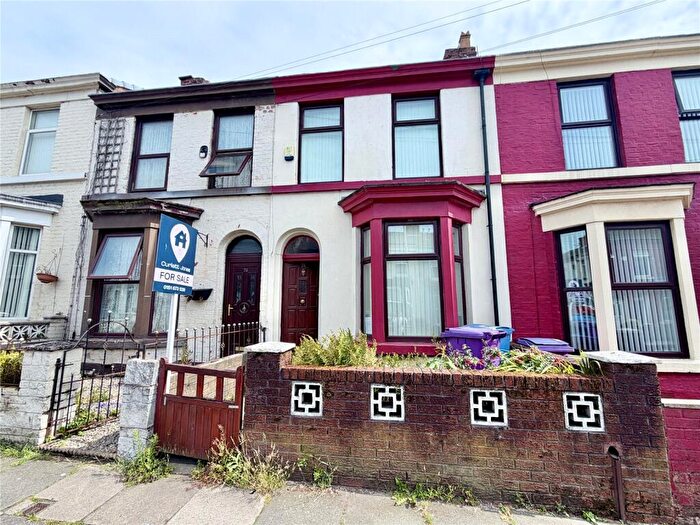
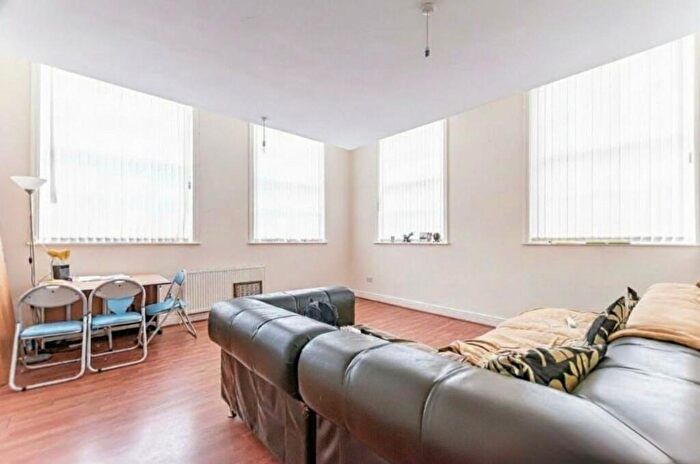
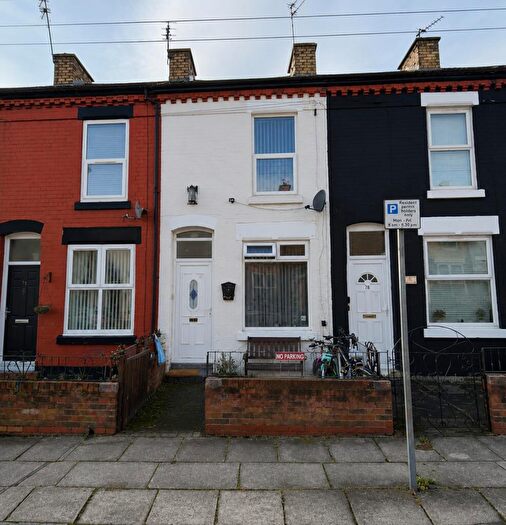
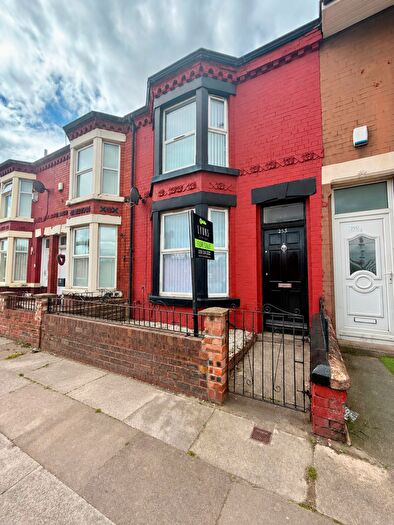
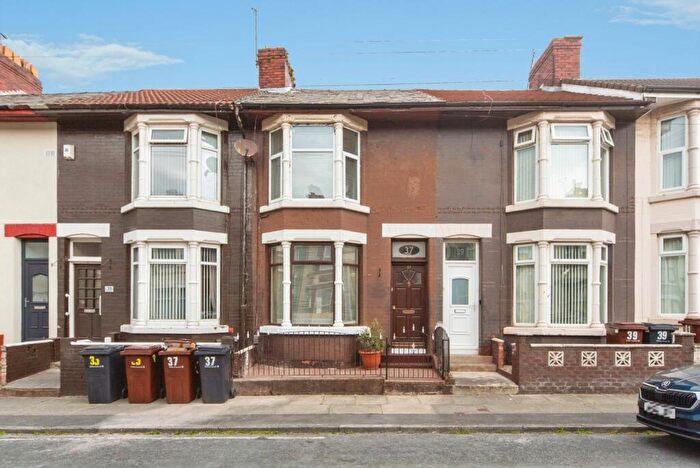
Properties for sale in Derby
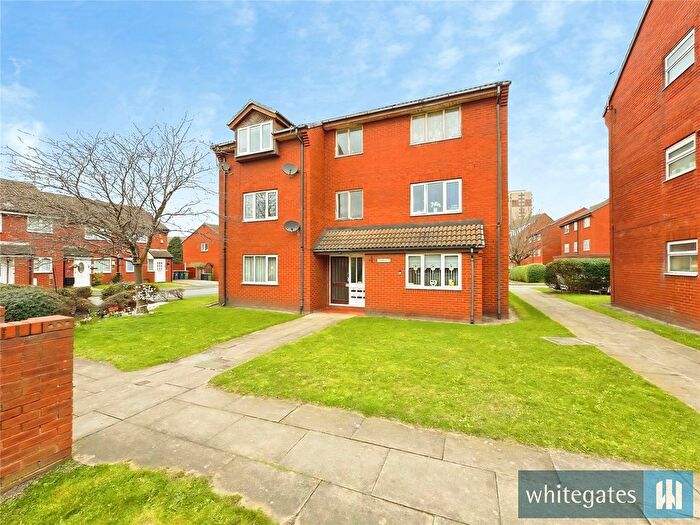
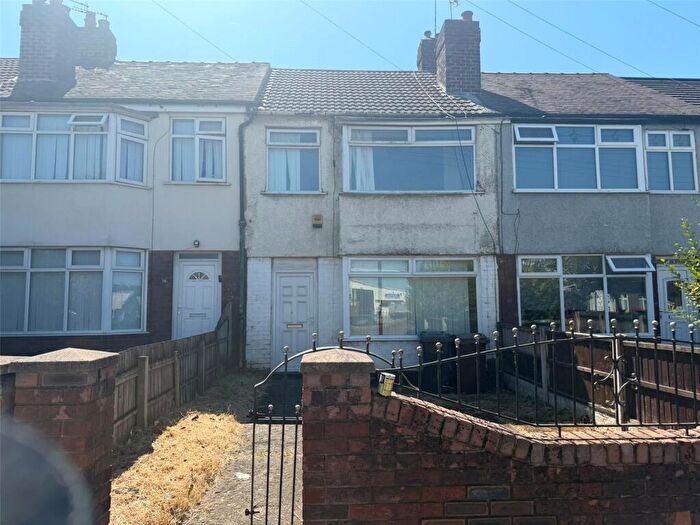
![]()
If you are looking to sell your house, let it out, or receive a property valuation, an expert can help you.
Click the button below to get started.

Roads and Postcodes in Derby
Navigate through our locations to find the location of your next house in Derby, Bootle for sale or to rent.
Property price trends in Derby
According to the latest Land Registry data, the average home in Derby sold for £133,933 in 2026. That figure comes from 4,859 sales logged over the past 31 years.
Prices have continued to climb over the last three years. Compared with 2023, when the typical sale came in around £114,970, that's a rise of roughly 16.5%.
Looking back five years, average prices are up about 27% since 2021, a gain of around £28,462 in cash terms.
Zoom out to the past decade for the fuller picture. Back in 2016, homes here averaged £79,828, so the typical sold price has climbed about 67.8% since then, roughly 5.3% a year. Stretch the view to fifteen years and that annual pace eases back to about 3.5%.
Frequently asked questions about Derby
What is the average price for a property for sale in Derby?
The average price for a property for sale in Derby is £115,968. This amount is 10% lower than the average price in Bootle. There are 1,577 property listings for sale in Derby.
What streets have the most expensive properties for sale in Derby?
The streets with the most expensive properties for sale in Derby are Oxford Avenue at an average of £270,000, Oxford Road at an average of £257,500 and Fernhill Avenue at an average of £250,000.
What streets have the most affordable properties for sale in Derby?
The streets with the most affordable properties for sale in Derby are July Street at an average of £45,000, Linacre Lane at an average of £55,000 and Balliol Road at an average of £56,875.
Which train stations are available in or near Derby?
Some of the train stations available in or near Derby are Bootle New Strand, Bootle Oriel Road and Kirkdale.
Property Price Paid in Derby by Year
The average sold property price by year was:
| Year | Average Sold Price | Price Change |
Sold Properties
|
|---|---|---|---|
| 2026 | £133,933 | 11% |
9 Properties |
| 2025 | £118,836 | 4% |
139 Properties |
| 2024 | £113,670 | -1% |
180 Properties |
| 2023 | £114,970 | 2% |
147 Properties |
| 2022 | £112,803 | 6% |
194 Properties |
| 2021 | £105,471 | 21% |
182 Properties |
| 2020 | £83,208 | -4% |
209 Properties |
| 2019 | £86,823 | -2% |
161 Properties |
| 2018 | £88,649 | 17% |
205 Properties |
| 2017 | £73,495 | -9% |
150 Properties |
Property Price per Property Type in Derby
Here you can find historic sold price data in order to help with your property search.
The average Property Paid Price for specific property types in the last three years are:
| Property Type | Average Sold Price | Sold Properties |
|---|---|---|
| Flat | £70,269.00 | 50 Flats |
| Semi Detached House | £176,831.00 | 77 Semi Detached Houses |
| Terraced House | £107,450.00 | 343 Terraced Houses |
| Detached House | £220,000.00 | 5 Detached Houses |
