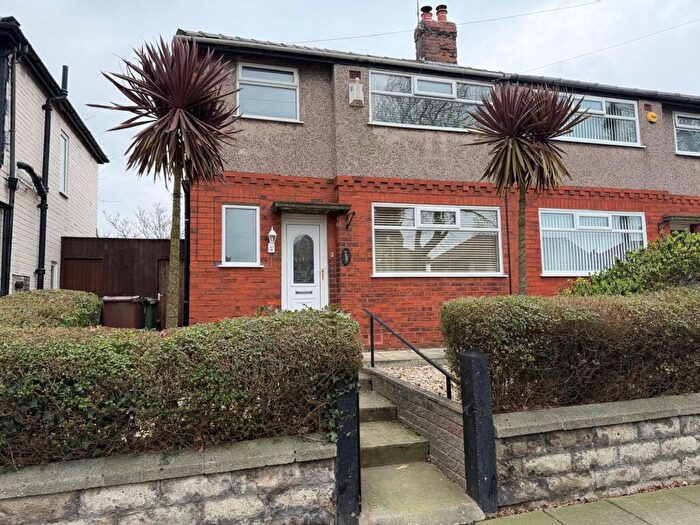
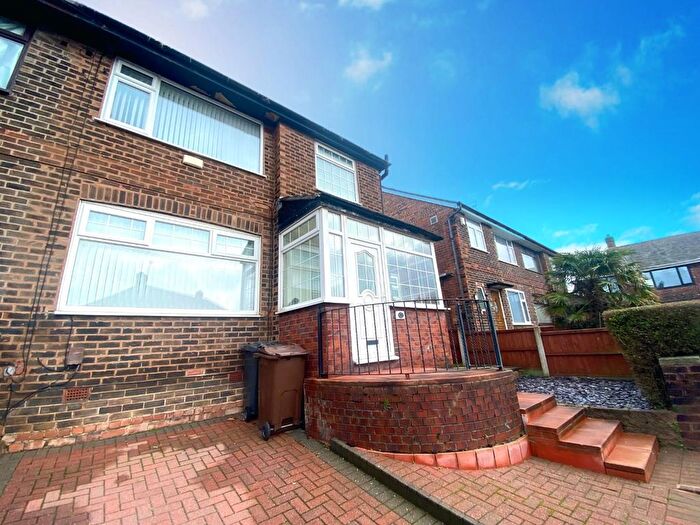
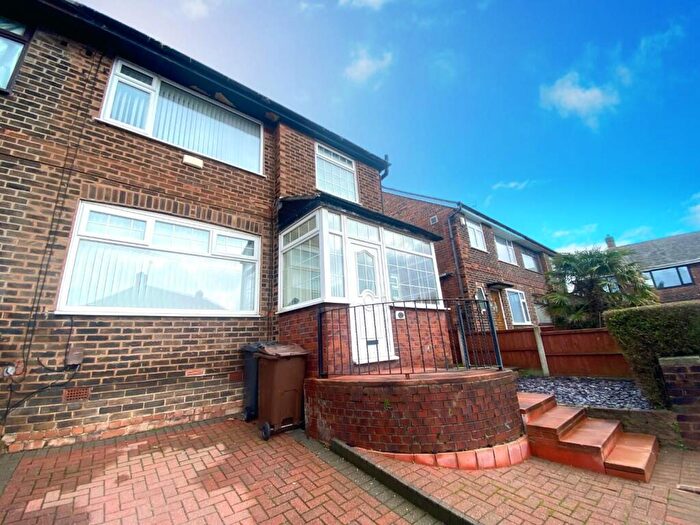
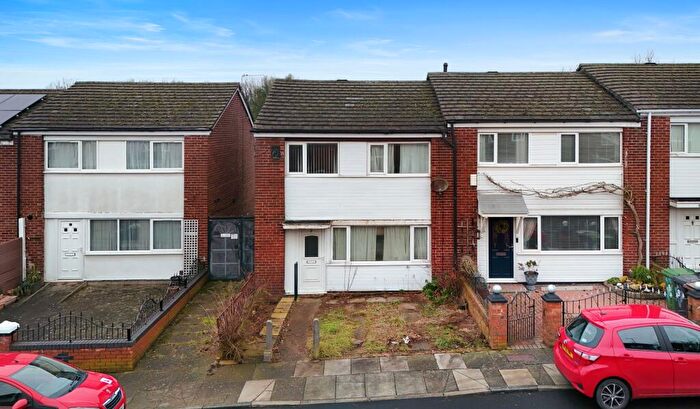
Houses for sale & to rent in Litherland, Bootle
House Prices in Litherland
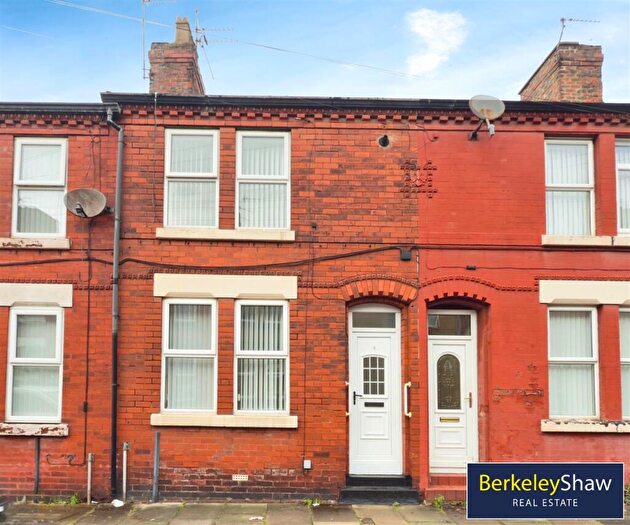
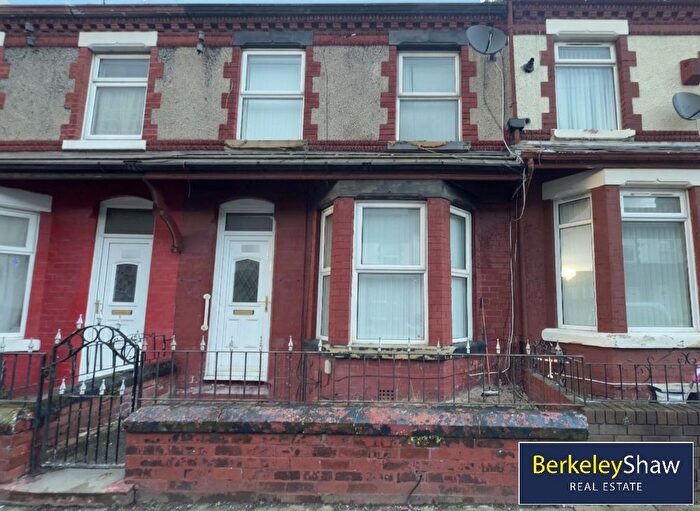
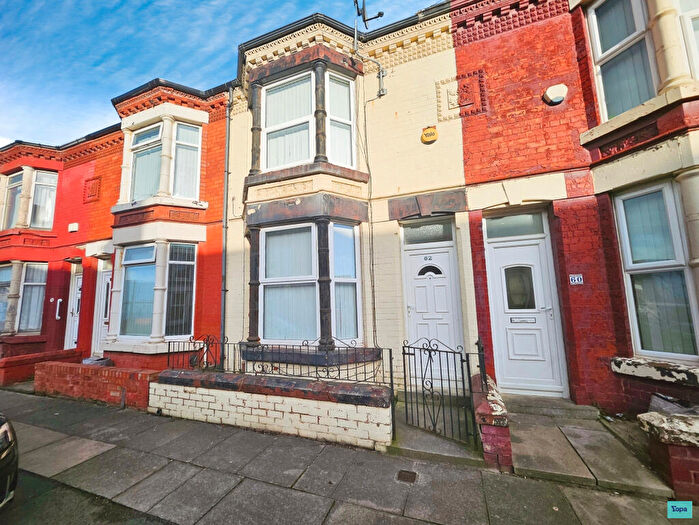
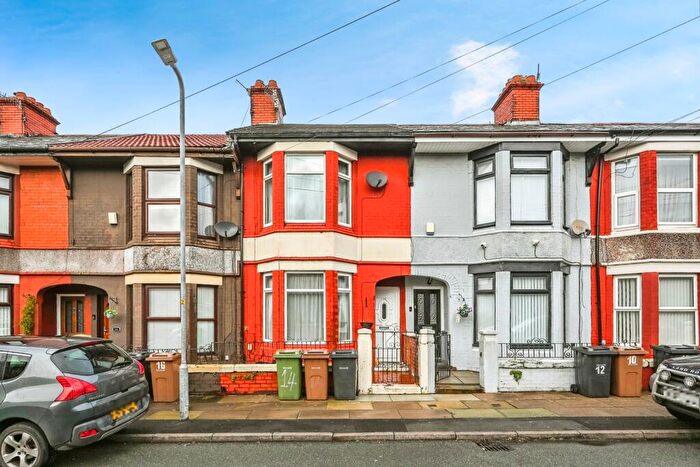
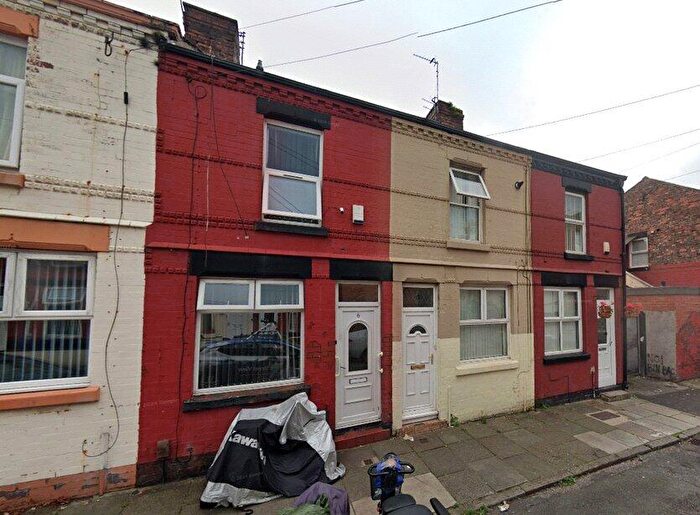
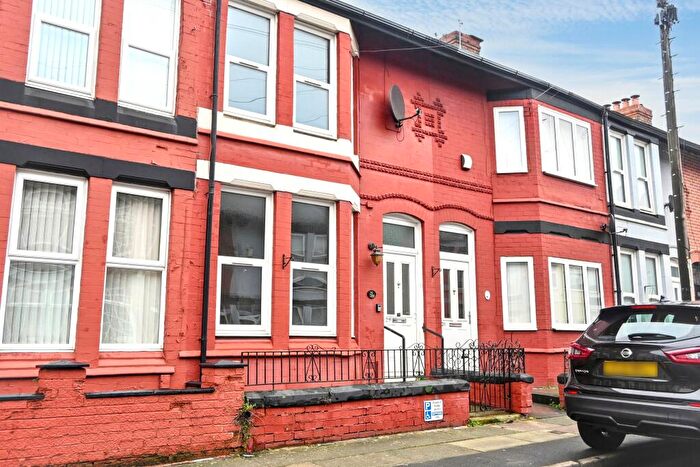
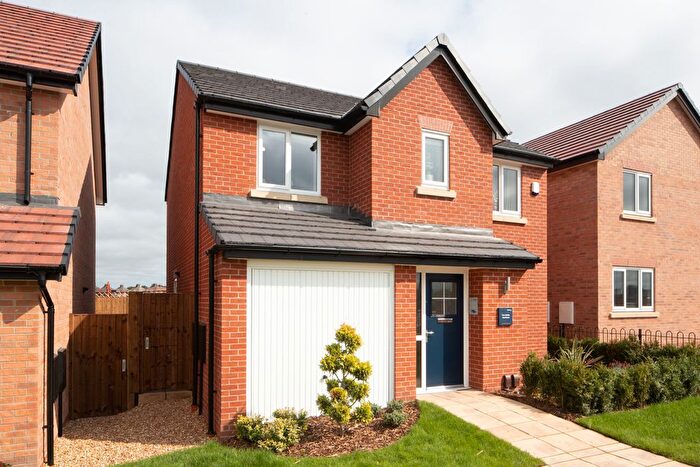
Properties in Litherland have an average house price of £133,334.00 and had 187 Property Transactions within the last 3 years¹.
Litherland is an area in Bootle, Sefton with 1,791 households², where the most expensive property was sold for £300,000.00.
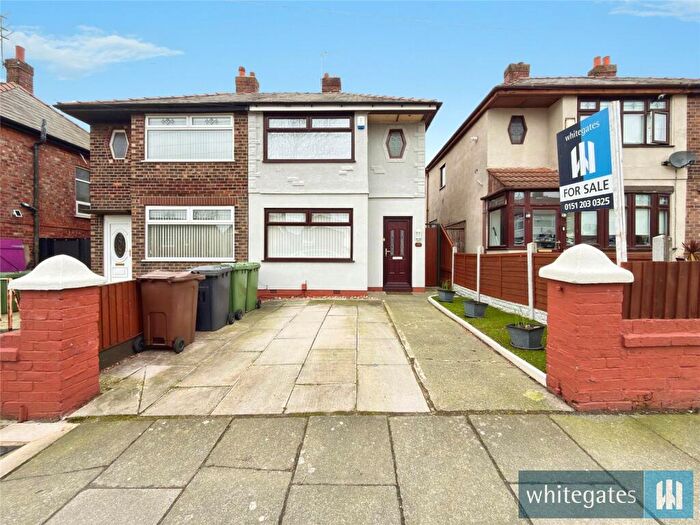
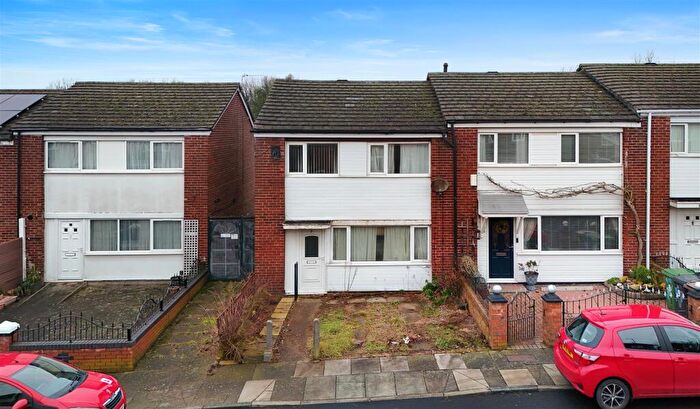
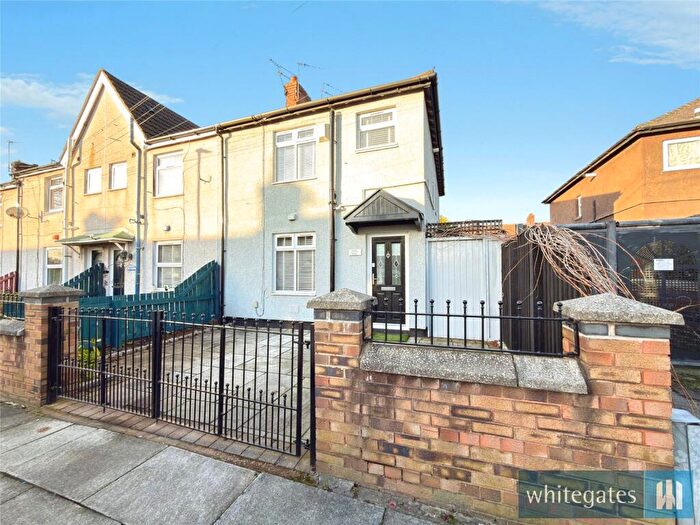
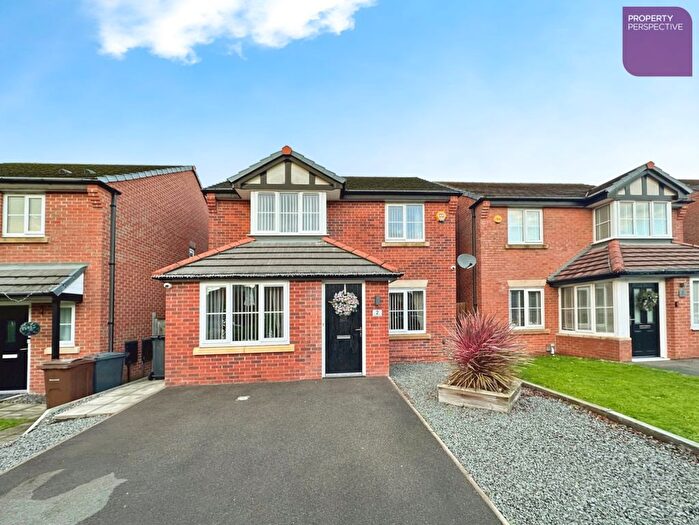
Properties for sale in Litherland
Roads and Postcodes in Litherland
Navigate through our locations to find the location of your next house in Litherland, Bootle for sale or to rent.
| Streets | Postcodes |
|---|---|
| Admiral Way | L30 9TG |
| Alt Road | L20 5ES |
| Altcar Road | L20 5ET |
| Annie Road | L20 6NG L20 6NQ |
| Arvon Street | L20 6BA |
| Atlantic Way | L30 9TB |
| Barnton Close | L20 6GD |
| Captains Close | L30 9SJ |
| Captains Lane | L30 9SU L30 9SX L30 9SY L30 9SZ |
| Croxteth Road | L20 5EA L20 5EB |
| Eleanor Road | L20 6BP L20 6BR |
| Elizabeth Road | L20 6BN L20 6BW |
| Galsworthy Avenue | L30 9SG L30 9SH L30 9SQ |
| Galsworthy Walk | L30 9SL |
| Glynne Drive | L20 6FB |
| Harris Drive | L20 6LD L20 6LE L20 6LG L30 9SE L30 9SF |
| Havelock Road | L20 6GA |
| Hawthorne Road | L20 6JU |
| Heathfield Drive | L20 6GE |
| Hermes Close | L30 9TF |
| Hornby Boulevard | L20 5DX |
| Ibstock Road | L20 5DY L20 5DZ |
| Invincible Close | L30 9TD |
| Ken Mews | L20 6GF |
| Knowsley Road | L20 5DE L20 5DD L20 5DF |
| Lathom Road | L20 5EL |
| Librex Close | L20 6GG |
| Linacre Lane | L20 5AG L20 5AQ |
| Litherland Road | L20 5EE L20 5EF L20 5EG L20 5EH L20 5EQ |
| Lunt Road | L20 5EY L20 5EZ |
| Lydiate Road | L20 5EJ |
| Malvern Road | L20 5DS |
| Margaret Avenue | L20 6LJ L20 6LL |
| Marion Road | L20 6NA L20 6NB |
| Markfield Road | L20 5DT L20 5DU |
| Mary Road | L20 6LR L20 6LS |
| Masefield Crescent | L30 9SR L30 9SS |
| Masefield Place | L30 9ST |
| Melville Road | L20 6ND L20 6NE L20 6NF |
| Mildmay Road | L20 5EN |
| Mona Street | L20 6BJ |
| Monfa Road | L20 6JS L20 6LP |
| Netherton Way | L30 9SP |
| Norman Road | L20 6NH L20 6NJ |
| Patricia Grove | L20 6LT |
| Province Road | L20 6DG |
| Rose Avenue | L20 6LN L20 6LW |
| Rufford Road | L20 5EP L20 5ER |
| Springwell Road | L20 6LU L20 6LX |
| St Andrews Road | L20 5EX |
| St Elizabeth Avenue | L20 6FA |
| Staley Drive | L20 6FG |
| Stanley Road | L20 5DN L20 5DW |
| Starling Way | L30 9TA |
| Thackeray Gardens | L30 9SA L30 9SB L30 9SD |
| The Grange | L20 5EU |
| Thornton Road | L20 5ED |
| Victory Close | L30 9TE |
| Walker Drive | L20 6NL L20 6NN |
| Willard Street | L20 6BY |
Transport near Litherland
-
Seaforth and Litherland Station
-
Bootle New Strand Station
-
Orrell Park Station
-
Walton (Merseyside) Station
-
Rice Lane Station
-
Bootle Oriel Road Station
-
Aintree Station
-
Kirkdale Station
-
Waterloo (Merseyside) Station
-
Bank Hall Station
- FAQ
- Price Paid By Year
- Property Type Price
Frequently asked questions about Litherland
What is the average price for a property for sale in Litherland?
The average price for a property for sale in Litherland is £133,334. This amount is 3% higher than the average price in Bootle. There are 1,353 property listings for sale in Litherland.
What streets have the most expensive properties for sale in Litherland?
The streets with the most expensive properties for sale in Litherland are Marion Road at an average of £250,000, Willard Street at an average of £210,500 and Havelock Road at an average of £200,000.
What streets have the most affordable properties for sale in Litherland?
The streets with the most affordable properties for sale in Litherland are Captains Lane at an average of £77,583, Stanley Road at an average of £85,000 and Lunt Road at an average of £85,099.
Which train stations are available in or near Litherland?
Some of the train stations available in or near Litherland are Seaforth and Litherland, Bootle New Strand and Orrell Park.
Property Price Paid in Litherland by Year
The average sold property price by year was:
| Year | Average Sold Price | Price Change |
Sold Properties
|
|---|---|---|---|
| 2025 | £145,032 | 9% |
55 Properties |
| 2024 | £132,221 | 5% |
61 Properties |
| 2023 | £125,230 | -5% |
71 Properties |
| 2022 | £131,518 | 7% |
67 Properties |
| 2021 | £122,600 | -3% |
87 Properties |
| 2020 | £126,260 | 14% |
72 Properties |
| 2019 | £109,018 | 5% |
76 Properties |
| 2018 | £103,561 | 10% |
64 Properties |
| 2017 | £93,271 | -2% |
44 Properties |
| 2016 | £94,679 | 0,3% |
39 Properties |
| 2015 | £94,404 | -18% |
57 Properties |
| 2014 | £111,625 | 9% |
79 Properties |
| 2013 | £101,405 | -12% |
51 Properties |
| 2012 | £113,718 | 21% |
48 Properties |
| 2011 | £89,870 | 11% |
43 Properties |
| 2010 | £79,535 | -36% |
28 Properties |
| 2009 | £107,846 | -1% |
30 Properties |
| 2008 | £108,800 | 11% |
68 Properties |
| 2007 | £96,485 | 9% |
88 Properties |
| 2006 | £87,435 | 18% |
83 Properties |
| 2005 | £71,372 | 11% |
82 Properties |
| 2004 | £63,847 | 30% |
91 Properties |
| 2003 | £44,927 | 14% |
60 Properties |
| 2002 | £38,813 | 11% |
73 Properties |
| 2001 | £34,523 | 13% |
70 Properties |
| 2000 | £29,928 | -6% |
59 Properties |
| 1999 | £31,826 | 16% |
57 Properties |
| 1998 | £26,732 | -14% |
59 Properties |
| 1997 | £30,457 | 4% |
77 Properties |
| 1996 | £29,120 | -5% |
55 Properties |
| 1995 | £30,436 | - |
45 Properties |
Property Price per Property Type in Litherland
Here you can find historic sold price data in order to help with your property search.
The average Property Paid Price for specific property types in the last three years are:
| Property Type | Average Sold Price | Sold Properties |
|---|---|---|
| Semi Detached House | £173,244.00 | 63 Semi Detached Houses |
| Detached House | £246,000.00 | 5 Detached Houses |
| Terraced House | £110,152.00 | 113 Terraced Houses |
| Flat | £57,000.00 | 6 Flats |

