
Houses for sale & to rent in Dukes, Southport
House Prices in Dukes
Properties in Dukes have an average house price of £241k and had 728 Property Transactions within the last 3 years¹.
Dukes is an area in Southport, Sefton with 6,647 households², where the most expensive property was sold for £2.2M.
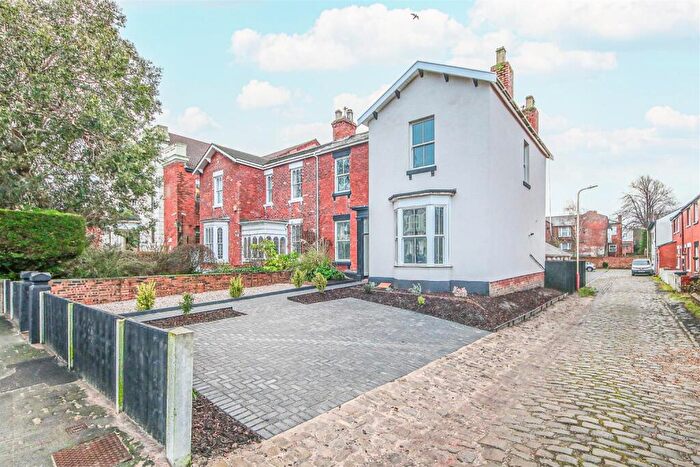
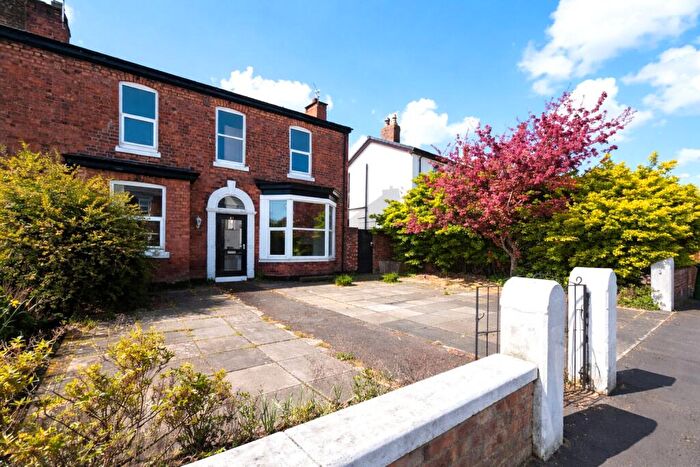
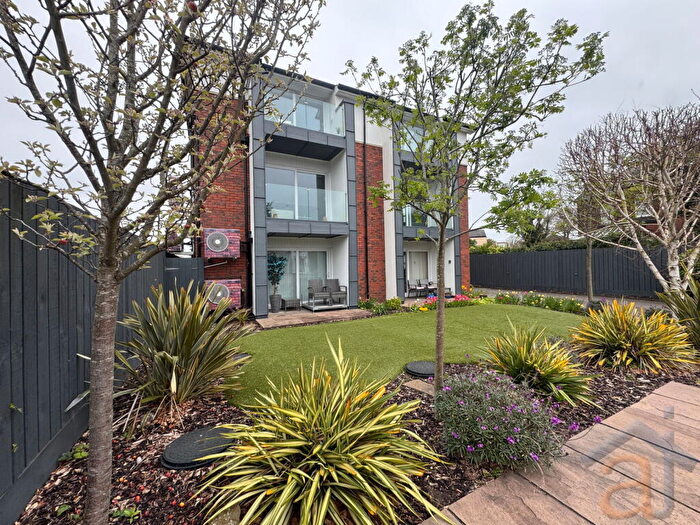
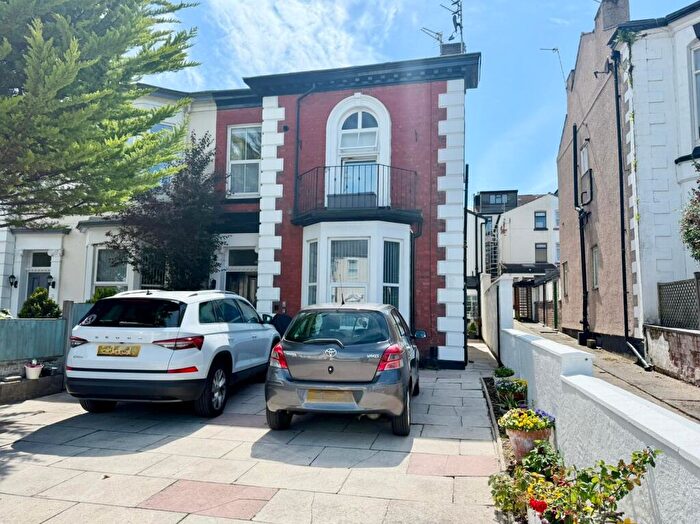
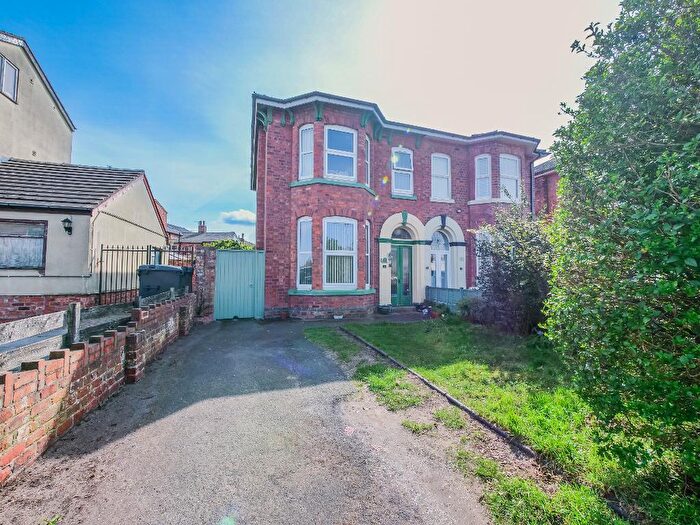
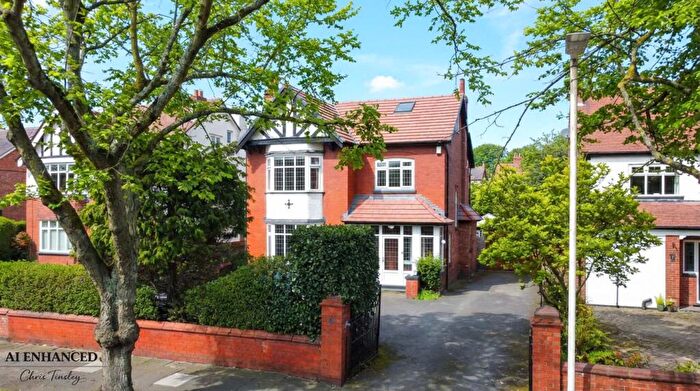
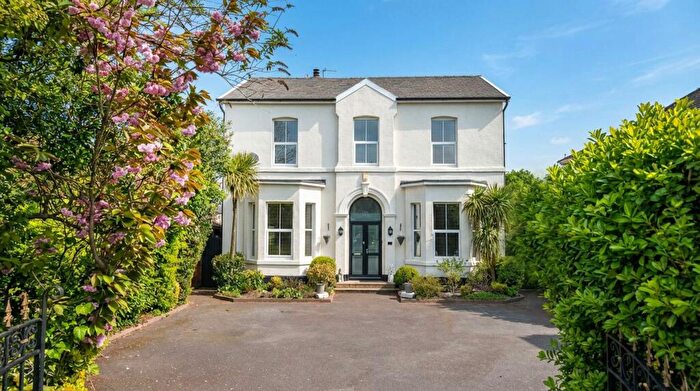
Properties for sale in Dukes

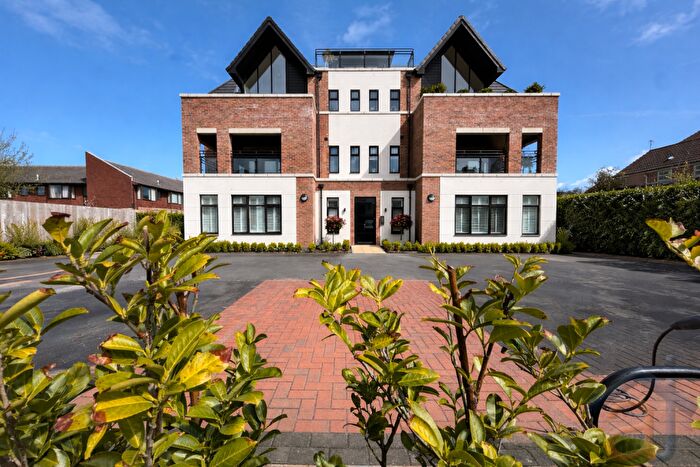

![]()
If you are looking to sell your house, let it out, or receive a property valuation, an expert can help you.
Click the button below to get started.
Roads and Postcodes in Dukes
Navigate through our locations to find the location of your next house in Dukes, Southport for sale or to rent.
Transport near Dukes

- FAQ
- Price Paid By Year
- Property Type Price
Frequently asked questions about Dukes
What is the average price for a property for sale in Dukes?
The average price for a property for sale in Dukes is £241,075. This amount is 2% higher than the average price in Southport. There are 2,847 property listings for sale in Dukes.
What streets have the most expensive properties for sale in Dukes?
The streets with the most expensive properties for sale in Dukes are Coronation Walk at an average of £1,750,000, Westbourne Road at an average of £842,474 and Sherringham Road at an average of £805,000.
What streets have the most affordable properties for sale in Dukes?
The streets with the most affordable properties for sale in Dukes are Hoghton Street at an average of £39,000, Sandringham Court at an average of £39,500 and Kenworthys Flats at an average of £60,770.
Which train stations are available in or near Dukes?
Some of the train stations available in or near Dukes are Birkdale, Southport and Hillside.
Property Price Paid in Dukes by Year
The average sold property price by year was:
| Year | Average Sold Price | Price Change |
Sold Properties
|
|---|---|---|---|
| 2026 | £292,654 | 11% |
5 Properties |
| 2025 | £261,331.73 | 14% |
222 Properties |
| 2024 | £223,439.81 | -7% |
242 Properties |
| 2023 | £239,193.07 | -7% |
259 Properties |
| 2022 | £255,661.15 | 6% |
321 Properties |
| 2021 | £240,112.73 | -4% |
352 Properties |
| 2020 | £250,234.47 | 2% |
250 Properties |
| 2019 | £244,636.78 | 11% |
310 Properties |
| 2018 | £217,559.93 | -6% |
290 Properties |
| 2017 | £231,168.41 | 14% |
309 Properties |
| 2016 | £199,270 | 9% |
346 Properties |
| 2015 | £180,729.82 | -7% |
275 Properties |
| 2014 | £193,934.17 | -4% |
252 Properties |
| 2013 | £200,905 | 18% |
245 Properties |
| 2012 | £165,417.26 | -11% |
159 Properties |
| 2011 | £184,268 | -3% |
163 Properties |
| 2010 | £190,471 | -8% |
145 Properties |
| 2009 | £205,965 | 6% |
142 Properties |
| 2008 | £194,471 | -9% |
199 Properties |
| 2007 | £211,235.52 | -1% |
417 Properties |
| 2006 | £214,315.42 | 9% |
349 Properties |
| 2005 | £194,760 | 6% |
298 Properties |
| 2004 | £182,817.69 | 18% |
400 Properties |
| 2003 | £149,560.57 | 10% |
418 Properties |
| 2002 | £134,575.73 | 10% |
452 Properties |
| 2001 | £120,634.93 | 19% |
406 Properties |
| 2000 | £98,084 | 9% |
320 Properties |
| 1999 | £89,431 | 10% |
356 Properties |
| 1998 | £80,873.51 | -3% |
301 Properties |
| 1997 | £83,011 | -3% |
289 Properties |
| 1996 | £85,299 | 9% |
280 Properties |
| 1995 | £77,389.87 | - |
202 Properties |
Property Price per Property Type in Dukes
Here you can find historic sold price data in order to help with your property search.
The average Property Paid Price for specific property types in the last three years are:
| Property Type | Average Sold Price | Sold Properties |
|---|---|---|
| Flat | £153,478.35 | 437 Flats |
| Semi Detached House | £253,421.63 | 111 Semi Detached Houses |
| Detached House | £615,568.00 | 103 Detached Houses |
| Terraced House | £219,466.88 | 77 Terraced Houses |