
Houses for sale in Southport, Sefton
House Prices in Southport
Properties in Southport have an average house price of £237k and had 4,479 Property Transactions within the last 3 years.¹
Southport is an area in Sefton with 39,868 households², where the most expensive property was sold for £2.2M.
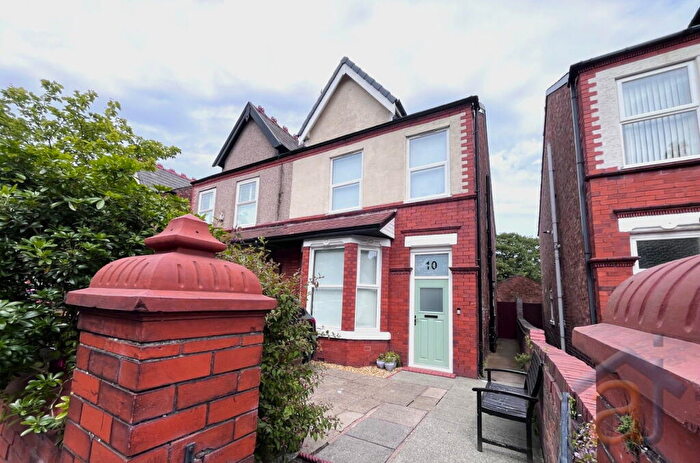
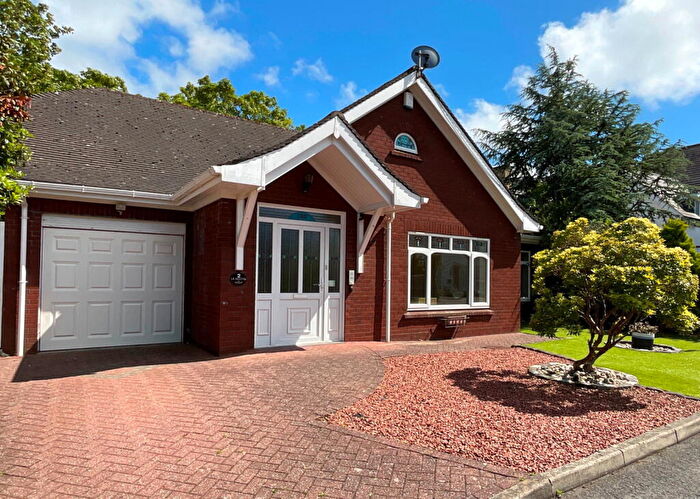
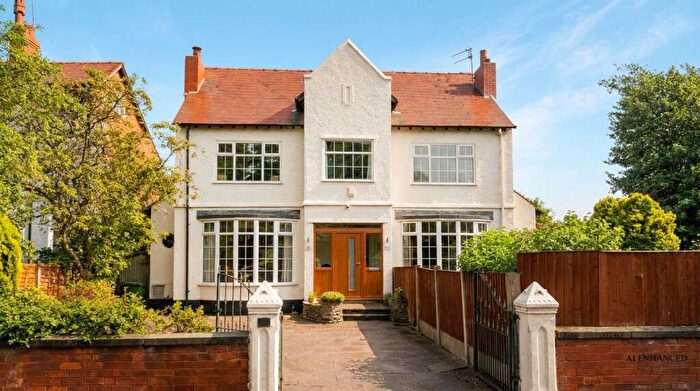
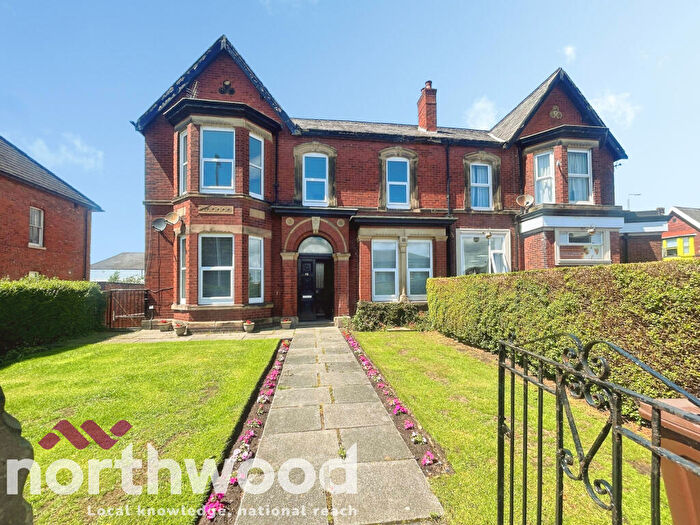
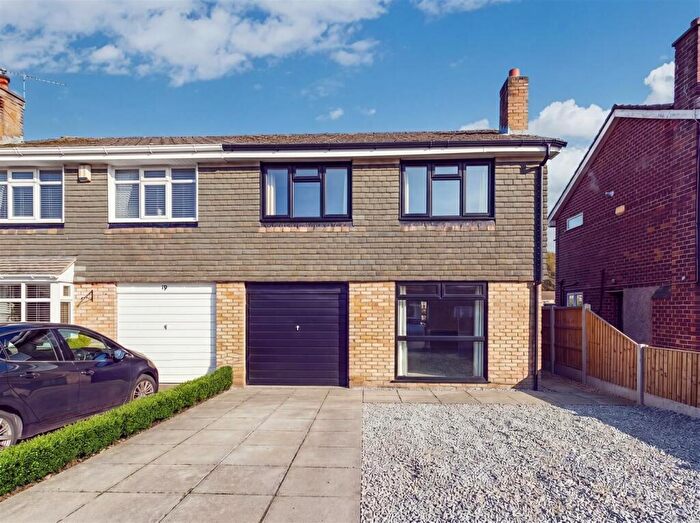
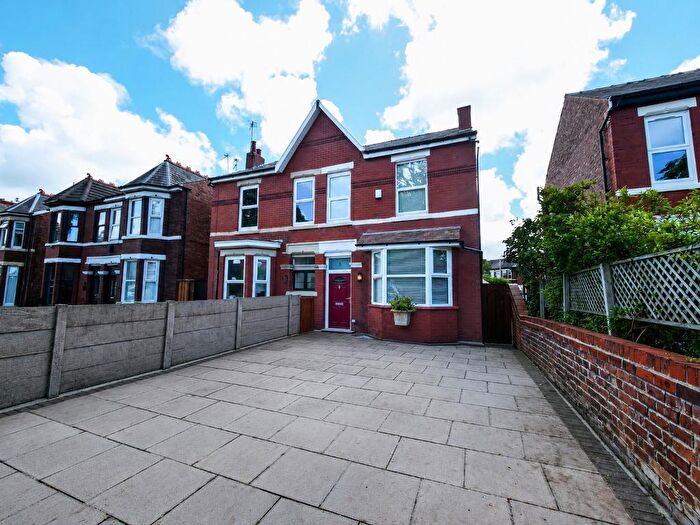
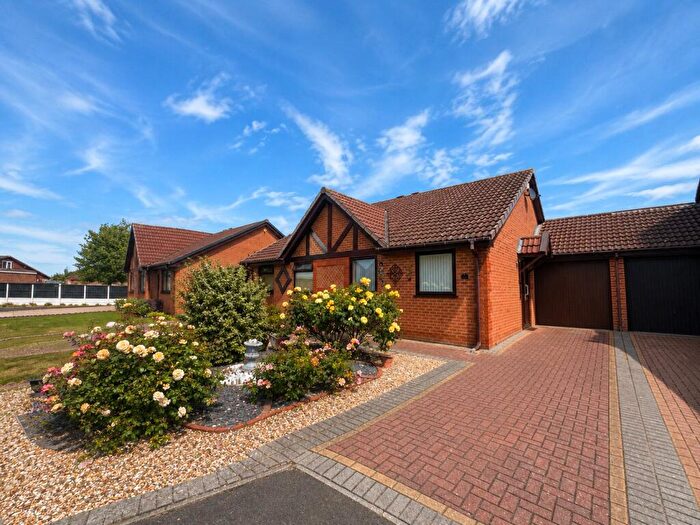
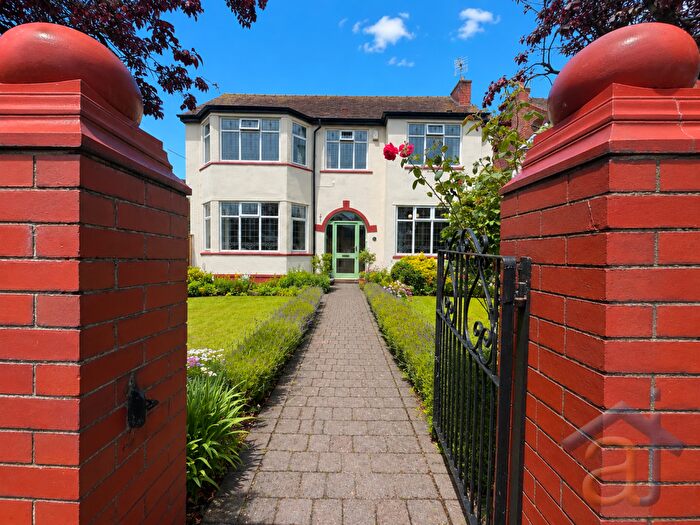
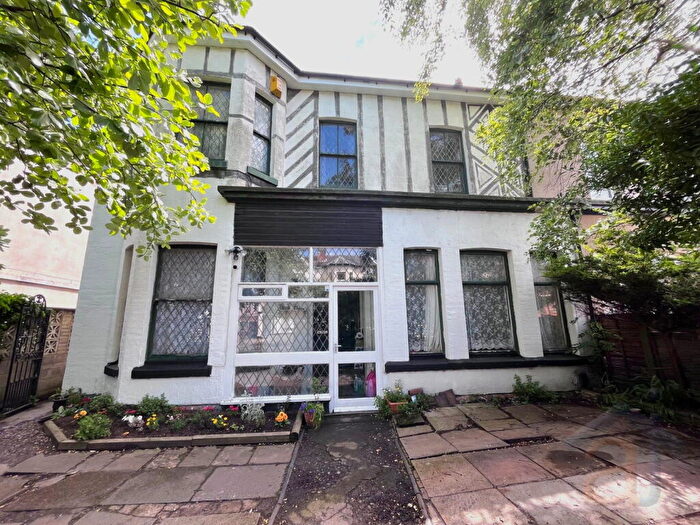
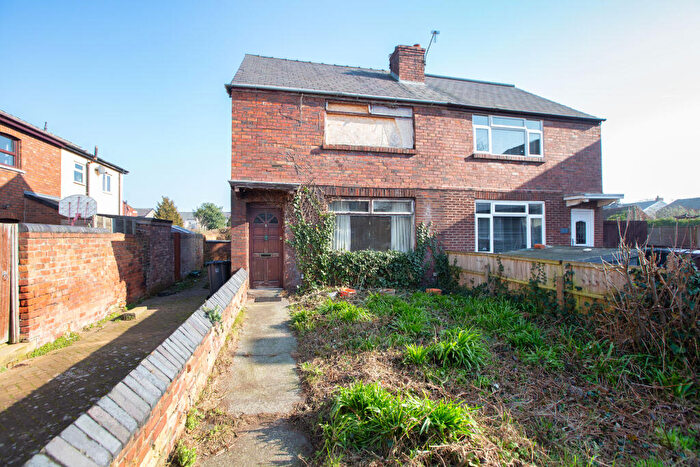
Properties for sale in Southport
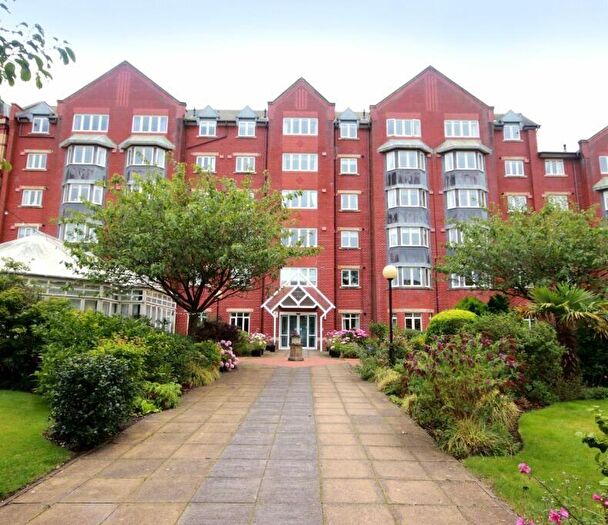
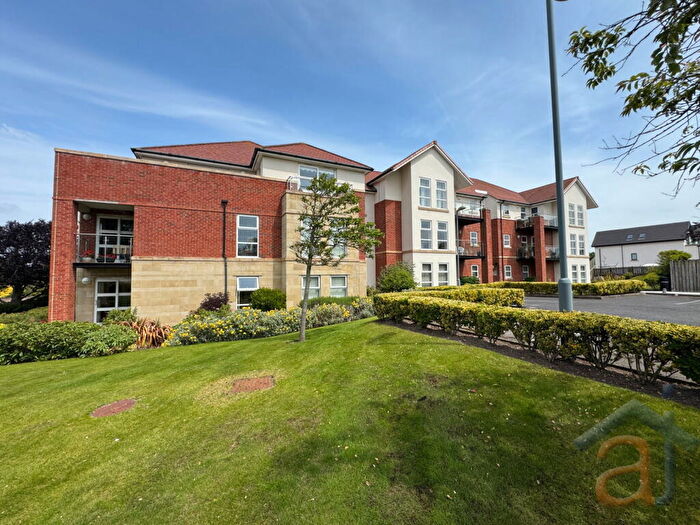
![]()
If you are looking to sell your house, let it out, or receive a property valuation, an expert can help you.
Click the button below to get started.
Neighbourhoods in Southport
Navigate through our locations to find the location of your next house in Southport, Sefton for sale or to rent.
Property price trends in Southport
According to the latest Land Registry data, the average home in Southport sold for £218,958 in 2026. That figure comes from a substantial record of 51,413 sales logged over the past 31 years.
Prices have fallen back over the last three years. Compared with 2023, when the typical sale came in around £234,255, that's a fall of roughly 6.5%.
Looking back five years, average prices are down about 1.1% since 2021, a drop of around £2,528 in cash terms.
Zoom out to the past decade for the fuller picture. Back in 2016, homes here averaged £180,739, so the typical sold price has climbed about 21.1% since then, roughly 1.9% a year. Stretch the view to fifteen years and that annual pace holds at about 2%.
Frequently asked questions about Southport
What is the average price for a property for sale in Southport?
The average price for a property for sale in Southport is £237,175. This amount is 1% higher than the average price in Sefton. There are 6,048 property listings for sale in Southport.
What locations have the most expensive properties for sale in Southport?
The locations with the most expensive properties for sale in Southport are Ainsdale at an average of £283,399, Birkdale at an average of £275,256 and Meols at an average of £242,761.
What locations have the most affordable properties for sale in Southport?
The locations with the most affordable properties for sale in Southport are Norwood at an average of £202,704, Cambridge at an average of £208,794 and Kew at an average of £219,646.
Which train stations are available in or near Southport?
Some of the train stations available in or near Southport are Southport, Birkdale and Meols Cop.
Property Price Paid in Southport by Year
The average sold property price by year was:
| Year | Average Sold Price | Price Change |
Sold Properties
|
|---|---|---|---|
| 2026 | £218,958 | -11% |
84 Properties |
| 2025 | £243,595 | 3% |
1,384 Properties |
| 2024 | £235,204 | 0,4% |
1,512 Properties |
| 2023 | £234,255 | 1% |
1,499 Properties |
| 2022 | £232,455 | 5% |
1,872 Properties |
| 2021 | £221,486 | 5% |
2,119 Properties |
| 2020 | £210,545 | 4% |
1,547 Properties |
| 2019 | £201,755 | 5% |
1,786 Properties |
| 2018 | £191,721 | 1% |
1,675 Properties |
| 2017 | £190,705 | 5% |
1,710 Properties |
Property Price per Property Type in Southport
Here you can find historic sold price data in order to help with your property search.
The average Property Paid Price for specific property types in the last three years are:
| Property Type | Average Sold Price | Sold Properties |
|---|---|---|
| Semi Detached House | £225,665.00 | 2,230 Semi Detached Houses |
| Terraced House | £193,816.00 | 377 Terraced Houses |
| Detached House | £408,206.00 | 835 Detached Houses |
| Flat | £139,974.00 | 1,037 Flats |
Transport in Southport
Please see below transportation links in this area:
