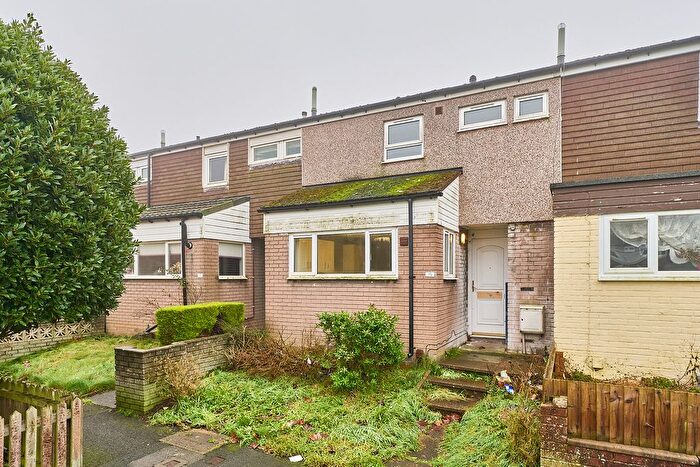
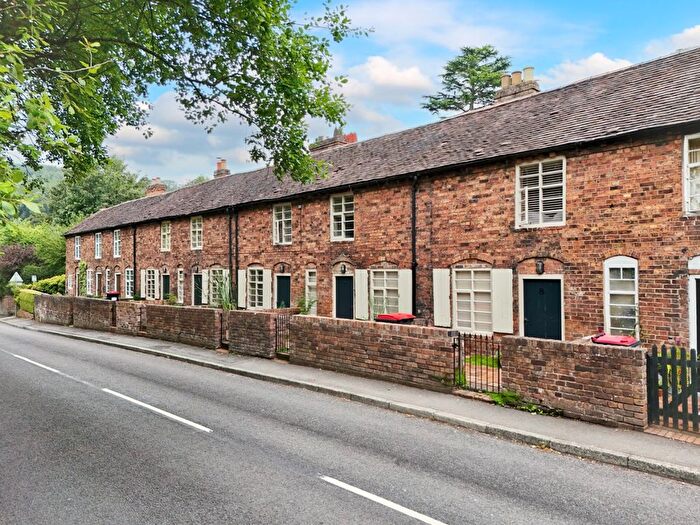
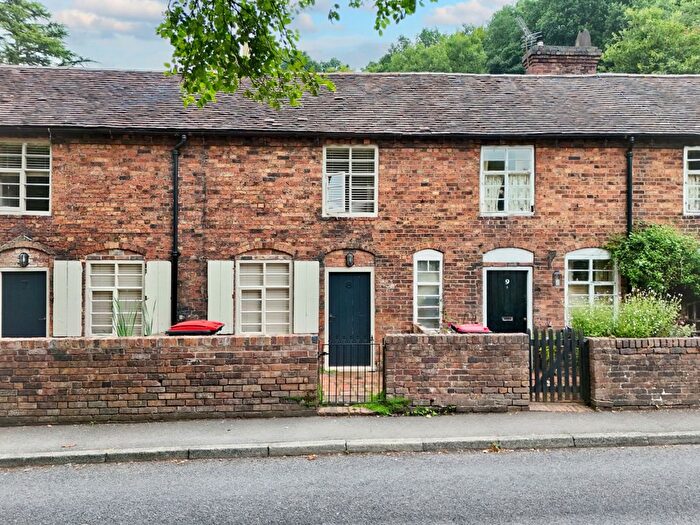
Houses for sale & to rent in Much Wenlock, Broseley
House Prices in Much Wenlock
Properties in Much Wenlock have an average house price of £310,379.00 and had 31 Property Transactions within the last 3 years¹.
Much Wenlock is an area in Broseley, Shropshire with 400 households², where the most expensive property was sold for £550,000.00.
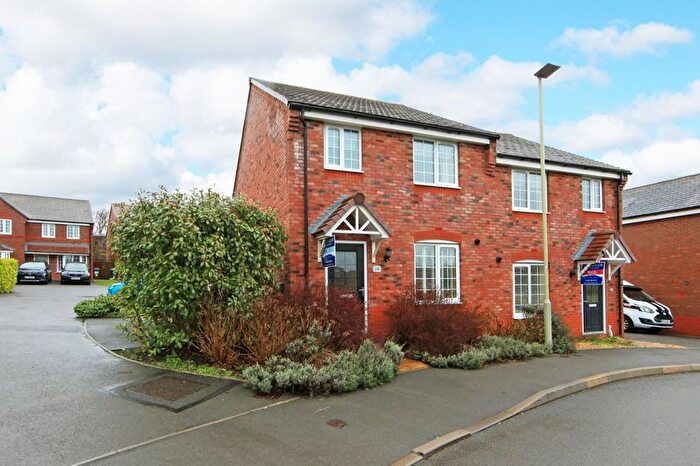
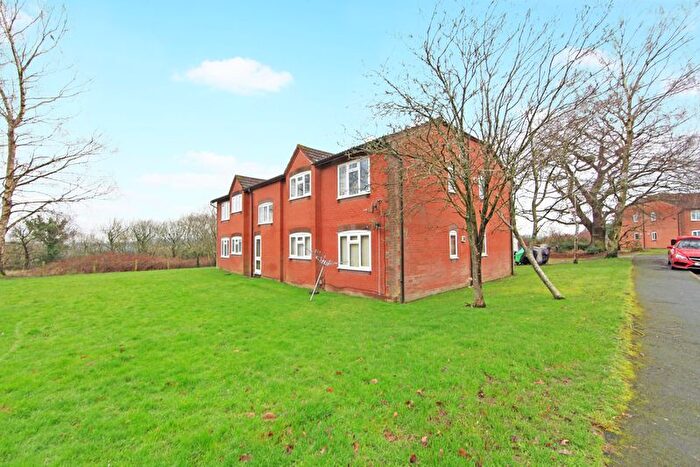
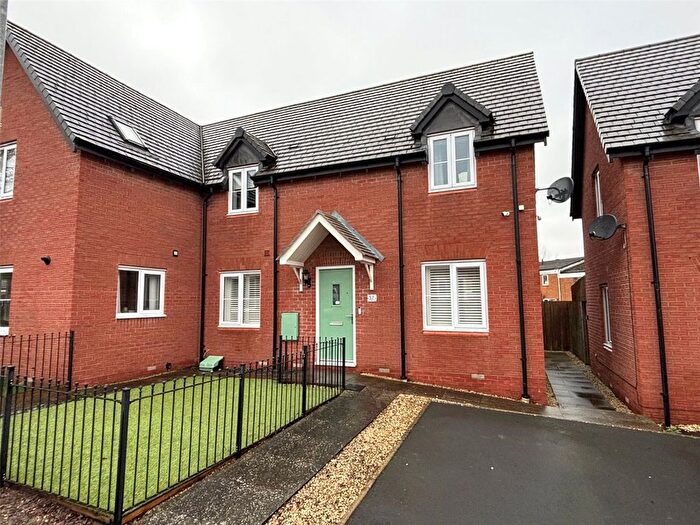
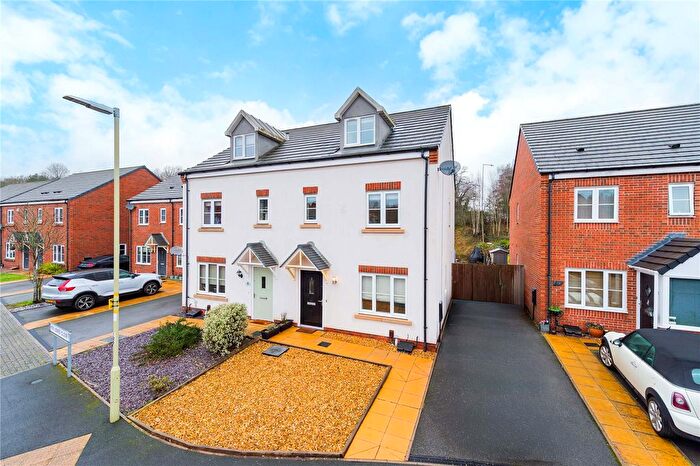
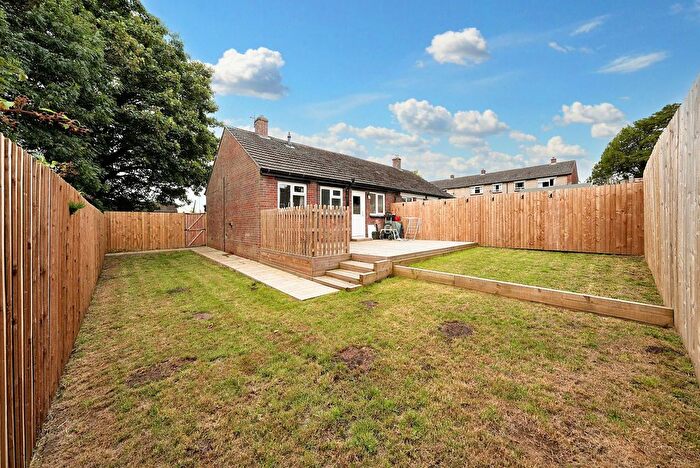
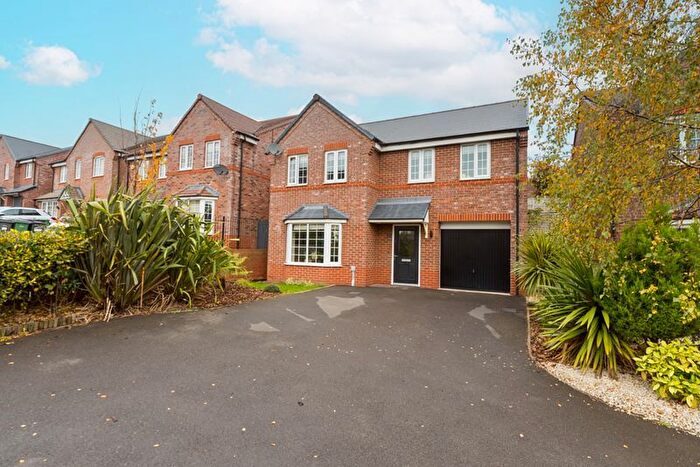
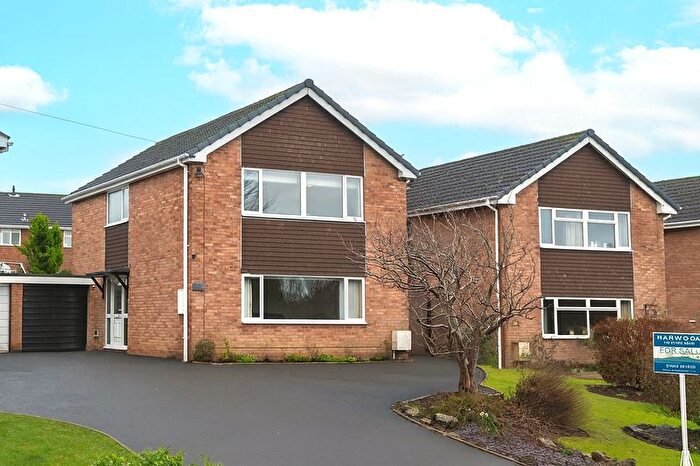
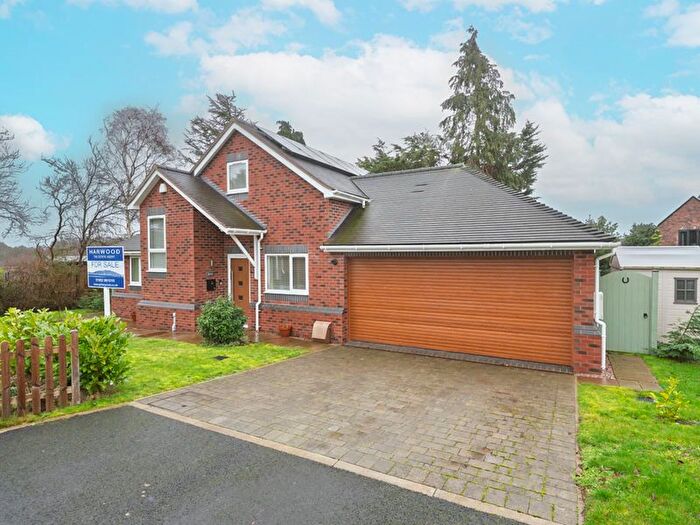
Properties for sale in Much Wenlock
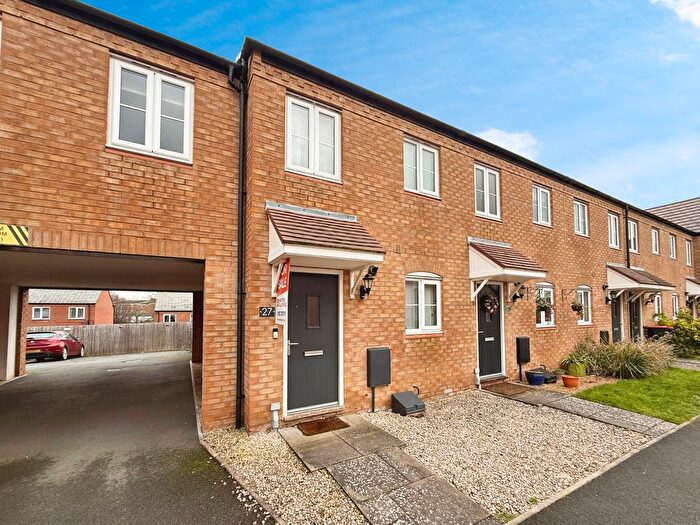
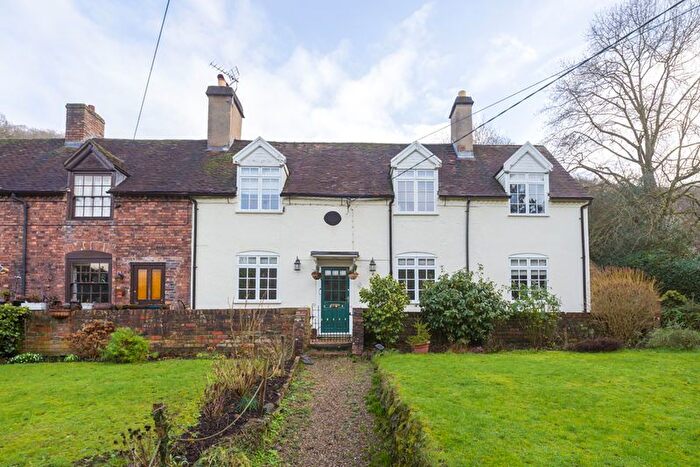
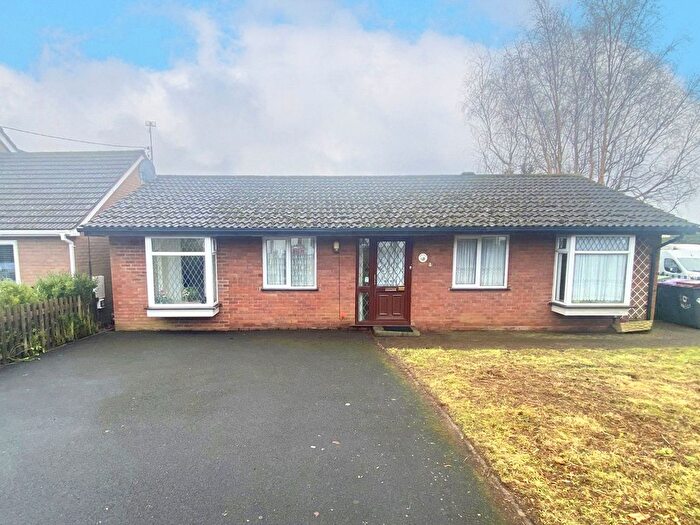
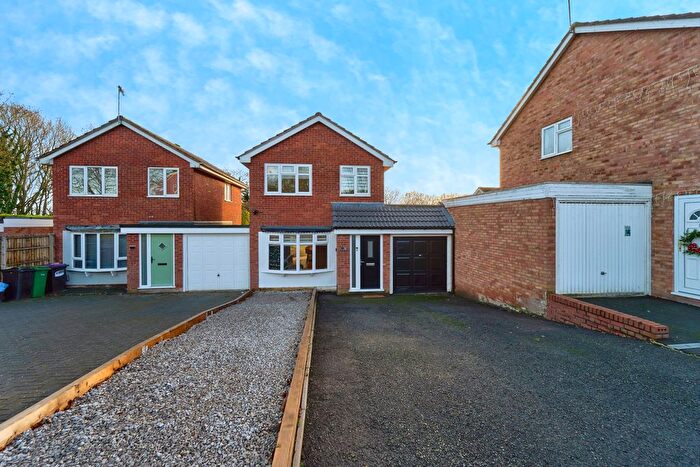
Previously listed properties in Much Wenlock
Roads and Postcodes in Much Wenlock
Navigate through our locations to find the location of your next house in Much Wenlock, Broseley for sale or to rent.
| Streets | Postcodes |
|---|---|
| Barratts Hill | TF12 5RH |
| Barrow | TF12 5BP TF12 5BW |
| Benthall Lane | TF12 5RN TF12 5RR TF12 5RT |
| Bould Lane | TF12 5JS |
| Bridge Road | TF12 5QT TF12 5QX TF12 5RB TF12 5QS |
| Bridgnorth Road | TF12 5LB |
| Church Road | TF12 5JN |
| Cobwell Road | TF12 5QL TF12 5QN TF12 5QW |
| Crews Park | TF12 5QQ |
| Dean Corner | TF12 5JH |
| Easthope Coppice | TF12 5QR |
| Easthope Road | TF12 5QP |
| Floyer Lane | TF12 5RW |
| Haybrook Terrace | TF12 5RS |
| Home Farm Road | TF12 5JL |
| Legges Hill | TF12 5RD |
| Linley Green | TF12 5JX |
| Lodge Lane | TF12 5RU |
| Maypole Road | TF12 5QH TF12 5QJ |
| Padmans Alley | TF12 5NN |
| Perrys Row | TF12 5RG |
| Pound Lane | TF12 5AU |
| Quarry Road | TF12 5QD TF12 5QE TF12 5QF |
| Simpsons Lane | TF12 5RF |
| Southorn Court | TF12 5RE |
| Speeds Lane | TF12 5RQ |
| Spout Lane | TF12 5QZ |
| Sycamore Road | TF12 5QG |
| The Bentlands | TF12 5RP |
| The Dean | TF12 5LA |
| The Mines | TF12 5QY |
| Wyke Lane | TF12 5BD |
| TF12 5BE TF12 5JY TF12 5BB TF12 5BG TF12 5BH TF12 5BL TF12 5BN TF12 5BQ TF12 5FF TF12 5JJ TF12 5JP TF12 5JT TF12 5JU TF12 5JZ TF12 5LD TF12 5RA TF12 5RJ TF12 5RX |
Transport near Much Wenlock
-
Telford Central Station
-
Oakengates Station
-
Shifnal Station
-
Wellington Station
-
Cosford Station
-
Albrighton Station
- FAQ
- Price Paid By Year
- Property Type Price
Frequently asked questions about Much Wenlock
What is the average price for a property for sale in Much Wenlock?
The average price for a property for sale in Much Wenlock is £310,379. This amount is 19% higher than the average price in Broseley. There are 1,023 property listings for sale in Much Wenlock.
What streets have the most expensive properties for sale in Much Wenlock?
The streets with the most expensive properties for sale in Much Wenlock are Maypole Road at an average of £370,000, Cobwell Road at an average of £363,000 and Benthall Lane at an average of £340,000.
What streets have the most affordable properties for sale in Much Wenlock?
The streets with the most affordable properties for sale in Much Wenlock are Speeds Lane at an average of £176,875, Bridge Road at an average of £246,666 and The Bentlands at an average of £249,000.
Which train stations are available in or near Much Wenlock?
Some of the train stations available in or near Much Wenlock are Telford Central, Oakengates and Shifnal.
Property Price Paid in Much Wenlock by Year
The average sold property price by year was:
| Year | Average Sold Price | Price Change |
Sold Properties
|
|---|---|---|---|
| 2025 | £316,500 | -9% |
10 Properties |
| 2024 | £345,194 | 19% |
9 Properties |
| 2023 | £279,166 | 8% |
12 Properties |
| 2022 | £256,958 | -20% |
12 Properties |
| 2021 | £309,300 | 16% |
13 Properties |
| 2020 | £260,278 | -8% |
7 Properties |
| 2019 | £279,818 | 20% |
11 Properties |
| 2018 | £223,452 | -5% |
19 Properties |
| 2017 | £235,034 | -23% |
16 Properties |
| 2016 | £288,473 | 25% |
13 Properties |
| 2015 | £215,695 | 1% |
10 Properties |
| 2014 | £212,704 | 7% |
11 Properties |
| 2013 | £198,468 | -2% |
16 Properties |
| 2012 | £202,919 | -17% |
13 Properties |
| 2011 | £236,687 | 18% |
8 Properties |
| 2010 | £193,322 | 28% |
9 Properties |
| 2009 | £139,125 | -132% |
4 Properties |
| 2008 | £322,850 | 28% |
5 Properties |
| 2007 | £233,470 | 23% |
17 Properties |
| 2006 | £180,339 | -14% |
14 Properties |
| 2005 | £205,812 | 9% |
8 Properties |
| 2004 | £186,792 | 25% |
20 Properties |
| 2003 | £139,666 | 14% |
9 Properties |
| 2002 | £119,772 | 29% |
18 Properties |
| 2001 | £84,657 | -6% |
19 Properties |
| 2000 | £89,860 | -1% |
18 Properties |
| 1999 | £90,963 | 11% |
15 Properties |
| 1998 | £81,132 | 5% |
17 Properties |
| 1997 | £77,179 | 3% |
15 Properties |
| 1996 | £74,481 | 18% |
14 Properties |
| 1995 | £61,395 | - |
11 Properties |
Property Price per Property Type in Much Wenlock
Here you can find historic sold price data in order to help with your property search.
The average Property Paid Price for specific property types in the last three years are:
| Property Type | Average Sold Price | Sold Properties |
|---|---|---|
| Semi Detached House | £245,227.00 | 11 Semi Detached Houses |
| Detached House | £387,781.00 | 16 Detached Houses |
| Terraced House | £179,937.00 | 4 Terraced Houses |

