
Houses for sale in Shropshire, England
House Prices in Shropshire
Properties in Shropshire have
an average house price of
£306k
and had 13,540 Property Transactions
within the last 3 years.¹
Shropshire is a location in
England with
140,299 households², where the most expensive property was sold for £3.3M.
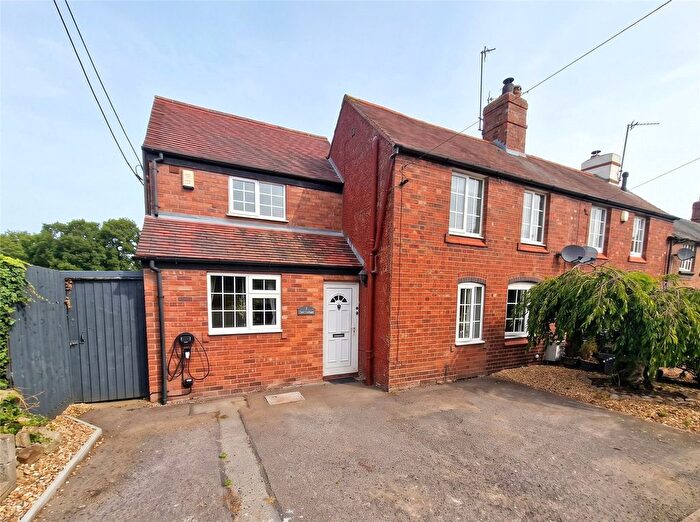
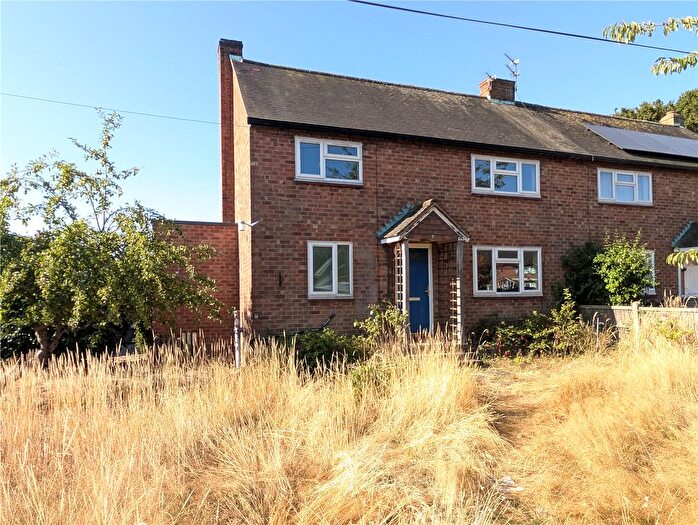
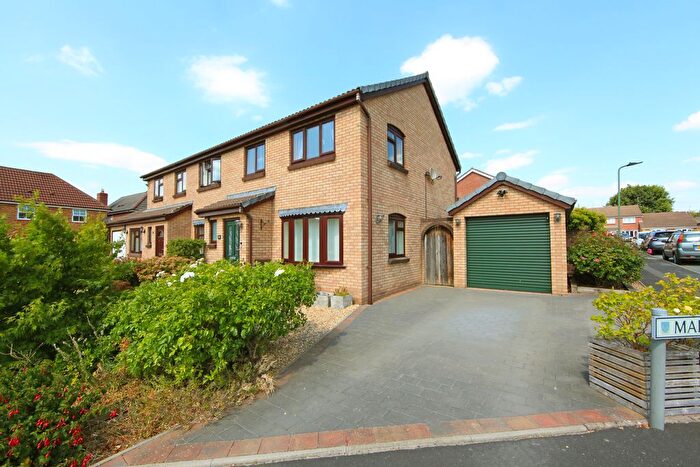
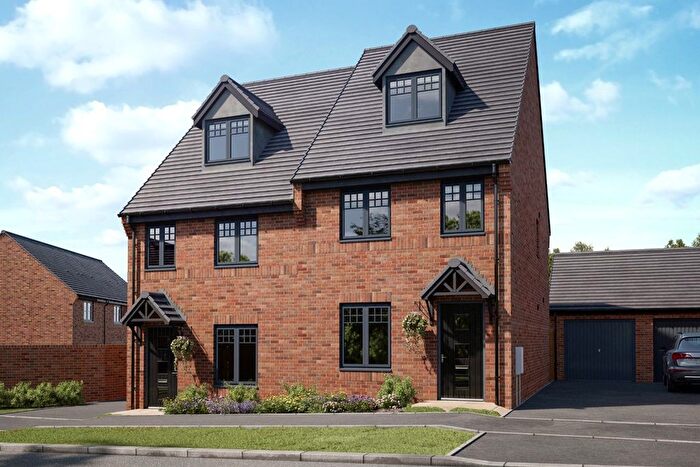
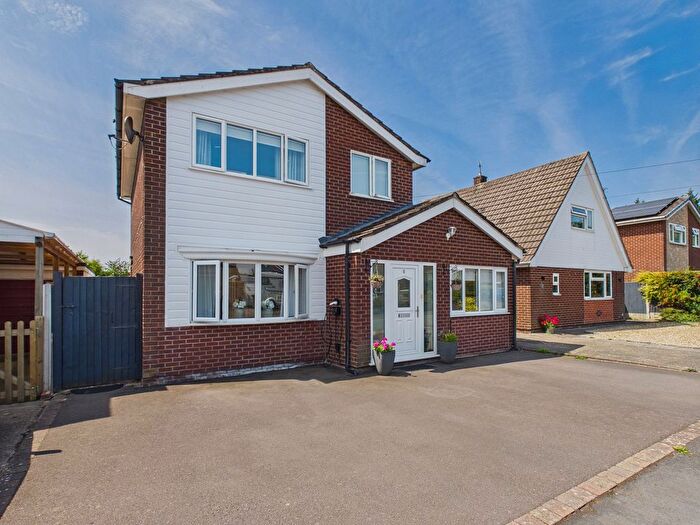
Properties for sale in Shropshire
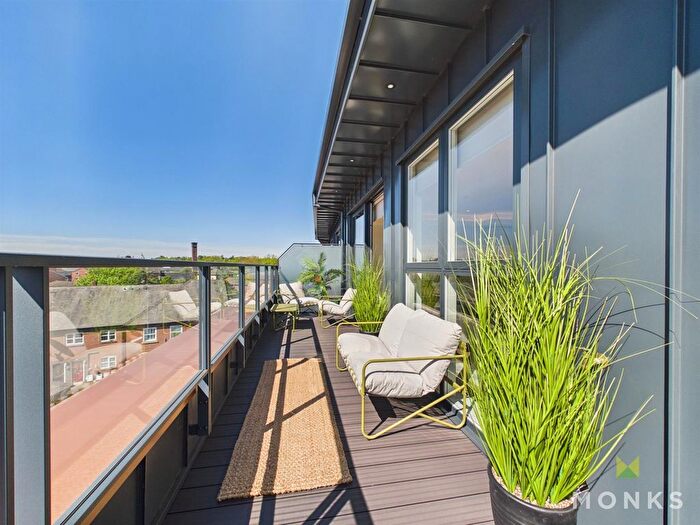
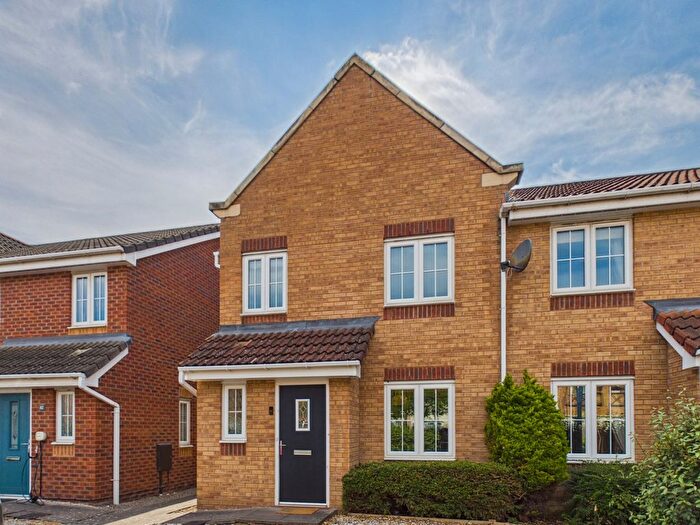
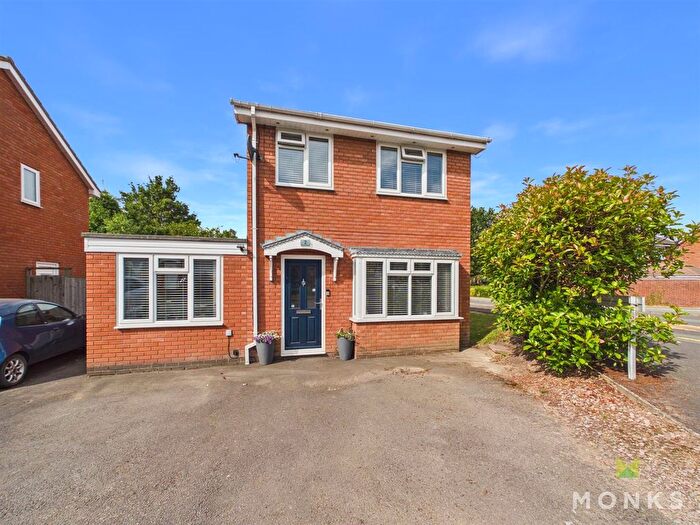
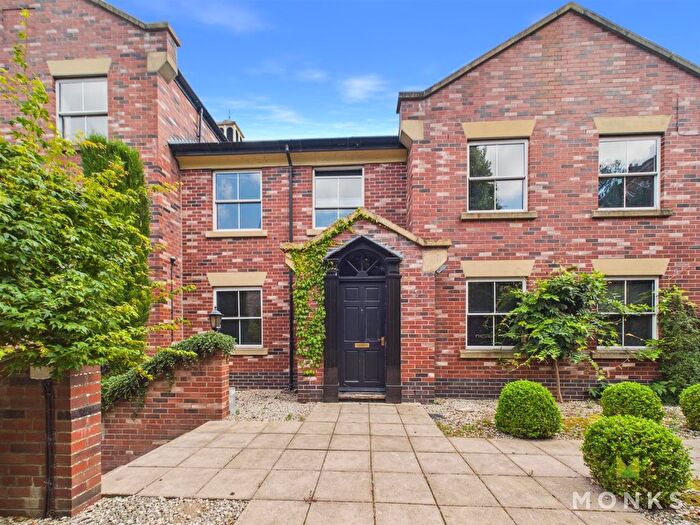
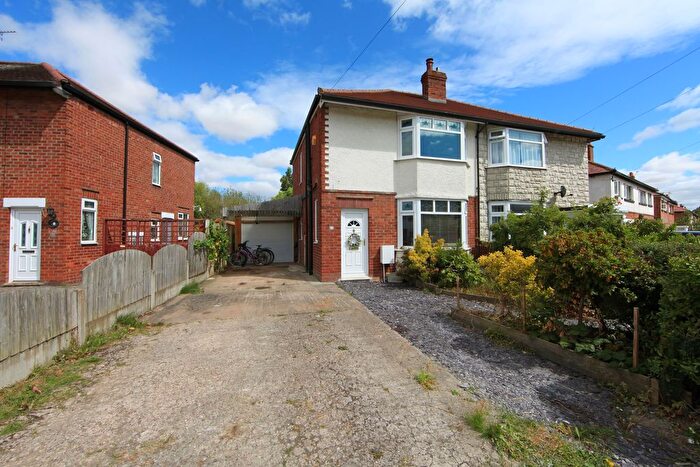
![]()
If you are looking to sell your house, let it out, or receive a property valuation, an expert can help you.
Click the button below to get started.
Towns in Shropshire
Navigate through our locations to find the location of your next house in Shropshire, England for sale or to rent.
- Malpas
- Bewdley
- Bucknell
- Shifnal
- Bishops Castle
- Lydbury North
- Shrewsbury
- Newport
- Market Drayton
- Telford
- Wrexham
- Broseley
- Stourbridge
- Tenbury Wells
- Stafford
- Kidderminster
- Ellesmere
- Oswestry
- Much Wenlock
- Ludlow
- Church Stretton
- Montgomery
- Knighton
- Bridgnorth
- Wolverhampton
- Crewe
- Craven Arms
- Welshpool
- Whitchurch
- Llanymynech
Property price trends in Shropshire
According to the latest Land Registry data, the average home in Shropshire sold for £300,659 in 2026. That figure comes from a substantial record of 159,862 sales logged over the past 31 years.
Prices have held fairly steady over the last three years. Compared with 2023, when the typical sale came in around £302,455, values are broadly unchanged.
Looking back five years, average prices are up about 4% since 2021, a gain of around £11,495 in cash terms.
Zoom out to the past decade for the fuller picture. Back in 2016, homes here averaged £227,114, so the typical sold price has climbed about 32.4% since then, roughly 2.8% a year. Stretch the view to fifteen years and that annual pace eases back to about 2.6%.
Frequently asked questions about Shropshire
What is the average price for a property for sale in Shropshire?
The average price for a property for sale in Shropshire is £306,104. This amount is 15% lower than the average price in England. There are more than 10,000 property listings for sale in Shropshire.
What locations have the most expensive properties for sale in Shropshire?
The locations with the most expensive properties for sale in Shropshire are Stourbridge at an average of £925,000, Newport at an average of £773,333 and Bewdley at an average of £509,157.
What locations have the most affordable properties for sale in Shropshire?
The locations with the most affordable properties for sale in Shropshire are Llanymynech at an average of £228,587, Broseley at an average of £262,429 and Oswestry at an average of £266,406.
Which train stations are available in or near Shropshire?
Some of the train stations available in or near Shropshire are Shrewsbury, Yorton and Wellington.
Property Price Paid in Shropshire by Year
The average sold property price by year was:
| Year | Average Sold Price | Price Change |
Sold Properties
|
|---|---|---|---|
| 2026 | £300,659 | -4% |
841 Properties |
| 2025 | £312,556 | 3% |
4,295 Properties |
| 2024 | £304,175 | 1% |
4,376 Properties |
| 2023 | £302,455 | -1% |
4,028 Properties |
| 2022 | £305,214 | 5% |
4,859 Properties |
| 2021 | £289,164 | 9% |
6,536 Properties |
| 2020 | £263,343 | 5% |
4,867 Properties |
| 2019 | £250,173 | 2% |
5,698 Properties |
| 2018 | £244,593 | 4% |
5,845 Properties |
| 2017 | £235,602 | 4% |
5,941 Properties |
Property Price per Property Type in Shropshire
Here you can find historic sold price data in order to help with your property search.
The average Property Paid Price for specific property types in the last three years are:
| Property Type | Average Sold Price | Sold Properties |
|---|---|---|
| Semi Detached House | £256,229.00 | 4,208 Semi Detached Houses |
| Terraced House | £220,048.00 | 2,983 Terraced Houses |
| Detached House | £423,998.00 | 5,268 Detached Houses |
| Flat | £163,189.00 | 1,081 Flats |
Transport in Shropshire
Please see below transportation links in this area:
