Houses for sale & to rent in Burnell, Church Stretton
House Prices in Burnell
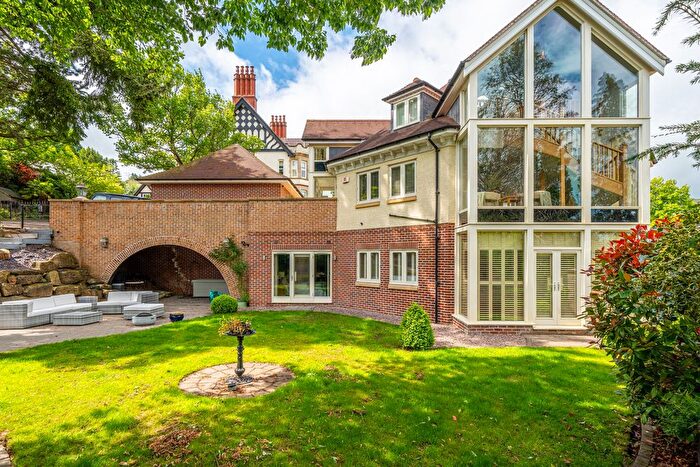
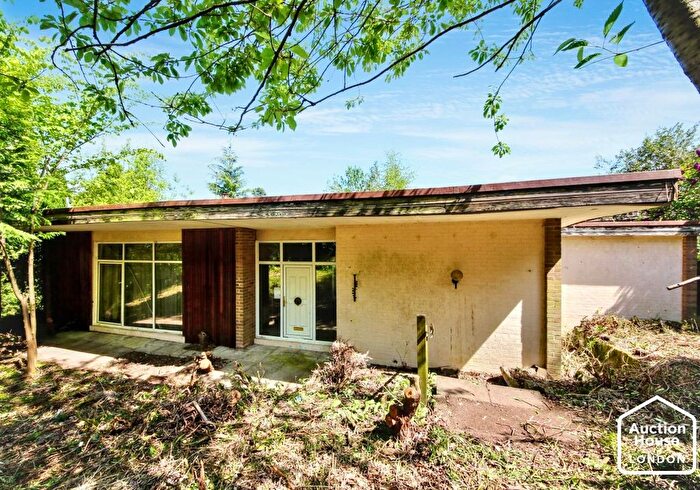
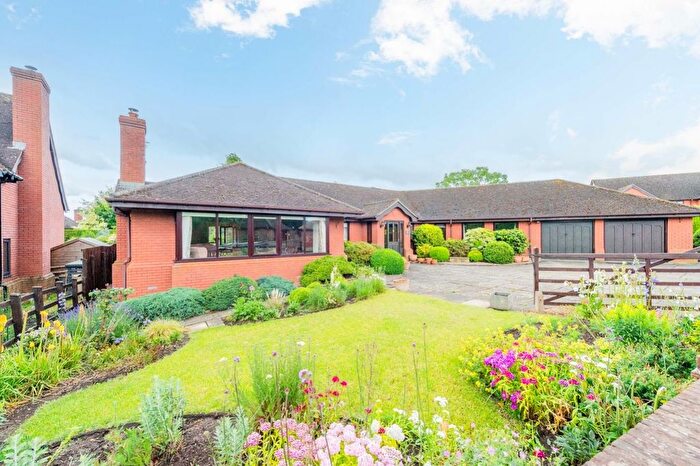
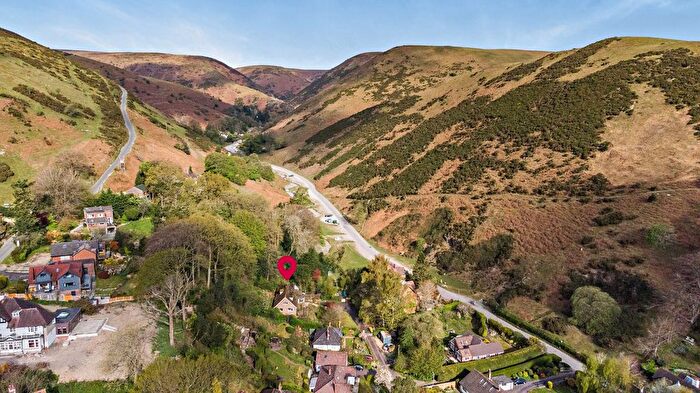
Properties in Burnell have an average house price of £503,353.00 and had 18 Property Transactions within the last 3 years¹.
Burnell is an area in Church Stretton, Shropshire with 403 households², where the most expensive property was sold for £1,500,000.00.
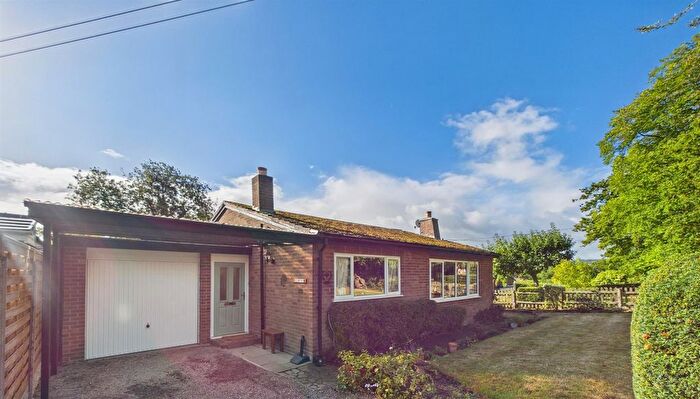
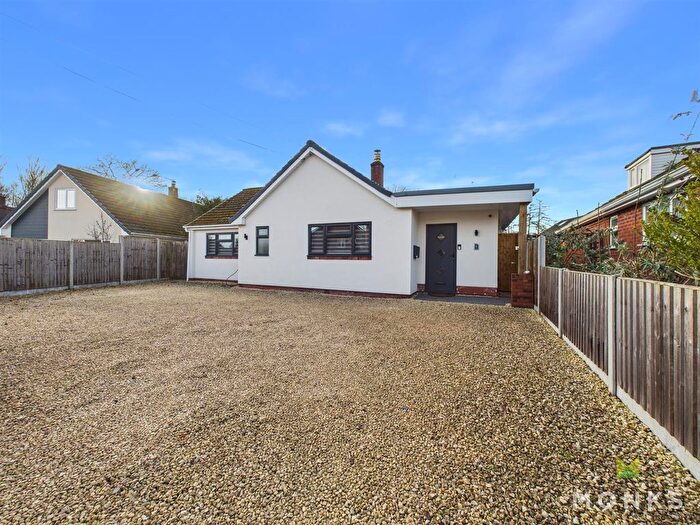
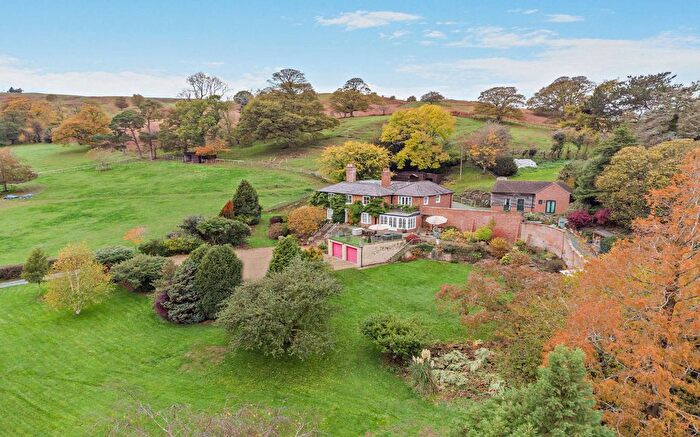
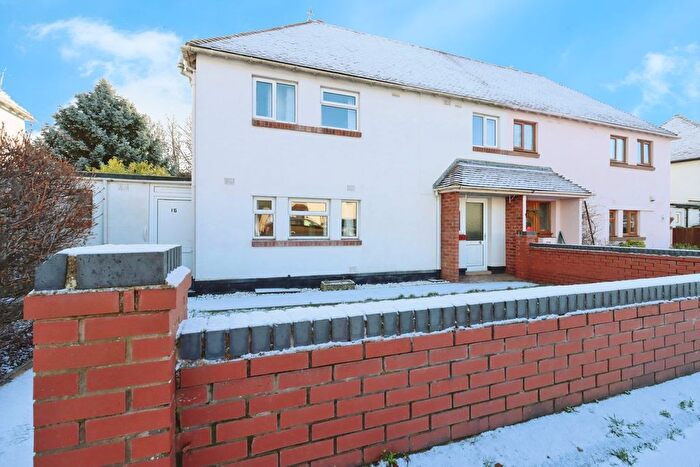
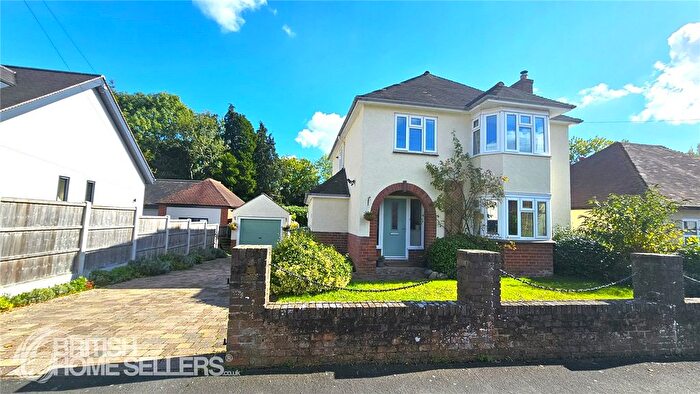
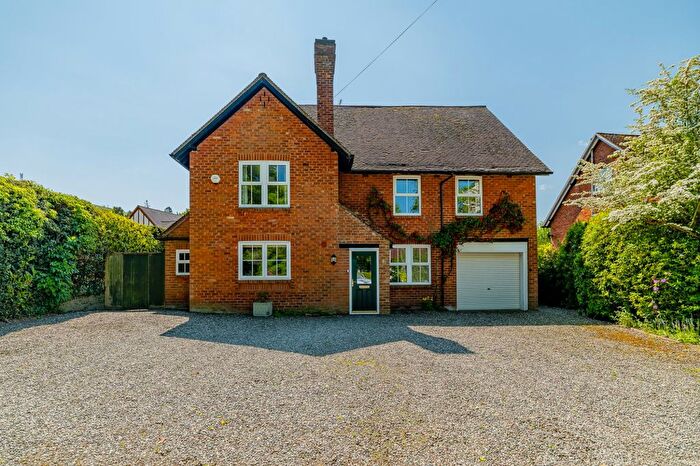
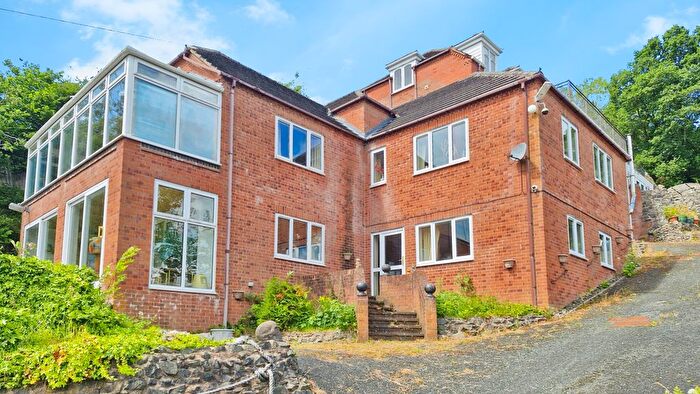
Properties for sale in Burnell
Previously listed properties in Burnell
Roads and Postcodes in Burnell
Navigate through our locations to find the location of your next house in Burnell, Church Stretton for sale or to rent.
| Streets | Postcodes |
|---|---|
| Brook Cottages | SY6 6NB |
| Cardington Moor | SY6 7LL |
| Comley | SY6 7JS |
| Coopers Meadow | SY6 6NG |
| Enchmarsh | SY6 7JX |
| Fallowfield | SY6 6LT |
| Gilberries Lane | SY6 7JE |
| Gorsty Bank | SY6 6LD |
| Gretton | SY6 7HU |
| Gretton Road | SY6 7HS SY6 7HT |
| Gulley Green | SY6 7JT |
| High Park | SY6 6LN SY6 6LW |
| Hollyhurst | SY6 7JP SY6 7JR |
| Lower Wood | SY6 6LF |
| The Square | SY6 6LQ |
| Wall Bank | SY6 7JA |
| Willstone | SY6 7HW |
| SY6 6LH SY6 6LL SY6 6LU SY6 6LX SY6 6LZ SY6 6ND SY6 6NE SY6 6NH SY6 6NJ SY6 6NL SY6 6NN SY6 6NP SY6 6NQ SY6 6NR SY6 6NT SY6 6NU SY6 6NX SY6 6PA SY6 7HR SY6 7HX SY6 7HY SY6 7JU SY6 7JY SY6 7JZ SY6 7LB SY6 7LD SY6 6LE SY6 6LJ SY6 6NA SY6 6NF SY6 6NS SY6 6NY SY6 6NZ SY6 7HN SY6 7LA |
Transport near Burnell
- FAQ
- Price Paid By Year
- Property Type Price
Frequently asked questions about Burnell
What is the average price for a property for sale in Burnell?
The average price for a property for sale in Burnell is £503,353. This amount is 22% higher than the average price in Church Stretton. There are 110 property listings for sale in Burnell.
What streets have the most expensive properties for sale in Burnell?
The streets with the most expensive properties for sale in Burnell are Lower Wood at an average of £500,000 and The Square at an average of £296,000.
What streets have the most affordable properties for sale in Burnell?
The streets with the most affordable properties for sale in Burnell are Coopers Meadow at an average of £230,000 and Fallowfield at an average of £255,000.
Which train stations are available in or near Burnell?
Some of the train stations available in or near Burnell are Church Stretton, Craven Arms and Shrewsbury.
Property Price Paid in Burnell by Year
The average sold property price by year was:
| Year | Average Sold Price | Price Change |
Sold Properties
|
|---|---|---|---|
| 2025 | £463,333 | -21% |
3 Properties |
| 2024 | £561,500 | 22% |
9 Properties |
| 2023 | £436,144 | 10% |
6 Properties |
| 2022 | £391,214 | -22% |
7 Properties |
| 2021 | £476,382 | 16% |
17 Properties |
| 2020 | £399,296 | 4% |
6 Properties |
| 2019 | £385,137 | -4% |
9 Properties |
| 2018 | £400,388 | -1% |
9 Properties |
| 2017 | £403,142 | 8% |
7 Properties |
| 2016 | £370,000 | -0,1% |
5 Properties |
| 2015 | £370,208 | 8% |
12 Properties |
| 2014 | £340,000 | 12% |
9 Properties |
| 2013 | £298,687 | 15% |
4 Properties |
| 2012 | £252,555 | -47% |
9 Properties |
| 2011 | £370,416 | 37% |
6 Properties |
| 2010 | £232,655 | -52% |
6 Properties |
| 2009 | £352,500 | 21% |
4 Properties |
| 2008 | £277,083 | -14% |
6 Properties |
| 2007 | £316,857 | -0,1% |
7 Properties |
| 2006 | £317,166 | 9% |
12 Properties |
| 2005 | £288,998 | 8% |
10 Properties |
| 2004 | £264,745 | 12% |
4 Properties |
| 2003 | £231,900 | 38% |
10 Properties |
| 2002 | £143,642 | -8% |
14 Properties |
| 2001 | £154,955 | 29% |
9 Properties |
| 2000 | £109,600 | -102% |
5 Properties |
| 1999 | £221,390 | 57% |
5 Properties |
| 1998 | £96,166 | -4% |
6 Properties |
| 1997 | £100,475 | 35% |
20 Properties |
| 1996 | £65,562 | -71% |
8 Properties |
| 1995 | £111,857 | - |
7 Properties |
Property Price per Property Type in Burnell
Here you can find historic sold price data in order to help with your property search.
The average Property Paid Price for specific property types in the last three years are:
| Property Type | Average Sold Price | Sold Properties |
|---|---|---|
| Semi Detached House | £314,800.00 | 5 Semi Detached Houses |
| Detached House | £670,350.00 | 10 Detached Houses |
| Terraced House | £260,955.00 | 3 Terraced Houses |

