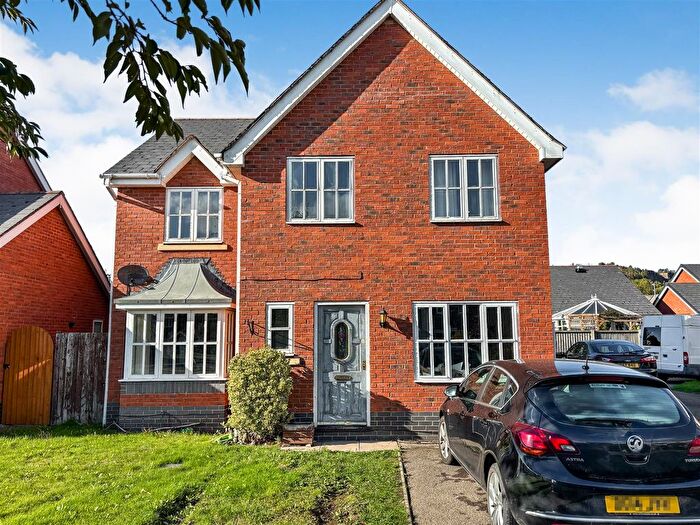
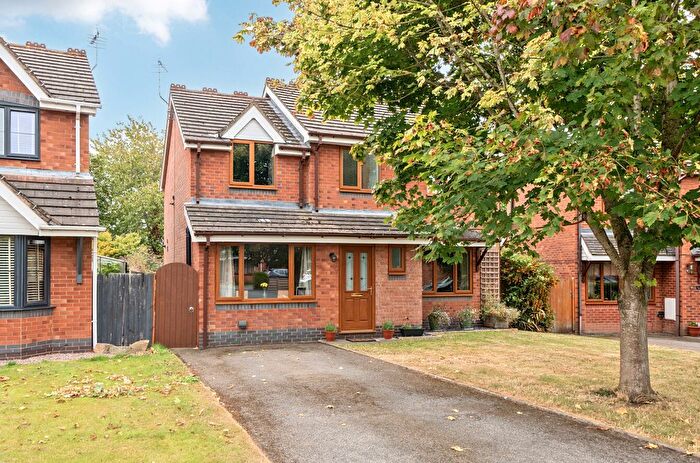
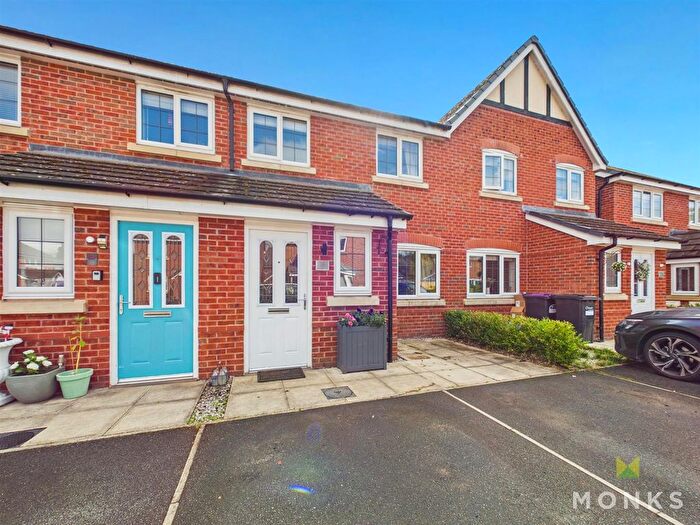
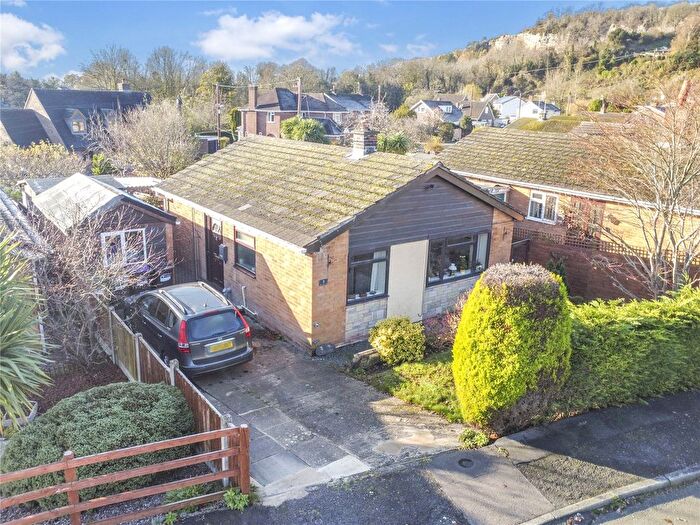
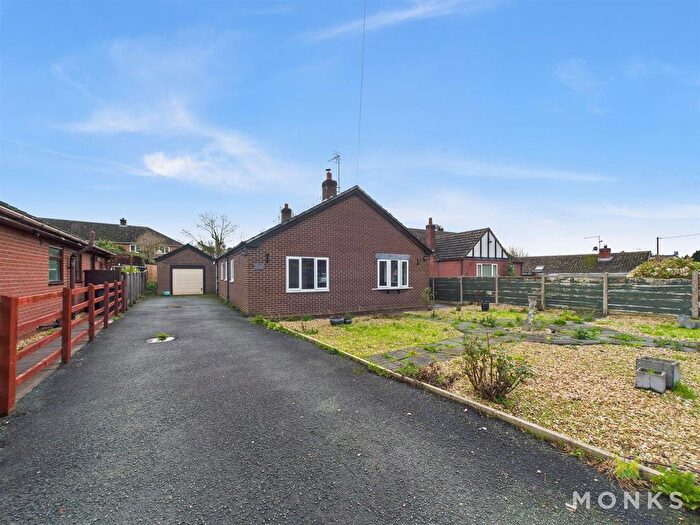
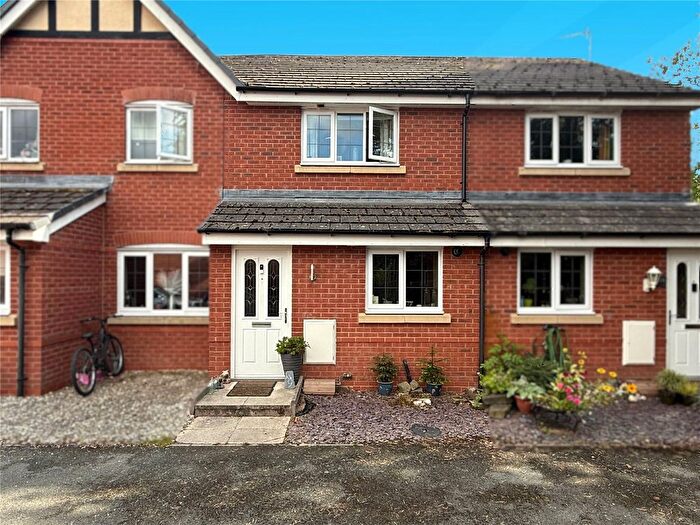
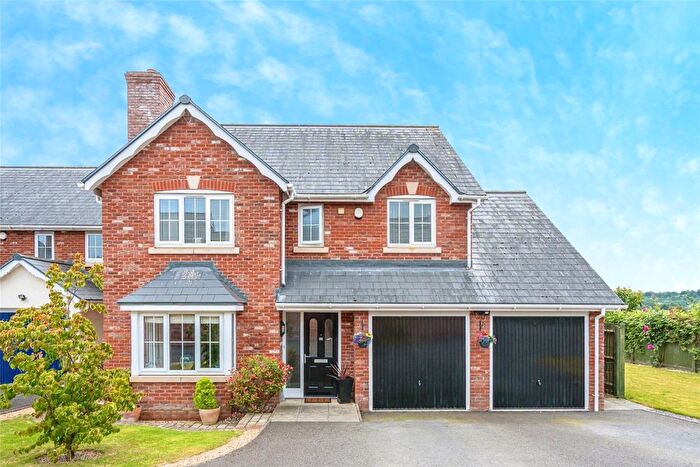
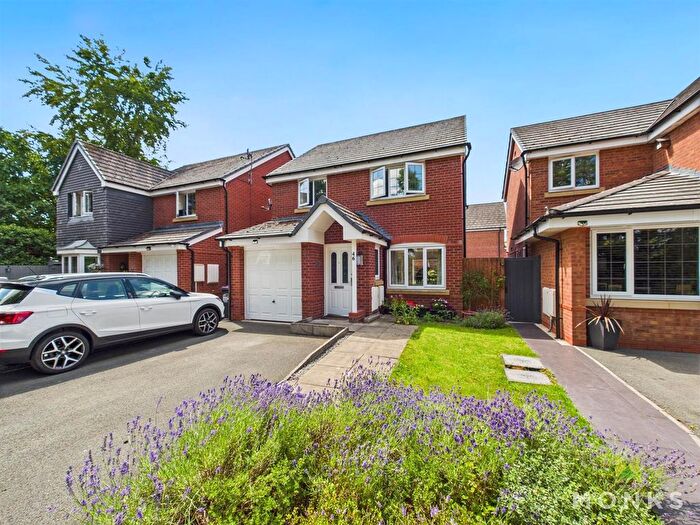
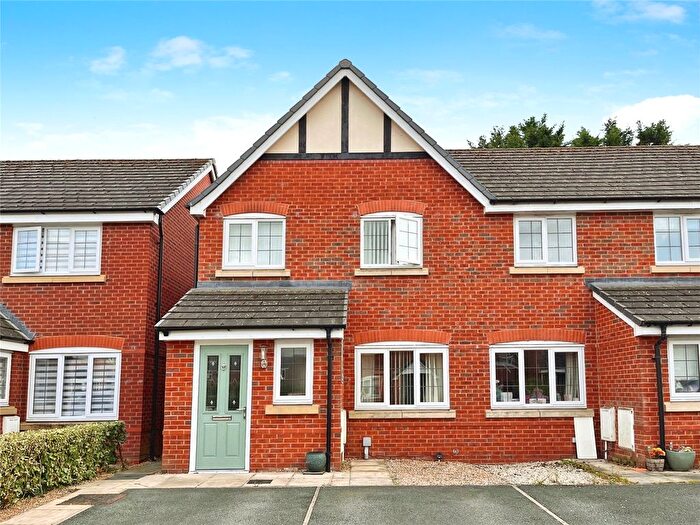
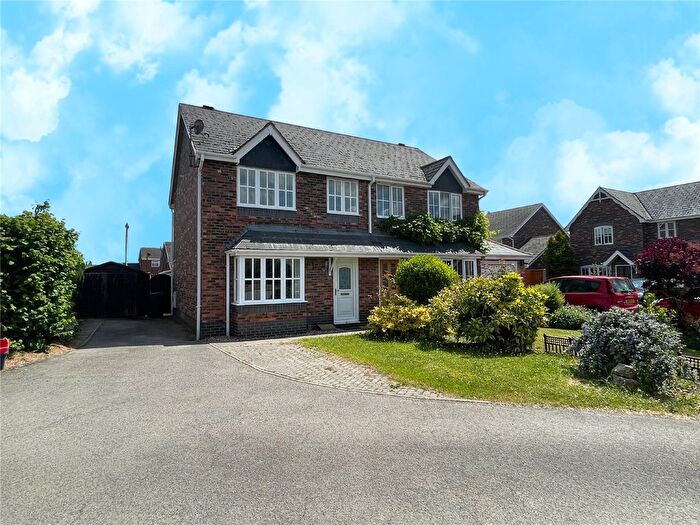
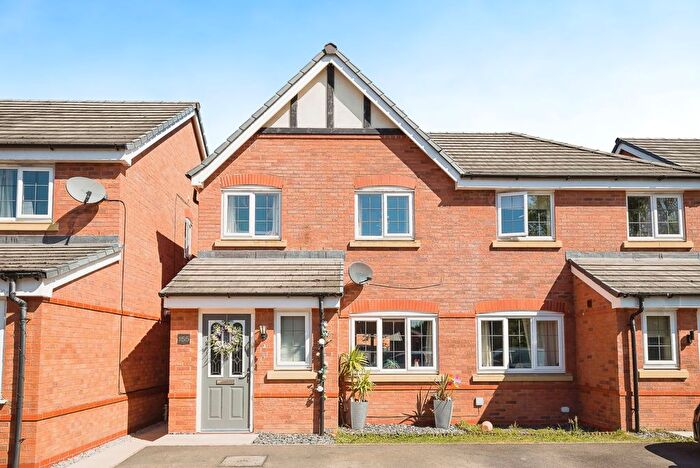
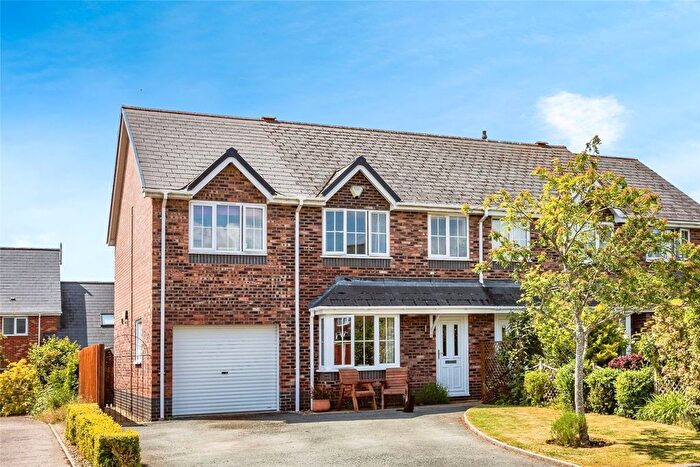
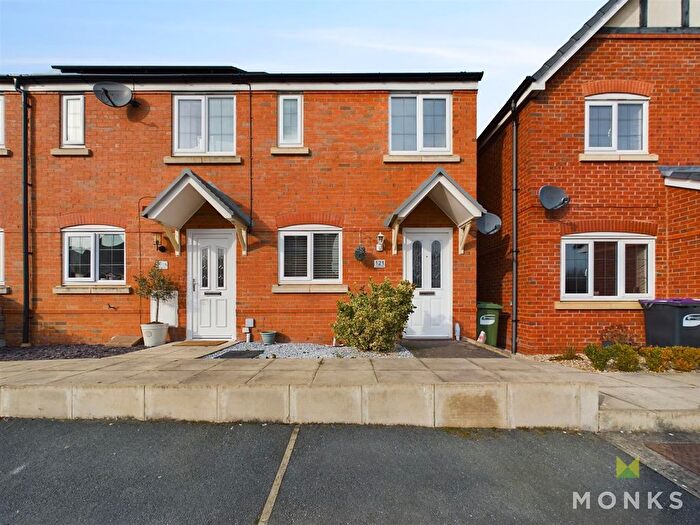
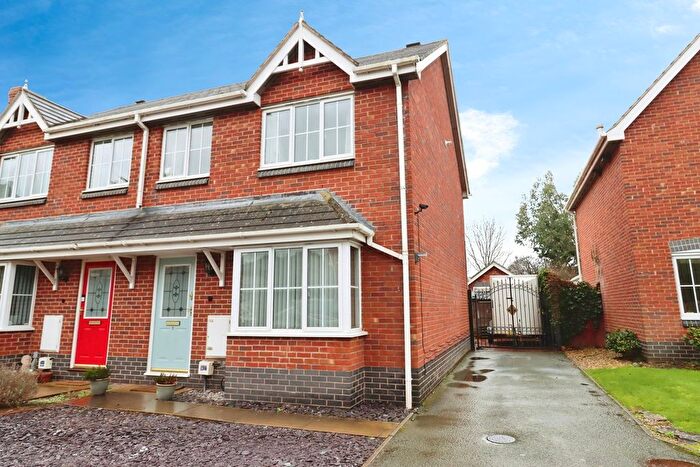
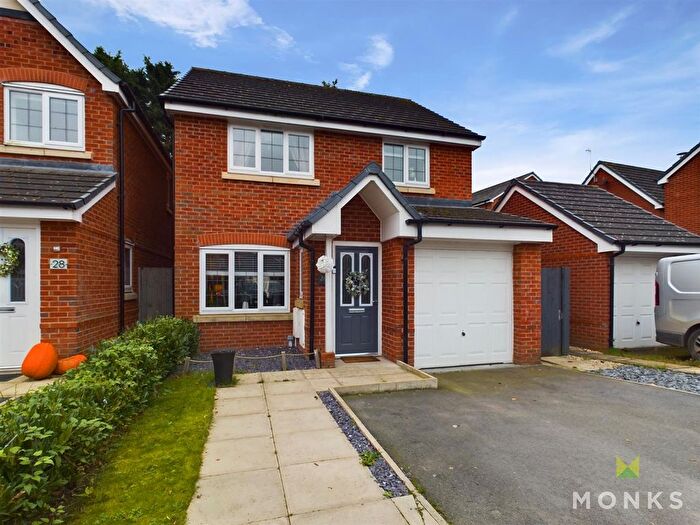
Houses for sale & to rent in Llanymynech, Llanymynech
House Prices in Llanymynech
Properties in Llanymynech have an average house price of £230,432.00 and had 35 Property Transactions within the last 3 years¹.
Llanymynech is an area in Llanymynech, Shropshire with 210 households², where the most expensive property was sold for £325,000.00.
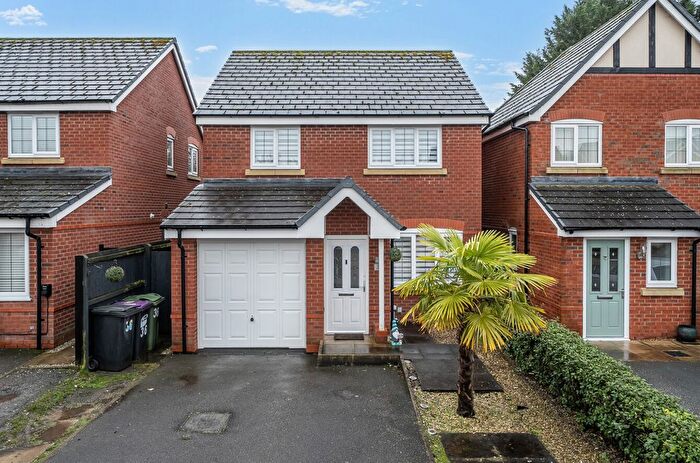
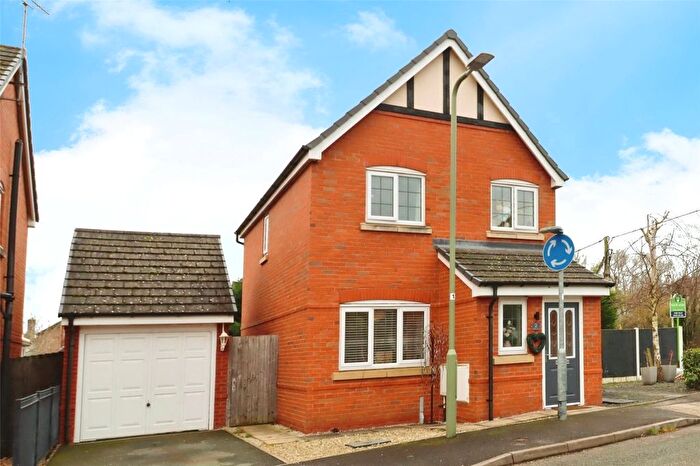
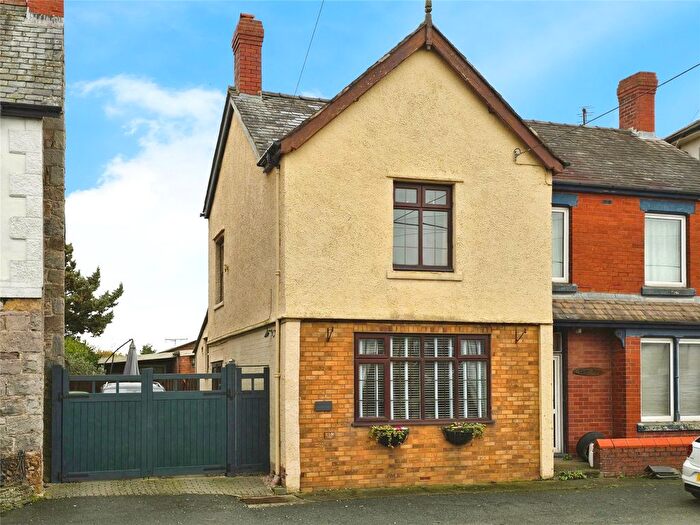
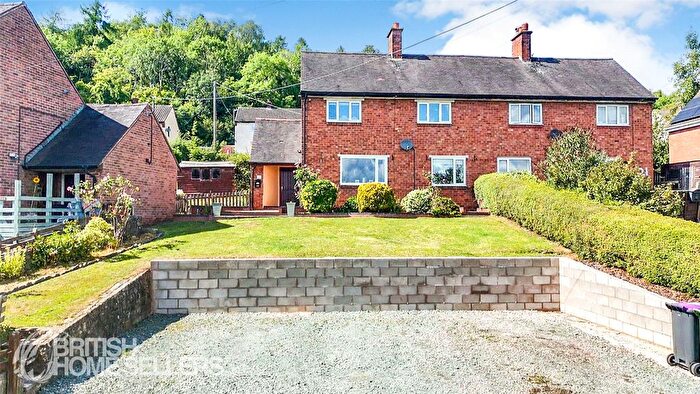
Properties for sale in Llanymynech
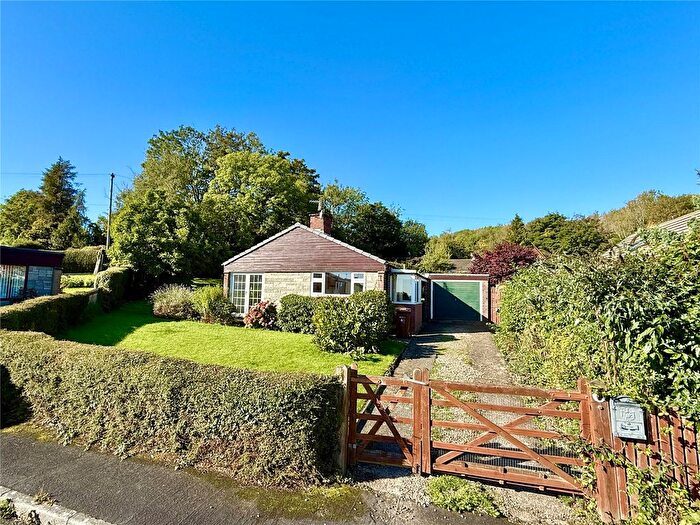
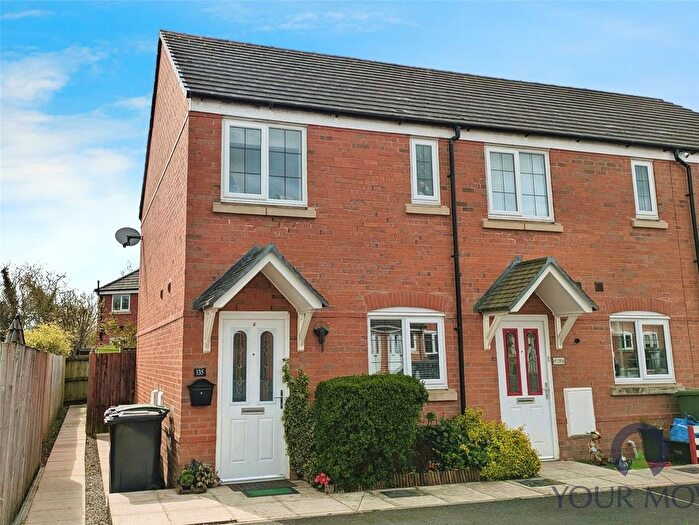
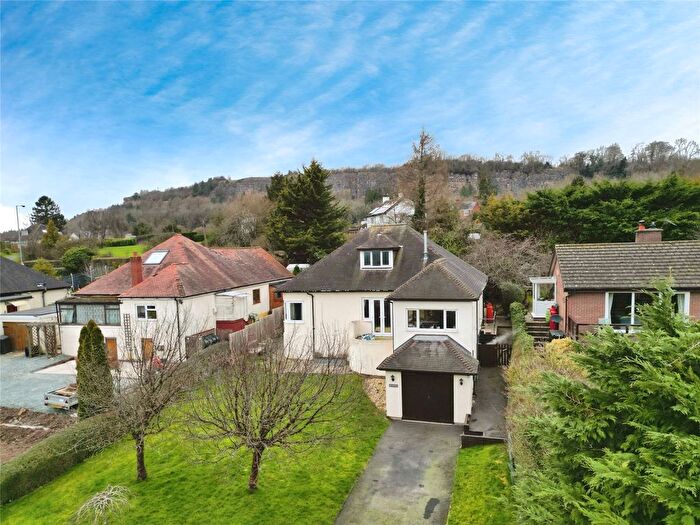
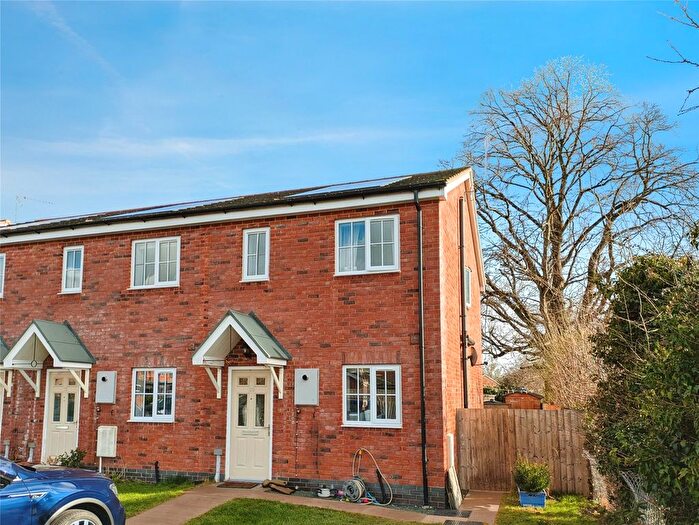
Previously listed properties in Llanymynech
Roads and Postcodes in Llanymynech
Navigate through our locations to find the location of your next house in Llanymynech, Llanymynech for sale or to rent.
| Streets | Postcodes |
|---|---|
| Barley Meadows | SY22 6JX |
| Bradford Terrace | SY22 6EL |
| Bronwylfa | SY22 6HD |
| Heritage Way | SY22 6LL SY22 6LN |
| North Road | SY22 6EA |
| Rectory Lane | SY22 6EQ |
| Station Road | SY22 6ED SY22 6EE |
| SY22 6EF SY22 6EG SY22 6EJ SY22 6HB SY22 6LG SY22 6LQ |
Transport near Llanymynech
- FAQ
- Price Paid By Year
- Property Type Price
Frequently asked questions about Llanymynech
What is the average price for a property for sale in Llanymynech?
The average price for a property for sale in Llanymynech is £230,432. There are 79 property listings for sale in Llanymynech.
What streets have the most expensive properties for sale in Llanymynech?
The streets with the most expensive properties for sale in Llanymynech are Rectory Lane at an average of £258,333, Barley Meadows at an average of £240,146 and Heritage Way at an average of £217,534.
What streets have the most affordable properties for sale in Llanymynech?
The streets with the most affordable properties for sale in Llanymynech are Station Road at an average of £160,000 and Bronwylfa at an average of £215,000.
Which train stations are available in or near Llanymynech?
Some of the train stations available in or near Llanymynech are Gobowen, Welshpool and Chirk.
Property Price Paid in Llanymynech by Year
The average sold property price by year was:
| Year | Average Sold Price | Price Change |
Sold Properties
|
|---|---|---|---|
| 2025 | £238,269 | 2% |
13 Properties |
| 2024 | £233,041 | 7% |
12 Properties |
| 2023 | £217,115 | -5% |
10 Properties |
| 2022 | £228,832 | 33% |
9 Properties |
| 2021 | £153,340 | -38% |
16 Properties |
| 2020 | £211,383 | 14% |
18 Properties |
| 2019 | £180,939 | 23% |
30 Properties |
| 2018 | £139,176 | -32% |
26 Properties |
| 2017 | £184,026 | 15% |
19 Properties |
| 2016 | £156,833 | 8% |
15 Properties |
| 2015 | £144,345 | 4% |
18 Properties |
| 2014 | £139,236 | -9% |
23 Properties |
| 2013 | £151,296 | -15% |
16 Properties |
| 2012 | £173,997 | 1% |
13 Properties |
| 2011 | £172,656 | 15% |
15 Properties |
| 2010 | £147,180 | -11% |
10 Properties |
| 2009 | £163,640 | -10% |
14 Properties |
| 2008 | £179,247 | -12% |
12 Properties |
| 2007 | £201,327 | 16% |
9 Properties |
| 2006 | £168,158 | 24% |
8 Properties |
| 2005 | £127,816 | 4% |
3 Properties |
| 2004 | £123,102 | 8% |
10 Properties |
| 2003 | £113,411 | 37% |
9 Properties |
| 2002 | £71,583 | -12% |
6 Properties |
| 2001 | £80,181 | -0,1% |
8 Properties |
| 2000 | £80,278 | 15% |
7 Properties |
| 1999 | £67,878 | 19% |
20 Properties |
| 1998 | £55,141 | 22% |
19 Properties |
| 1997 | £43,000 | -53% |
3 Properties |
| 1996 | £65,666 | 39% |
3 Properties |
| 1995 | £40,250 | - |
2 Properties |
Property Price per Property Type in Llanymynech
Here you can find historic sold price data in order to help with your property search.
The average Property Paid Price for specific property types in the last three years are:
| Property Type | Average Sold Price | Sold Properties |
|---|---|---|
| Semi Detached House | £216,875.00 | 8 Semi Detached Houses |
| Terraced House | £158,592.00 | 7 Terraced Houses |
| Detached House | £265,368.00 | 19 Detached Houses |
| Flat | £178,000.00 | 1 Flat |

