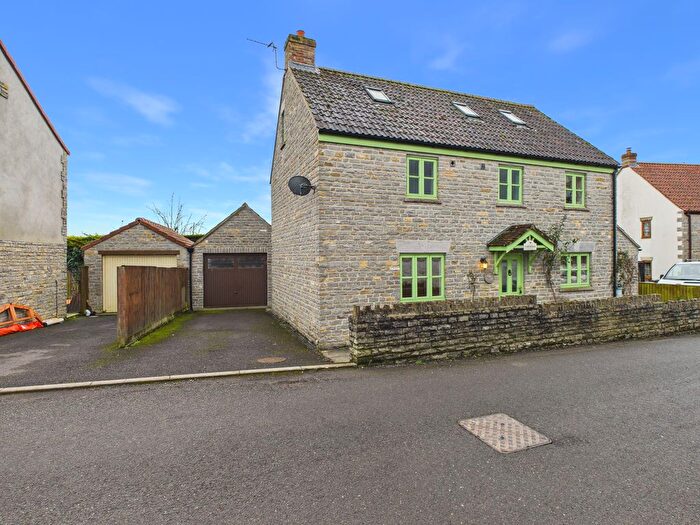
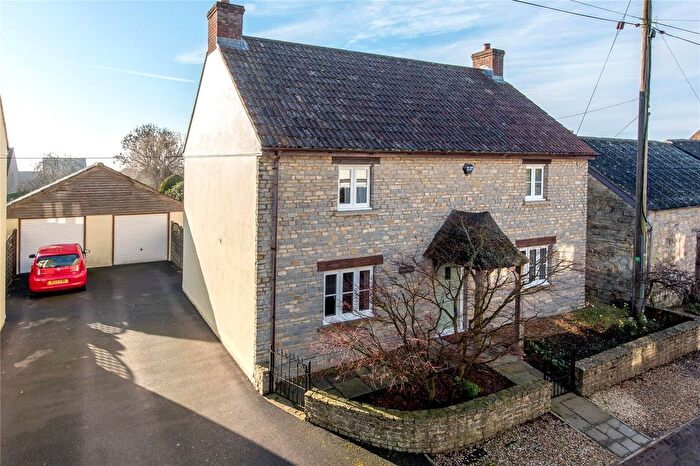
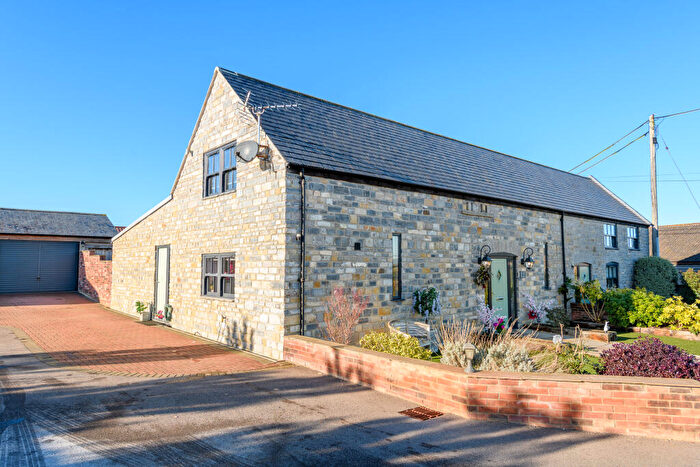
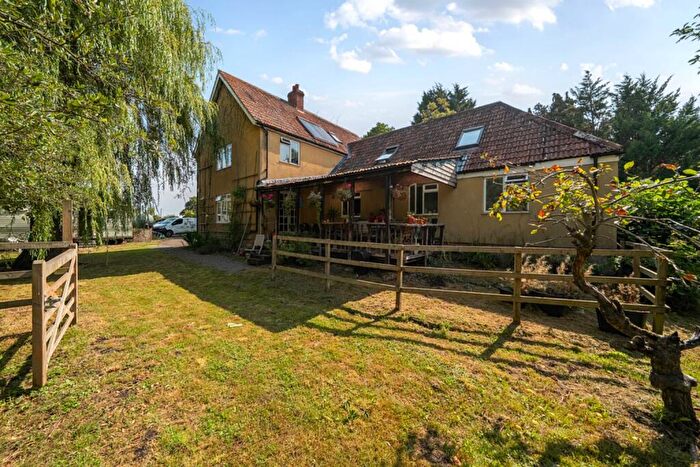
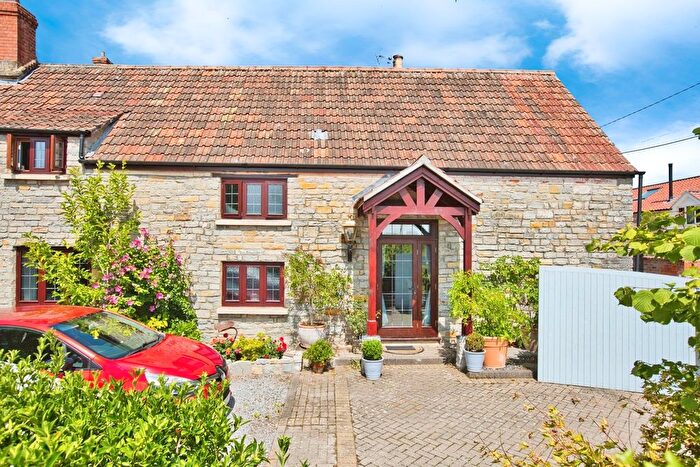
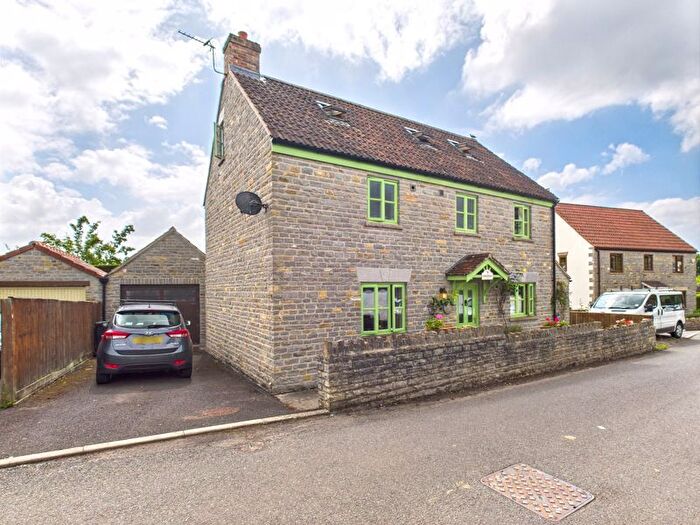
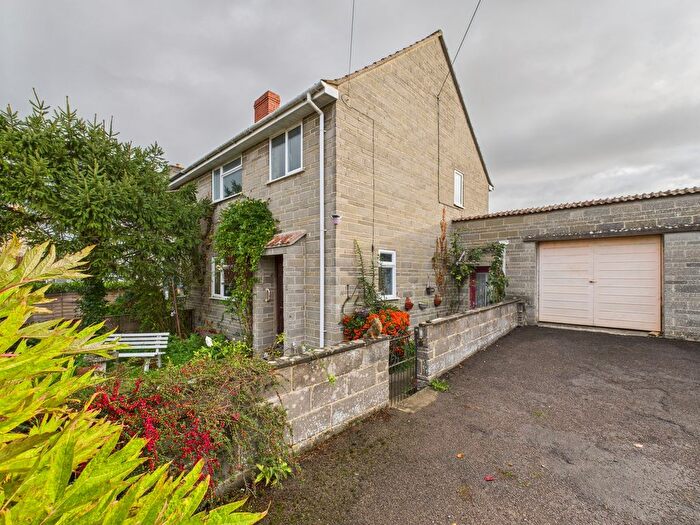
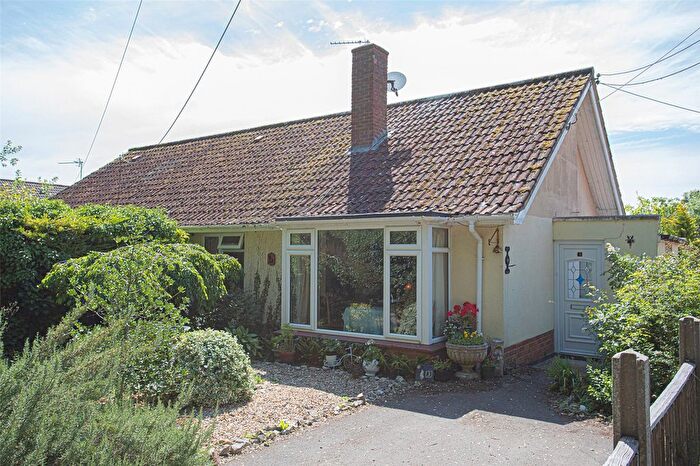
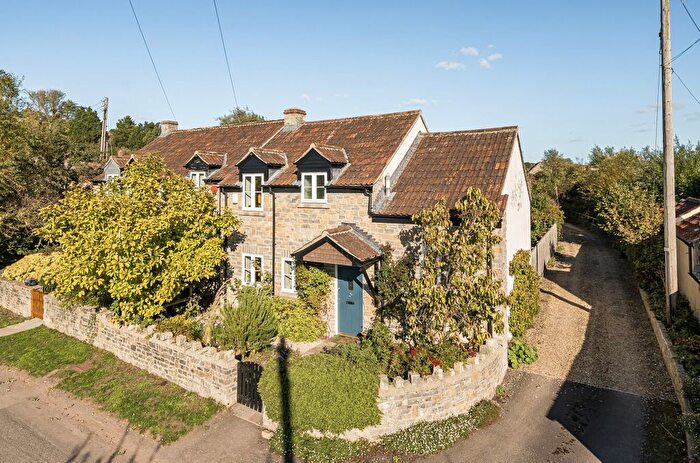
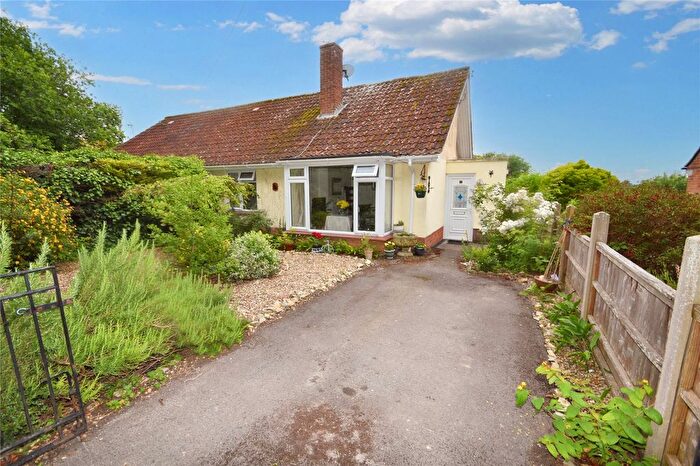
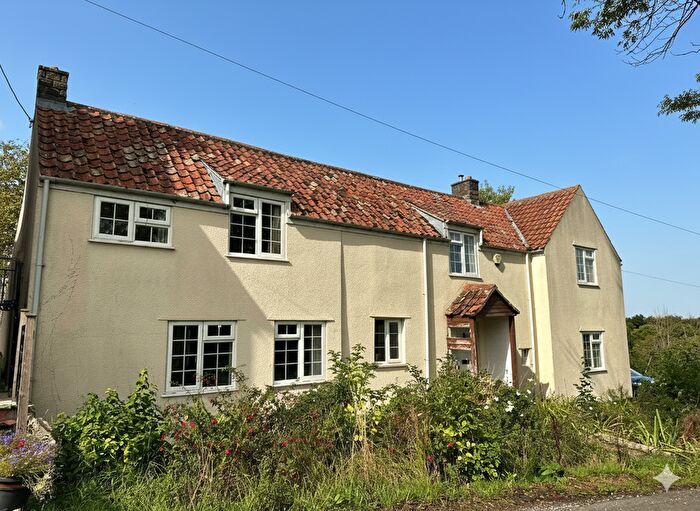
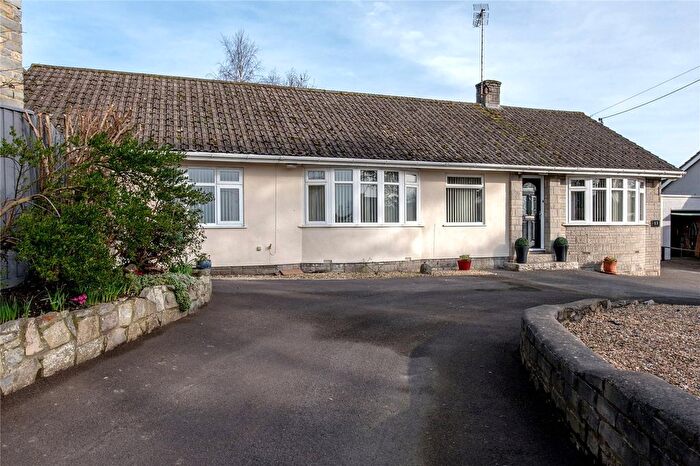
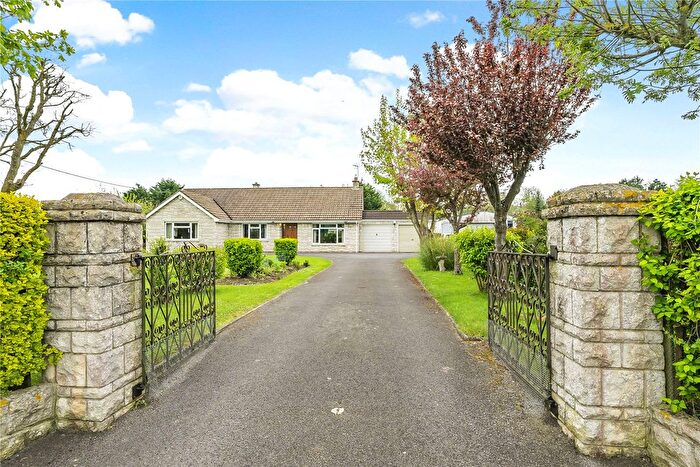
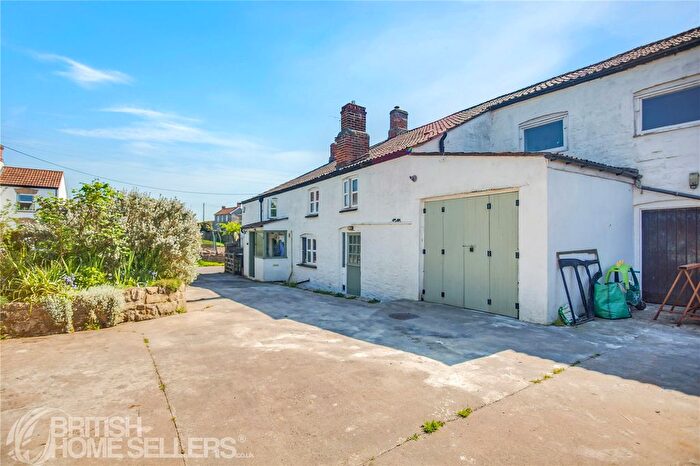
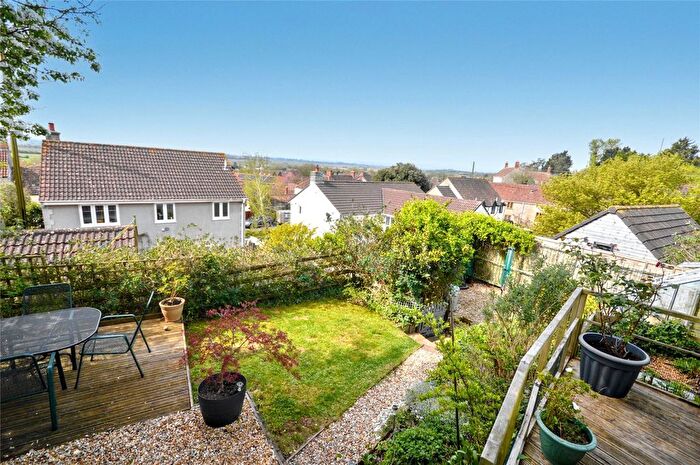
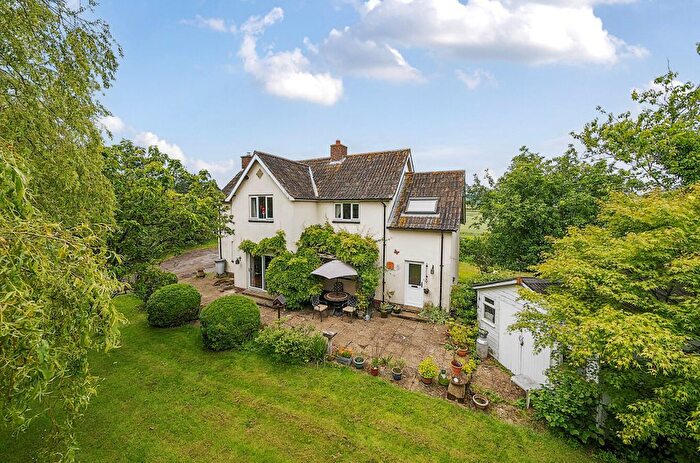
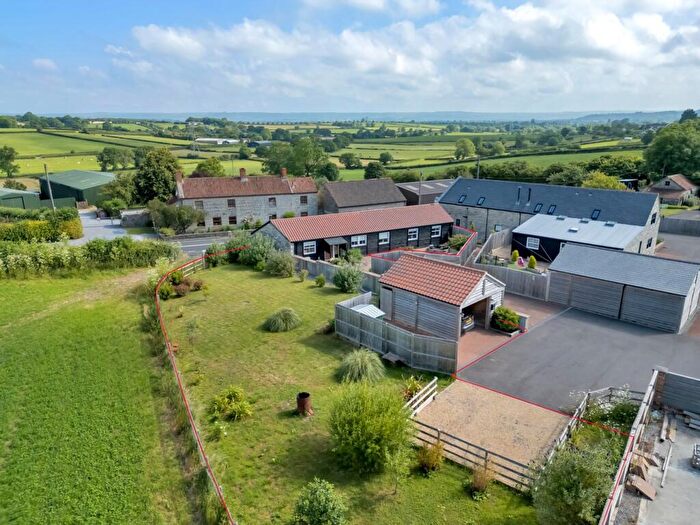
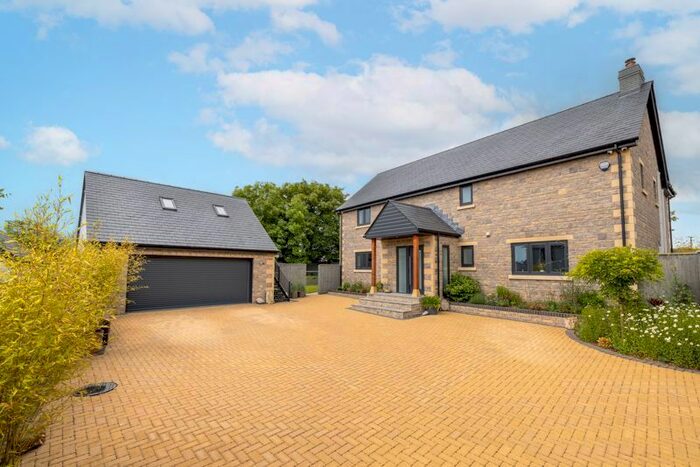
Houses for sale & to rent in East Polden, Bridgwater
House Prices in East Polden
Properties in East Polden have an average house price of £454,957.00 and had 57 Property Transactions within the last 3 years¹.
East Polden is an area in Bridgwater, Somerset with 860 households², where the most expensive property was sold for £1,423,000.00.
Properties for sale in East Polden
Previously listed properties in East Polden
Roads and Postcodes in East Polden
Navigate through our locations to find the location of your next house in East Polden, Bridgwater for sale or to rent.
| Streets | Postcodes |
|---|---|
| Bath Road | TA7 9PB TA7 9PE TA7 9QJ TA7 9QQ TA7 9QS TA7 9QT TA7 9QU TA7 9DB TA7 9QH TA7 9QL |
| Berhill | TA7 9QN |
| Billicombe Lane | TA7 9DG |
| Blacksmiths Lane | TA7 9LZ |
| Blake Green | TA7 9QF |
| Bradley Lane | TA7 9RD |
| Bridewell Lane | TA7 9NQ |
| Butchers Lane | TA7 9LY |
| Chapel Hill | TA7 9PJ TA7 9PY |
| Chestnut Lane | TA7 9PR |
| Church Close | TA7 9LS |
| Church Road | TA7 9NE |
| Eton Court | TA7 9PA |
| Farm Hill | TA7 9PS TA7 9PX |
| Fullpits Lane | TA7 9QR |
| Glebeland Close | TA7 9QZ |
| Greinton Road | TA7 9BS |
| High Lane | TA7 9NB |
| High Street | TA7 9PF TA7 9PL TA7 9PZ TA7 9QA |
| High View Drive | TA7 9QY |
| Holcombe Lane | TA7 9BX |
| Hurmans Close | TA7 9PT TA7 9PU |
| Kent Lane | TA7 9NN |
| Kings Lane | TA7 9PW |
| Lawn Lane | TA7 9LU |
| Loxley Batch | TA7 9NZ |
| Main Road | TA7 9LP |
| Middle Street | TA7 9QB TA7 9QD TA7 9QG |
| Mill Lane | TA7 9ND |
| Monks Drive | TA7 9NL |
| Moor Road | TA7 9BU TA7 9BY TA7 9DA |
| Newlyn Lane | TA7 9DE |
| Norman Lane | TA7 9QE |
| Northbrook Drive | TA7 9LW |
| Northbrook Road | TA7 9LN TA7 9NS TA7 9NR |
| Nythe | TA7 9BN |
| Nythe Road | TA7 9BL |
| Old Nursery Drive | TA7 9RB |
| Old School Close | TA7 9RA |
| Orchard Way | TA7 9NU |
| Partridge Close | TA7 9BA |
| Pedwell Caravan Park | TA7 9BQ |
| Pedwell Hill | TA7 9BD |
| Pedwell Lane | TA7 9PD TA7 9BE |
| Pit Hill Lane | TA7 9BT |
| Ridgeway | TA7 9PP |
| School Hill | TA7 9PN |
| School Lane | TA7 9LT |
| Shapwick Hill | TA7 9NA |
| Spring Lane | TA7 9DD |
| Stagman Lane | TA7 9BJ |
| Station Road | TA7 9NH TA7 9NJ TA7 9QP |
| Sutton Lane | BA16 9RJ |
| Tapmoor | TA7 9BZ |
| Taunton Road | TA7 9BG TA7 9BH |
| The Batch | TA7 9PG TA7 9PH TA7 9DF |
| The Courtyard | TA7 9LQ |
| Timberyard | TA7 9NG |
| Vicarage Lane | TA7 9LR |
| West Street | TA7 9PQ |
| Whitley Lane | TA7 9QW |
| TA7 9BP TA7 9BW TA7 9NW TA7 9NF TA7 9NT |
Transport near East Polden
- FAQ
- Price Paid By Year
- Property Type Price
Frequently asked questions about East Polden
What is the average price for a property for sale in East Polden?
The average price for a property for sale in East Polden is £454,957. This amount is 64% higher than the average price in Bridgwater. There are 54 property listings for sale in East Polden.
What streets have the most expensive properties for sale in East Polden?
The streets with the most expensive properties for sale in East Polden are Main Road at an average of £975,000, Mill Lane at an average of £837,500 and Pedwell Hill at an average of £741,722.
What streets have the most affordable properties for sale in East Polden?
The streets with the most affordable properties for sale in East Polden are Old School Close at an average of £233,500, Pedwell Lane at an average of £280,000 and The Batch at an average of £280,000.
Which train stations are available in or near East Polden?
Some of the train stations available in or near East Polden are Bridgwater, Highbridge and Burnham and Castle Cary.
Property Price Paid in East Polden by Year
The average sold property price by year was:
| Year | Average Sold Price | Price Change |
Sold Properties
|
|---|---|---|---|
| 2025 | £400,220 | -15% |
20 Properties |
| 2024 | £459,289 | -15% |
23 Properties |
| 2023 | £526,035 | 19% |
14 Properties |
| 2022 | £428,688 | 3% |
34 Properties |
| 2021 | £414,931 | -1% |
42 Properties |
| 2020 | £417,279 | 21% |
32 Properties |
| 2019 | £329,752 | -7% |
28 Properties |
| 2018 | £351,998 | -2% |
26 Properties |
| 2017 | £358,071 | 18% |
40 Properties |
| 2016 | £294,476 | -4% |
28 Properties |
| 2015 | £306,775 | -1% |
29 Properties |
| 2014 | £309,607 | -2% |
32 Properties |
| 2013 | £316,920 | 32% |
36 Properties |
| 2012 | £213,956 | -21% |
23 Properties |
| 2011 | £257,950 | 2% |
21 Properties |
| 2010 | £254,060 | -7% |
20 Properties |
| 2009 | £271,204 | -15% |
22 Properties |
| 2008 | £310,989 | 10% |
14 Properties |
| 2007 | £279,582 | -4% |
48 Properties |
| 2006 | £289,601 | 20% |
46 Properties |
| 2005 | £230,466 | 1% |
38 Properties |
| 2004 | £229,181 | -11% |
43 Properties |
| 2003 | £254,050 | 22% |
33 Properties |
| 2002 | £196,916 | 35% |
48 Properties |
| 2001 | £128,238 | -1% |
43 Properties |
| 2000 | £128,926 | -4% |
39 Properties |
| 1999 | £133,560 | 8% |
51 Properties |
| 1998 | £122,233 | 16% |
39 Properties |
| 1997 | £103,275 | 17% |
40 Properties |
| 1996 | £85,363 | 8% |
33 Properties |
| 1995 | £78,526 | - |
34 Properties |
Property Price per Property Type in East Polden
Here you can find historic sold price data in order to help with your property search.
The average Property Paid Price for specific property types in the last three years are:
| Property Type | Average Sold Price | Sold Properties |
|---|---|---|
| Semi Detached House | £323,521.00 | 19 Semi Detached Houses |
| Detached House | £572,145.00 | 32 Detached Houses |
| Terraced House | £255,700.00 | 5 Terraced Houses |
| Flat | £198,500.00 | 1 Flat |

