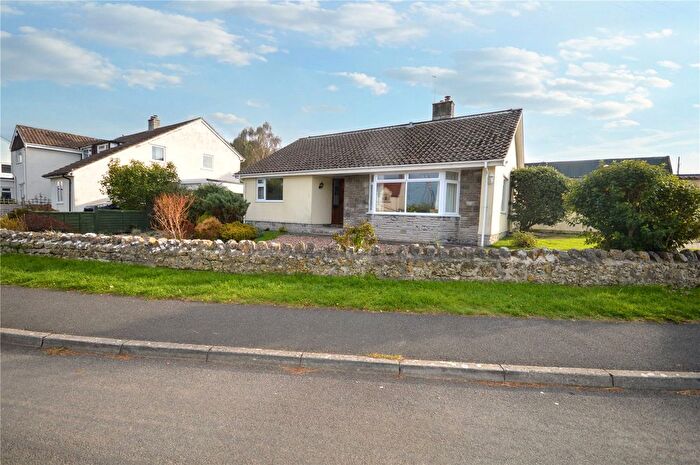
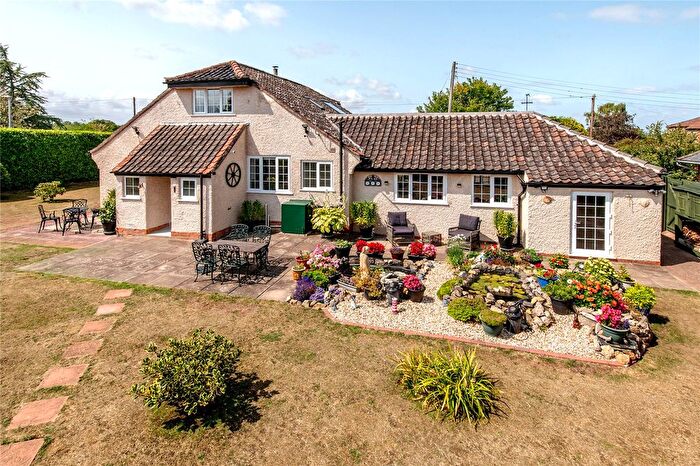
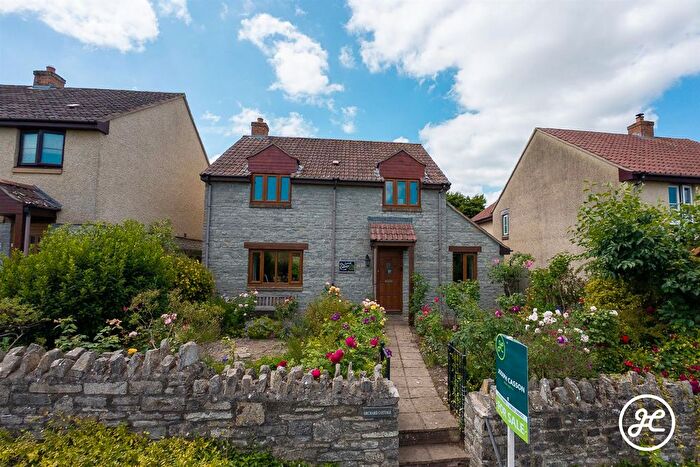
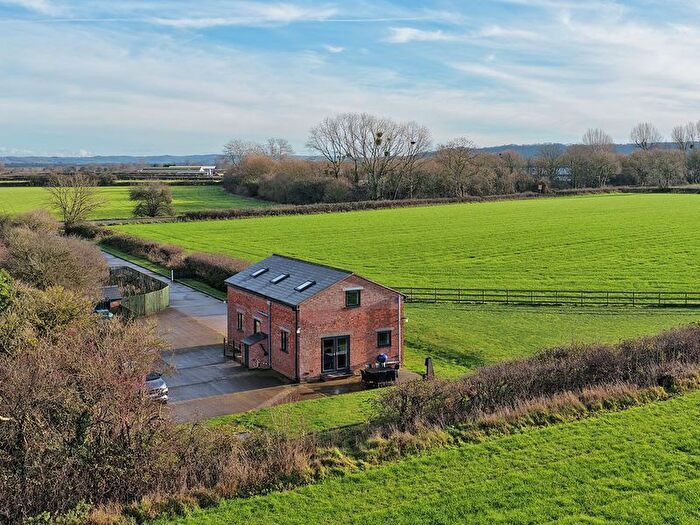
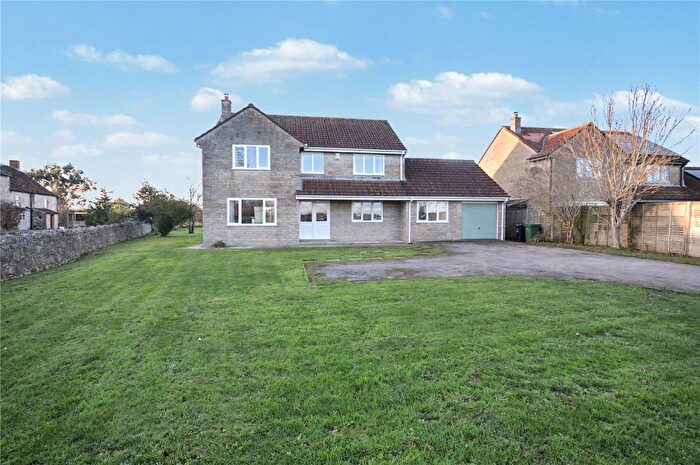
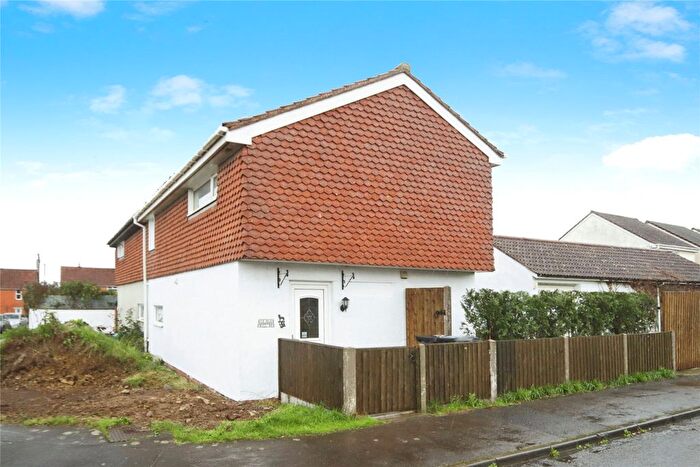
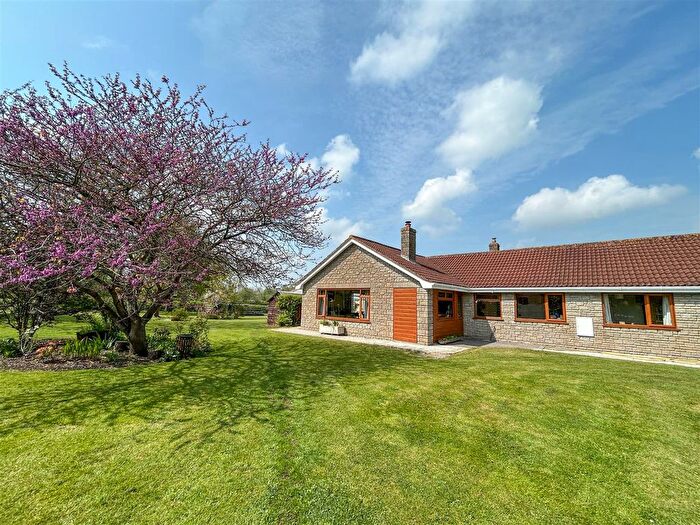
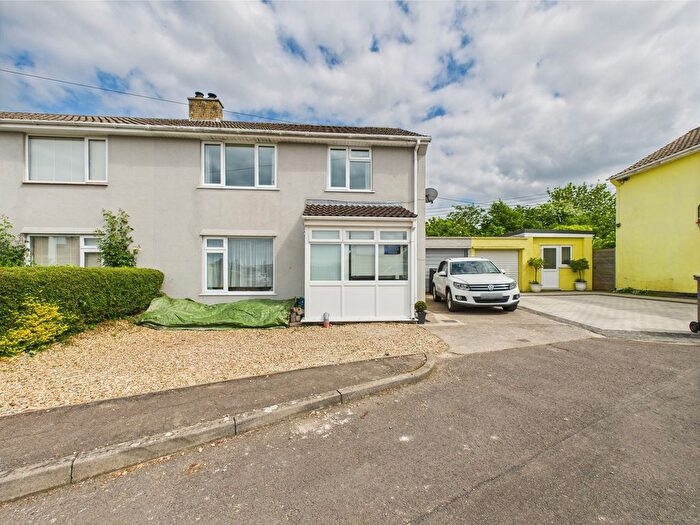
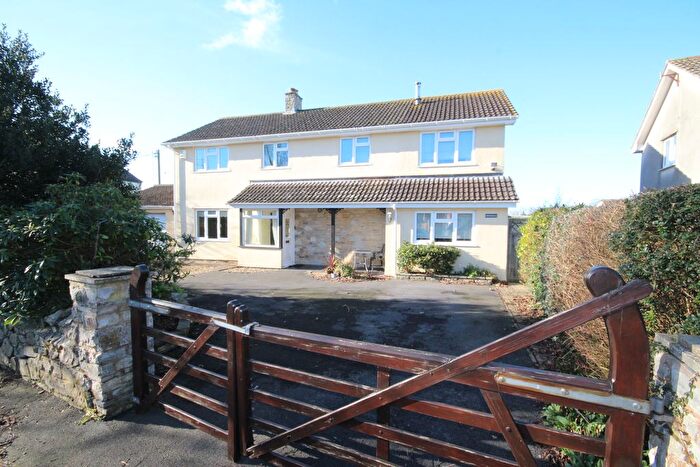
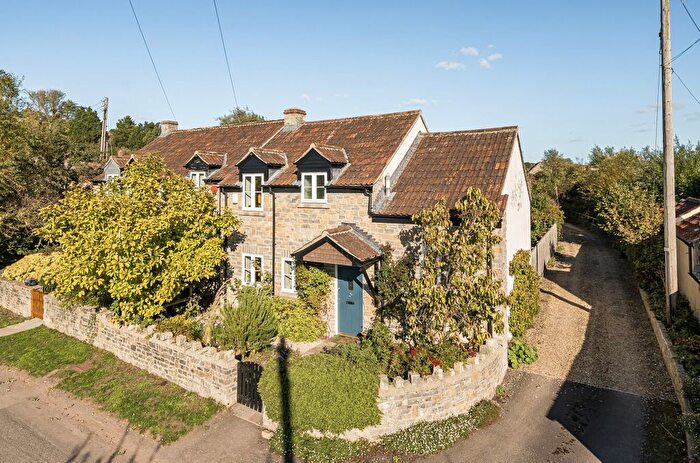
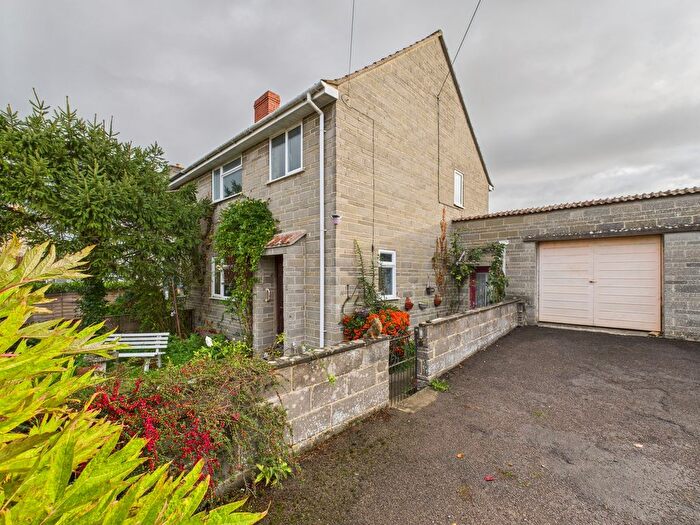
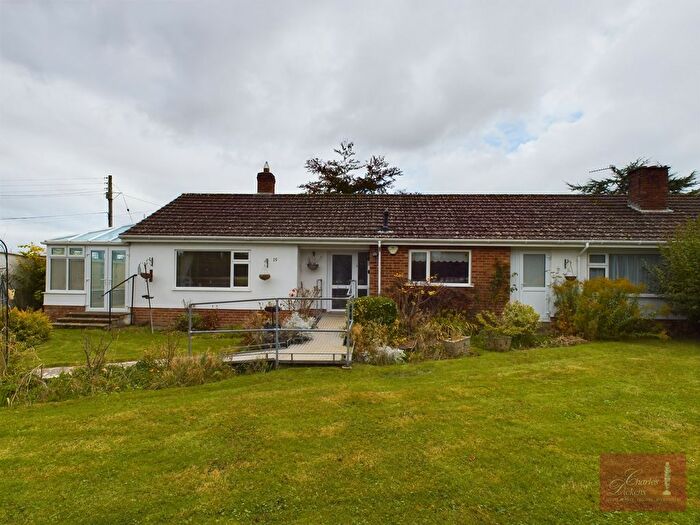
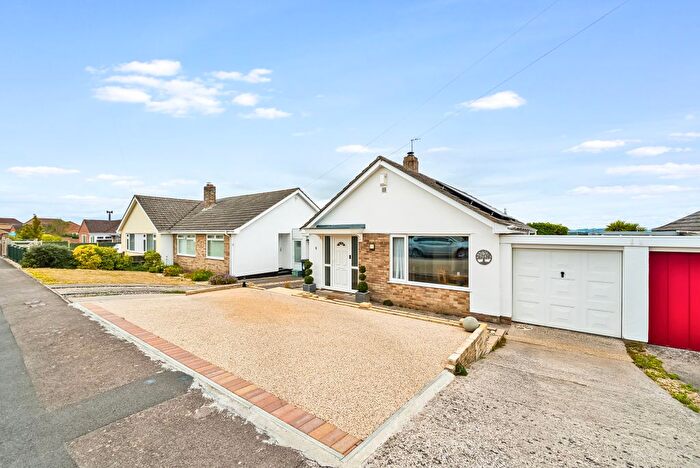
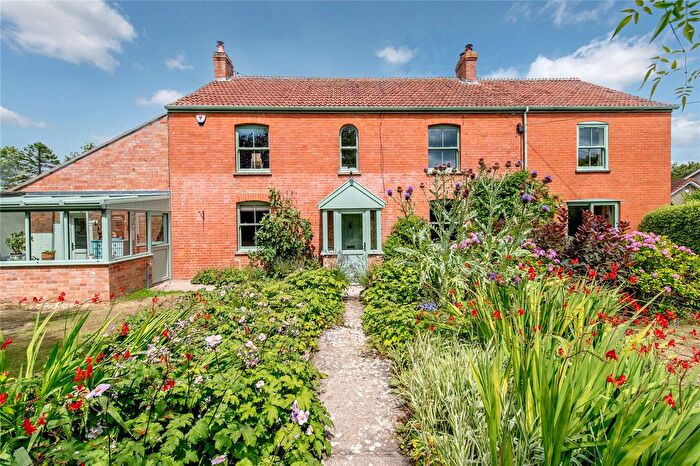
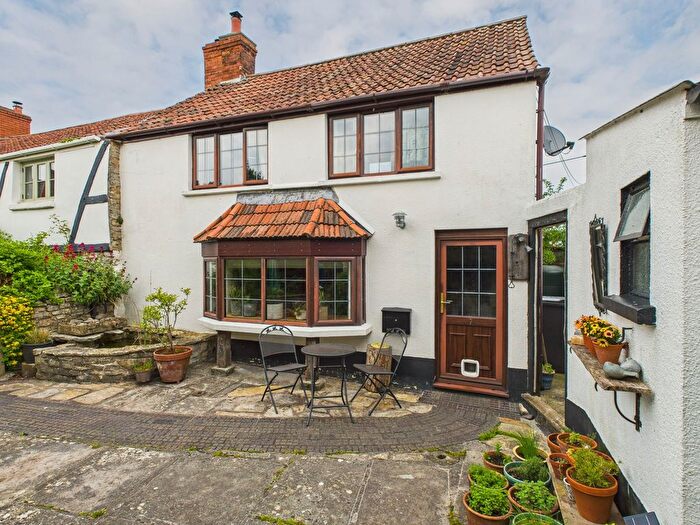
Houses for sale & to rent in West Polden, Bridgwater
House Prices in West Polden
Properties in West Polden have an average house price of £431,898.00 and had 66 Property Transactions within the last 3 years¹.
West Polden is an area in Bridgwater, Somerset with 966 households², where the most expensive property was sold for £980,000.00.
Properties for sale in West Polden
Previously listed properties in West Polden
Roads and Postcodes in West Polden
Navigate through our locations to find the location of your next house in West Polden, Bridgwater for sale or to rent.
| Streets | Postcodes |
|---|---|
| Barton Rise | TA7 9EB |
| Broadmead Lane | TA7 9JS TA7 9JX TA7 9JZ |
| Broadway | TA7 9DJ TA7 9DN TA7 9DP TA7 9DR TA7 9EQ TA7 9EW TA7 9HA TA7 9JB TA7 9JJ TA7 9JL TA7 9JP TA7 9BF TA7 9EN TA7 9JN |
| Broadway Avenue | TA7 9ER |
| Brook Lane | TA7 9HG TA7 9HH |
| Burtle Road | TA7 8NB |
| Catcott Broad Drove | TA7 8NQ |
| Catcott Road | TA7 8NE TA7 8NG |
| Centre Road | TA7 9JR |
| Chandlers Lane | TA7 9JY |
| Chapel Close | TA7 9EP |
| Chilton Polden Hill | TA7 9AH TA7 9AL |
| Church Farm Close | TA7 9RZ |
| Church Lane | TA7 9DU |
| Church Road | TA7 9JT |
| Church Way | TA7 9JA |
| Combe Lane | TA7 9DQ |
| Edington Road | TA7 8NX |
| Ford Lane | TA7 9AF |
| Goose Lane | TA7 9ED |
| Goosegreen Cottages | TA7 9AP |
| Hayne Walk | TA7 9EU |
| Hector Road | TA7 9HL |
| Holywell Road | TA7 9JH TA7 9LB TA7 9LD TA7 9LE |
| King William Road | TA7 9HU |
| Langland Drive | TA7 9AX |
| Langland Lane | TA7 9HR |
| Lippetts Way | TA7 9HY TA7 9HZ |
| Little Leaze Lane | TA7 9HJ |
| Manor Court | TA7 9RY |
| Manor Road | TA7 9HB TA7 9HD TA7 9HF TA7 9HT |
| Mark Road | TA7 8NJ TA7 8NL |
| Moor Road | TA7 9AR |
| Nidon Lane | TA7 9HQ TA7 9LA |
| Old School Lane | TA7 9HE |
| Old Vicarage Close | TA7 9DY |
| Priory Close | TA7 9EX |
| Priory Road | TA7 9EH TA7 9DH |
| Redlands Lane | TA7 9JW |
| Robins Drive | TA7 8NY |
| Robins Lane | TA7 8NT |
| Scotts Lane | TA7 9HX |
| Scrubbits Lane | TA7 9EJ |
| Smallways Lane | TA7 9EG |
| South Moors Lane | TA7 9DZ |
| St Edwards Close | TA7 9DX |
| Station Road | TA7 8NU |
| Stawell Road | TA7 9AY TA7 9AZ |
| Steel Lane | TA7 9HP TA7 9HW |
| Stradling Close | TA7 9JF |
| Suprema Avenue | TA7 9LF |
| The Grange | TA7 9DW |
| The Standards | TA7 9HN |
| The Walls | TA7 9JU |
| The Walnuts | TA7 9ES |
| Tower Road | TA7 9AJ |
| Townsend Lane | TA7 9EL |
| Vine Orchard | TA7 9BB |
| Weares Lane | TA7 9HS |
| Willmotts Close | TA7 9DL |
| Wood Lane | TA7 9AB |
| TA7 8ND TA7 8NF TA7 8NH TA7 8NW TA7 9AA TA7 9AD TA7 9AE TA7 9AS TA7 9AT TA7 9AU TA7 9AW TA7 8NN TA7 9AN TA7 9EE TA7 9EF TA7 9ET |
Transport near West Polden
-
Bridgwater Station
-
Highbridge and Burnham Station
-
Taunton Station
-
Weston Milton Station
-
Weston-Super-Mare Station
-
Worle Station
- FAQ
- Price Paid By Year
- Property Type Price
Frequently asked questions about West Polden
What is the average price for a property for sale in West Polden?
The average price for a property for sale in West Polden is £431,898. This amount is 55% higher than the average price in Bridgwater. There are 141 property listings for sale in West Polden.
What streets have the most expensive properties for sale in West Polden?
The streets with the most expensive properties for sale in West Polden are Broadmead Lane at an average of £717,500, The Walls at an average of £652,500 and Manor Road at an average of £645,668.
What streets have the most affordable properties for sale in West Polden?
The streets with the most affordable properties for sale in West Polden are Barton Rise at an average of £279,950, Station Road at an average of £286,875 and Willmotts Close at an average of £294,975.
Which train stations are available in or near West Polden?
Some of the train stations available in or near West Polden are Bridgwater, Highbridge and Burnham and Taunton.
Property Price Paid in West Polden by Year
The average sold property price by year was:
| Year | Average Sold Price | Price Change |
Sold Properties
|
|---|---|---|---|
| 2025 | £443,729 | 4% |
17 Properties |
| 2024 | £427,962 | 0,1% |
28 Properties |
| 2023 | £427,567 | -30% |
21 Properties |
| 2022 | £553,743 | 24% |
29 Properties |
| 2021 | £419,771 | 13% |
47 Properties |
| 2020 | £366,203 | -4% |
35 Properties |
| 2019 | £381,936 | 9% |
22 Properties |
| 2018 | £347,137 | -16% |
32 Properties |
| 2017 | £401,964 | 17% |
42 Properties |
| 2016 | £331,742 | 14% |
39 Properties |
| 2015 | £285,308 | -12% |
42 Properties |
| 2014 | £319,941 | 12% |
37 Properties |
| 2013 | £283,019 | 13% |
48 Properties |
| 2012 | £246,571 | -18% |
25 Properties |
| 2011 | £291,341 | -16% |
27 Properties |
| 2010 | £336,944 | 10% |
27 Properties |
| 2009 | £304,483 | 20% |
30 Properties |
| 2008 | £243,945 | -28% |
19 Properties |
| 2007 | £312,131 | 5% |
52 Properties |
| 2006 | £297,160 | 6% |
49 Properties |
| 2005 | £278,666 | 1% |
33 Properties |
| 2004 | £275,142 | 14% |
41 Properties |
| 2003 | £237,762 | 19% |
35 Properties |
| 2002 | £193,674 | 14% |
54 Properties |
| 2001 | £166,814 | 17% |
42 Properties |
| 2000 | £137,693 | 11% |
36 Properties |
| 1999 | £122,792 | 10% |
49 Properties |
| 1998 | £110,134 | -10% |
33 Properties |
| 1997 | £120,630 | 18% |
65 Properties |
| 1996 | £98,331 | 8% |
46 Properties |
| 1995 | £90,406 | - |
24 Properties |
Property Price per Property Type in West Polden
Here you can find historic sold price data in order to help with your property search.
The average Property Paid Price for specific property types in the last three years are:
| Property Type | Average Sold Price | Sold Properties |
|---|---|---|
| Semi Detached House | £326,611.00 | 18 Semi Detached Houses |
| Detached House | £482,347.00 | 44 Detached Houses |
| Terraced House | £350,750.00 | 4 Terraced Houses |

