
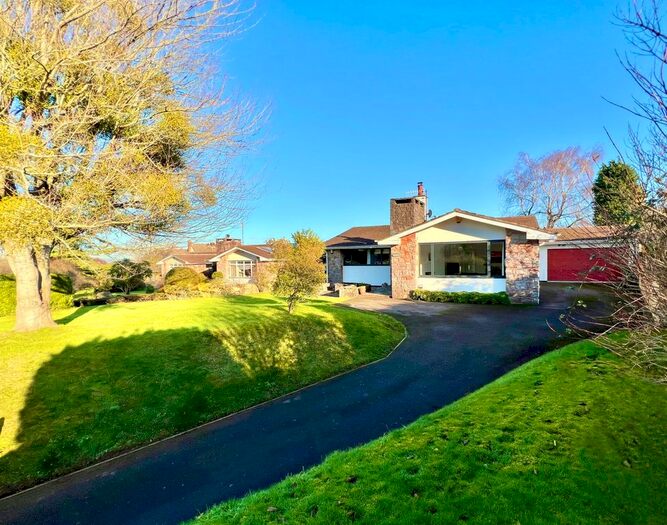
Houses for sale in Bristol, Somerset
House Prices in Bristol
Properties in Bristol have an average house price of £825k and had 1 Property Transaction within the last 3 years.¹
Bristol is an area in Somerset with 294 households², where the most expensive property was sold for £825k.
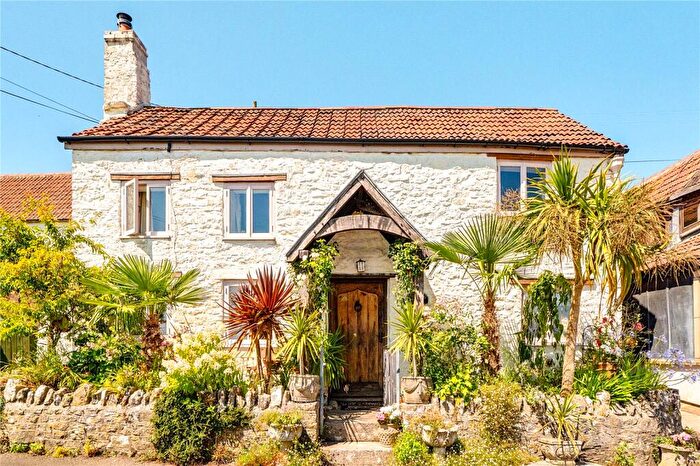
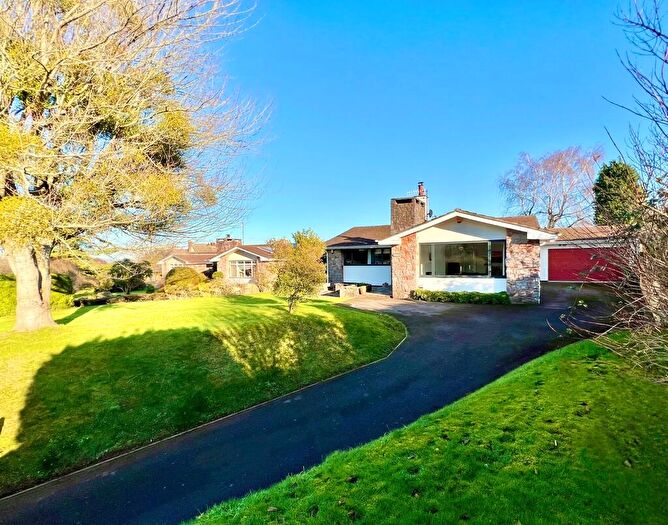
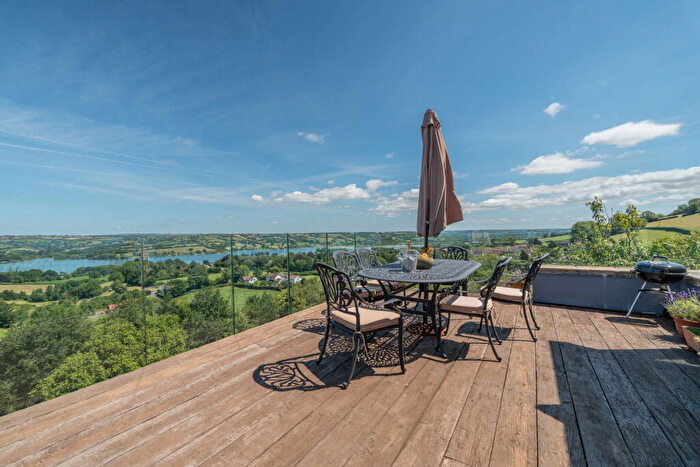
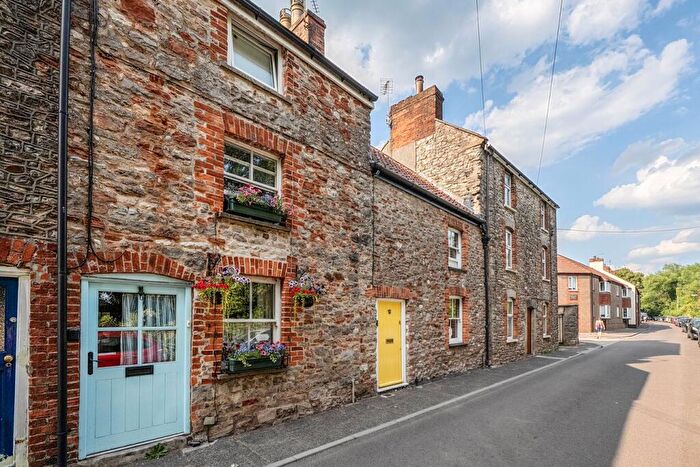
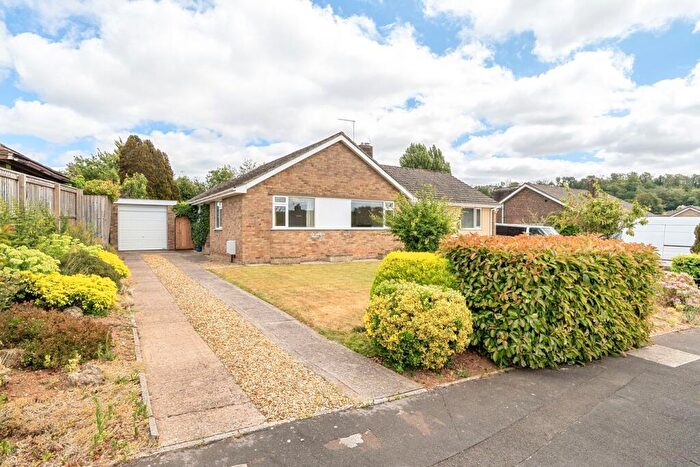
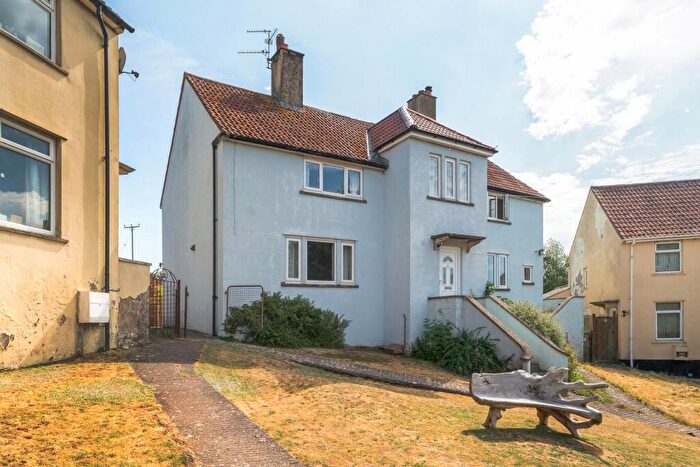
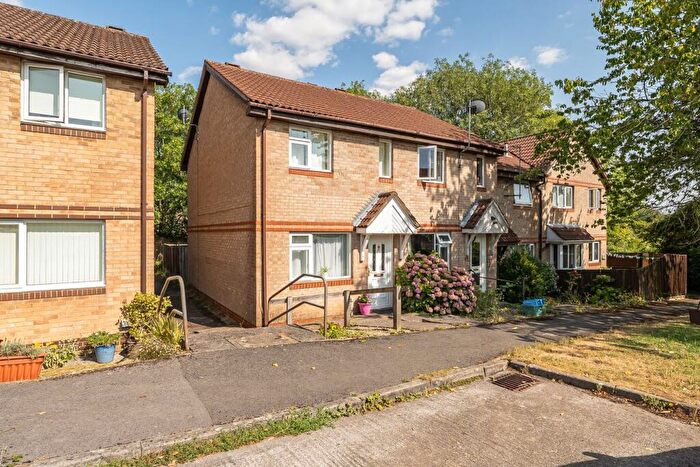
Properties for sale in Bristol

![]()
If you are looking to sell your house, let it out, or receive a property valuation, an expert can help you.
Click the button below to get started.
Neighbourhoods in Bristol
Navigate through our locations to find the location of your next house in Bristol, Somerset for sale or to rent.
- Cheddar And Shipham
- Chewton Mendip And Ston Easton
- Keynsham North
- Portishead North
- Portishead South
- Portishead East
- Keynsham East
- Keynsham South
- Saltford
- Publow & Whitchurch
- Mendip
- Clutton & Farmborough
- High Littleton
- Paulton
- Blagdon & Churchill
- Congresbury & Puxton
- Wrington
- Chew Valley
- Winford
- Long Ashton
- Nailsea Yeo
- Backwell
- Nailsea West End
- Yatton
Property price trends in Bristol
According to the latest Land Registry data, the average home in Bristol sold for £825,000 in 2024. That figure comes from 44 sales logged over the past 28 years.
Prices have fallen back over the last three years. Compared with 2020, when the typical sale came in around £2,065,000, that's a fall of roughly 60%.
Looking back five years, average prices are up about 51.4% since 2018, a gain of around £280,000 in cash terms.
Zoom out to the past decade for the fuller picture. Back in 2014, homes here averaged £535,000, so the typical sold price has climbed about 54.2% since then, roughly 4.4% a year. Stretch the view to fifteen years and that annual pace eases back to about 1.6%.
Frequently asked questions about Bristol
What is the average price for a property for sale in Bristol?
The average price for a property for sale in Bristol is £825,000. This amount is 160% higher than the average price in Somerset. There are 3,533 property listings for sale in Bristol.
Which train stations are available in or near Bristol?
Some of the train stations available in or near Bristol are Nailsea and Backwell, Yatton and Parson Street.
Property Price Paid in Bristol by Year
The average sold property price by year was:
| Year | Average Sold Price | Price Change |
Sold Properties
|
|---|---|---|---|
| 2024 | £825,000 | -9% |
1 Property |
| 2022 | £900,000 | -129% |
1 Property |
| 2020 | £2,065,000 | 74% |
2 Properties |
| 2018 | £545,000 | 3% |
1 Property |
| 2017 | £530,000 | 12% |
1 Property |
| 2016 | £465,000 | -13% |
1 Property |
| 2015 | £527,500 | -1% |
2 Properties |
| 2014 | £535,000 | 32% |
1 Property |
| 2012 | £364,000 | -106% |
2 Properties |
| 2011 | £750,000 | 19% |
1 Property |
Property Price per Property Type in Bristol
Here you can find historic sold price data in order to help with your property search.
The average Property Paid Price for specific property types in the last three years are:
| Property Type | Average Sold Price | Sold Properties |
|---|---|---|
| Detached House | £825,000.00 | 1 Detached House |
Transport in Bristol
Please see below transportation links in this area:
