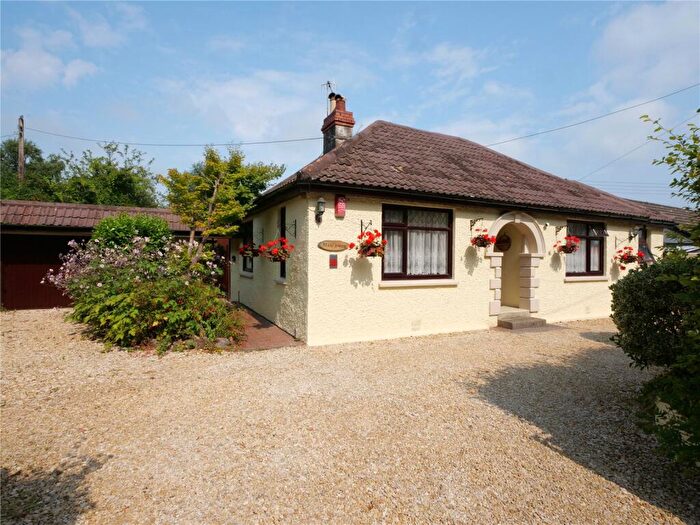
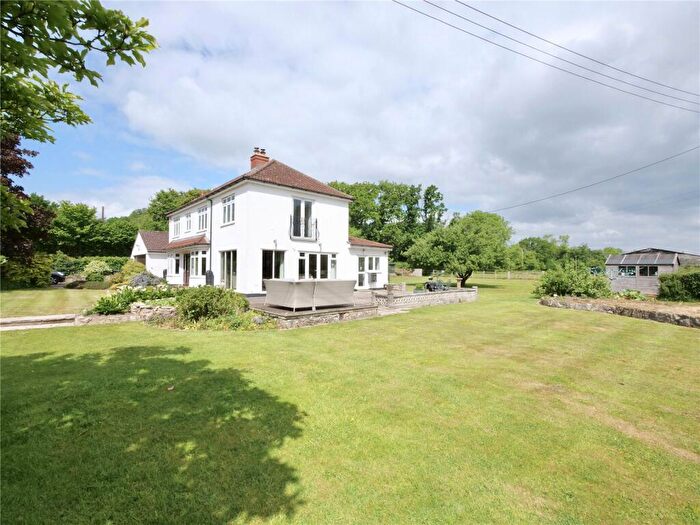
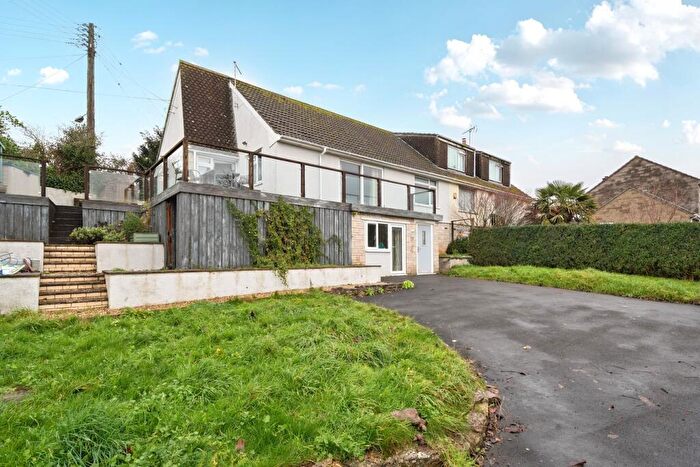
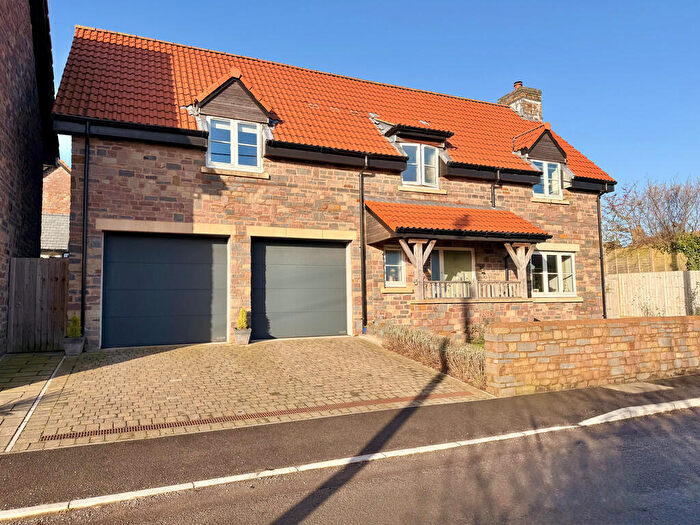
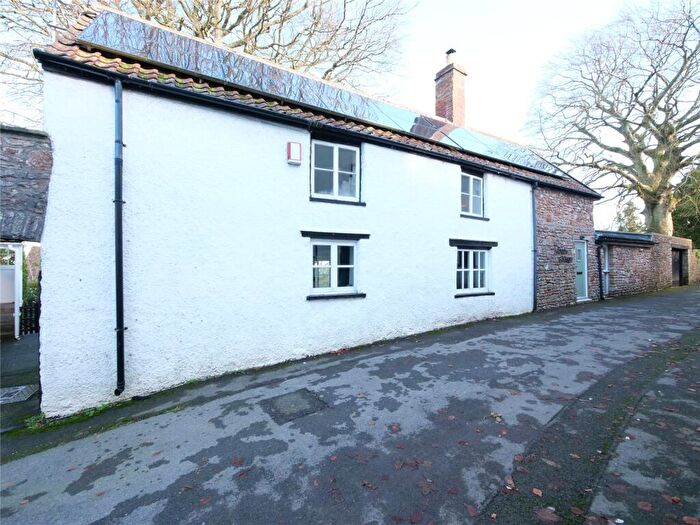
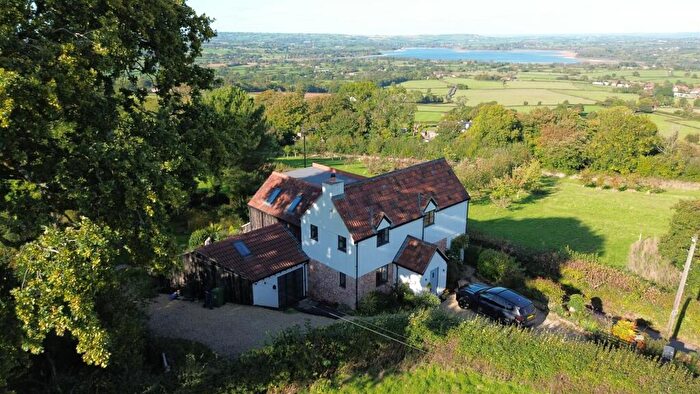
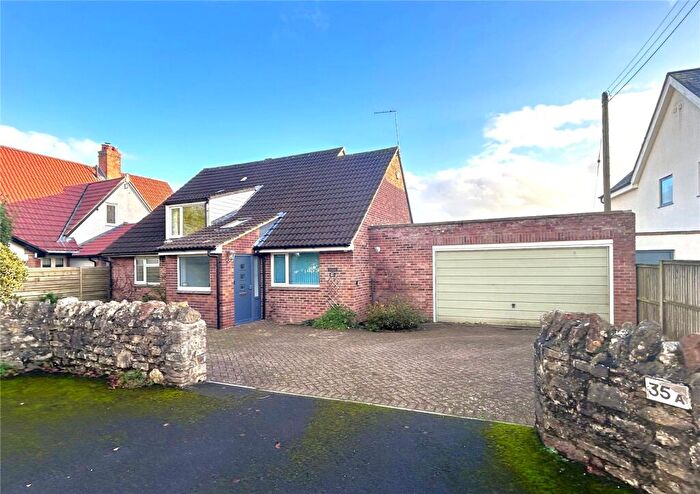
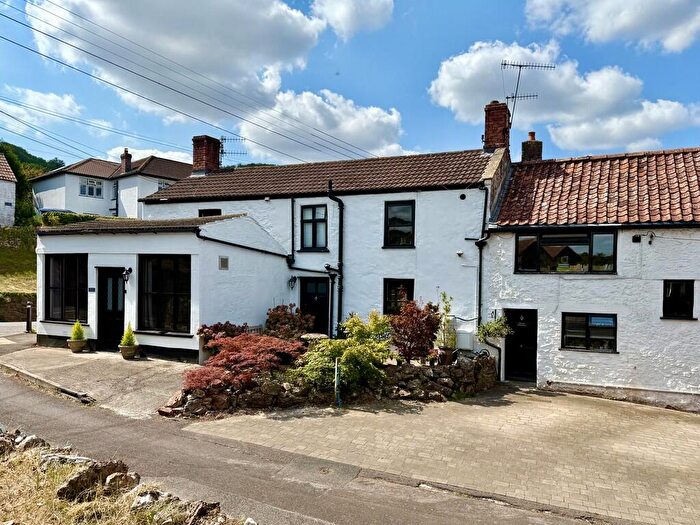
Houses for sale & to rent in Chewton Mendip And Ston Easton, Bristol
House Prices in Chewton Mendip And Ston Easton
Properties in Chewton Mendip And Ston Easton have an average house price of £825,000.00 and had 1 Property Transaction within the last 3 years¹.
Chewton Mendip And Ston Easton is an area in Bristol, Somerset with 94 households², where the most expensive property was sold for £825,000.00.
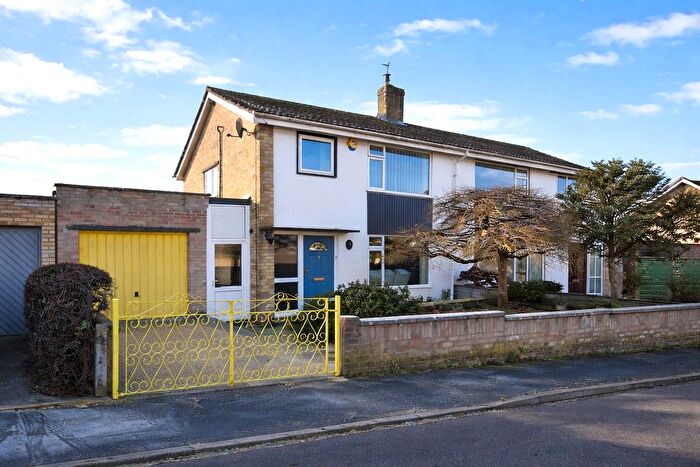
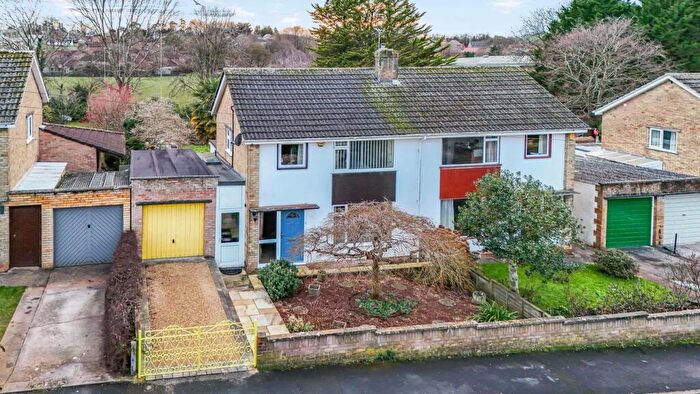
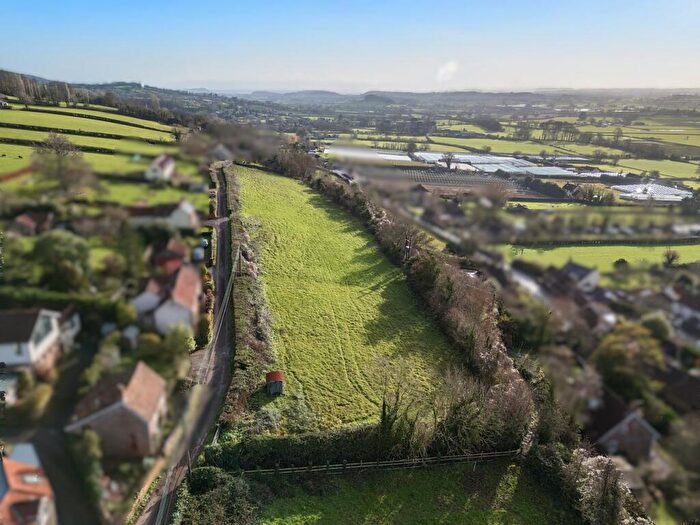
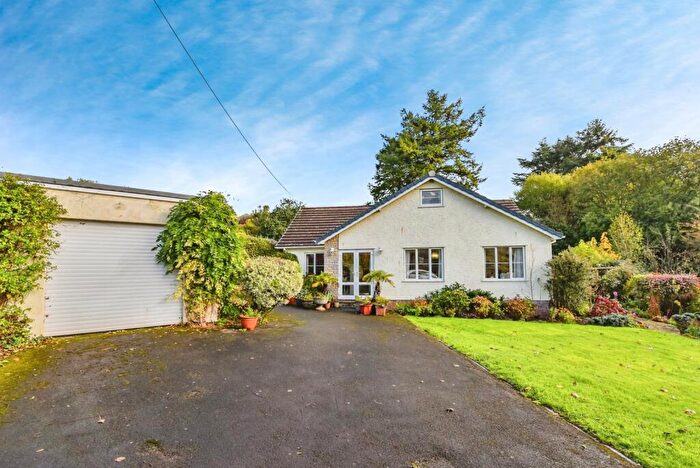
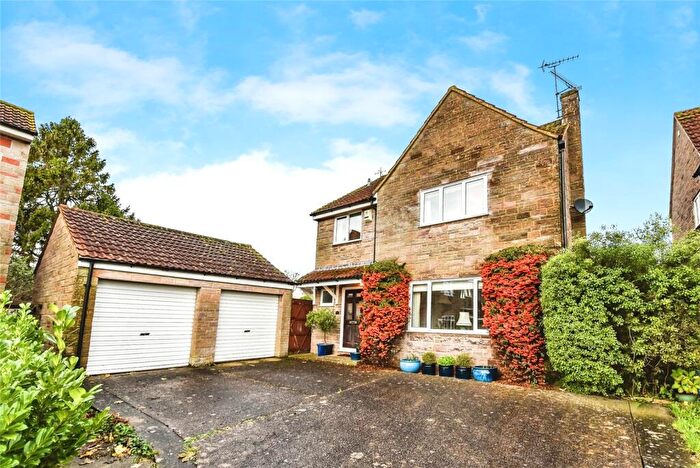
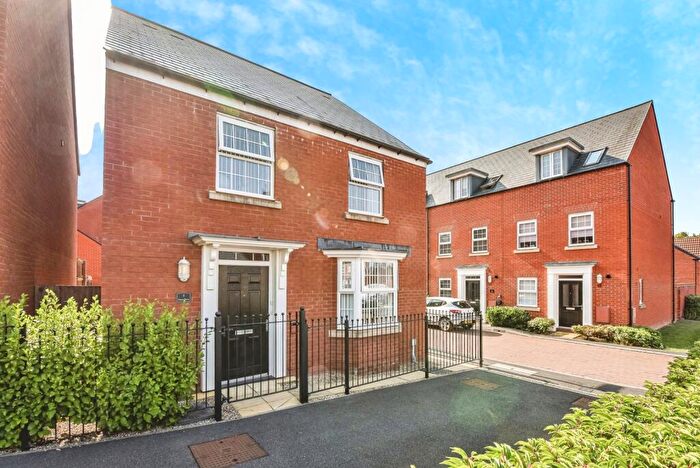
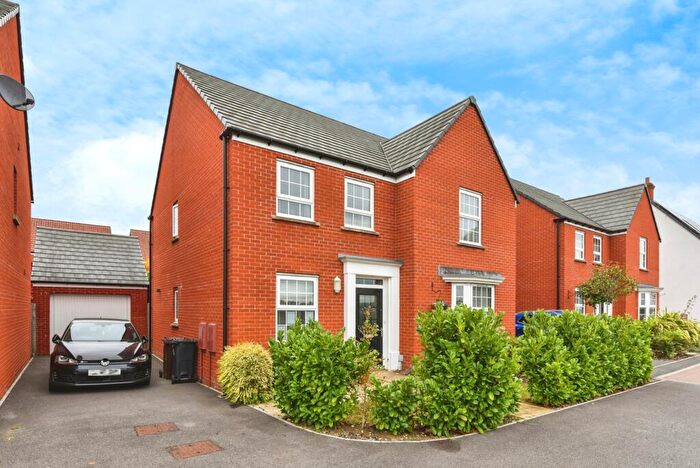
Properties for sale in Chewton Mendip And Ston Easton
Roads and Postcodes in Chewton Mendip And Ston Easton
Navigate through our locations to find the location of your next house in Chewton Mendip And Ston Easton, Bristol for sale or to rent.
| Streets | Postcodes |
|---|---|
| Broad Road | BS40 7XJ |
| Charterhouse | BS40 7XR BS40 7XS BS40 7XX BS40 7XP |
| Charterhouse On Mendip | BS40 7XW |
| Cheddar Road | BS40 6LD |
| Lambs Bottom | BS40 6DG |
| Marsh Lane | BS39 6TS |
| Nordrach Lane | BS40 6LG BS40 6LH BS40 6LJ BS40 6LQ |
| Rush Hill | BS39 6TR |
| Smithams Hill | BS40 6DB |
| Two Trees | BS40 7XY |
| Ubley Drove | BS40 7XN |
| Western Lane | BS40 6EP |
| BS40 6DD BS40 6LF BS40 7TY BS40 6DE BS40 6DF BS40 6DQ BS40 6EL BS40 6EN BS40 6LE BS40 7XL |
Transport near Chewton Mendip And Ston Easton
- FAQ
- Price Paid By Year
- Property Type Price
Frequently asked questions about Chewton Mendip And Ston Easton
What is the average price for a property for sale in Chewton Mendip And Ston Easton?
The average price for a property for sale in Chewton Mendip And Ston Easton is £825,000. This amount is 4% lower than the average price in Bristol. There are 1,186 property listings for sale in Chewton Mendip And Ston Easton.
Which train stations are available in or near Chewton Mendip And Ston Easton?
Some of the train stations available in or near Chewton Mendip And Ston Easton are Nailsea and Backwell, Yatton and Parson Street.
Property Price Paid in Chewton Mendip And Ston Easton by Year
The average sold property price by year was:
| Year | Average Sold Price | Price Change |
Sold Properties
|
|---|---|---|---|
| 2024 | £825,000 | -150% |
1 Property |
| 2020 | £2,065,000 | 74% |
2 Properties |
| 2018 | £545,000 | 3% |
1 Property |
| 2017 | £530,000 | 12% |
1 Property |
| 2016 | £465,000 | -13% |
1 Property |
| 2015 | £527,500 | -1% |
2 Properties |
| 2014 | £535,000 | 32% |
1 Property |
| 2012 | £364,000 | -76% |
2 Properties |
| 2008 | £640,000 | 14% |
1 Property |
| 2007 | £550,000 | 2% |
1 Property |
| 2006 | £540,000 | -5% |
1 Property |
| 2005 | £568,750 | 1% |
2 Properties |
| 2004 | £562,000 | 41% |
1 Property |
| 2003 | £333,800 | 5% |
5 Properties |
| 2002 | £317,000 | -6% |
1 Property |
| 2001 | £337,333 | 12% |
3 Properties |
| 2000 | £298,000 | 21% |
1 Property |
| 1999 | £236,080 | 9% |
4 Properties |
| 1997 | £215,000 | 36% |
2 Properties |
| 1996 | £138,000 | - |
3 Properties |
Property Price per Property Type in Chewton Mendip And Ston Easton
Here you can find historic sold price data in order to help with your property search.
The average Property Paid Price for specific property types in the last three years are:
| Property Type | Average Sold Price | Sold Properties |
|---|---|---|
| Detached House | £825,000.00 | 1 Detached House |

