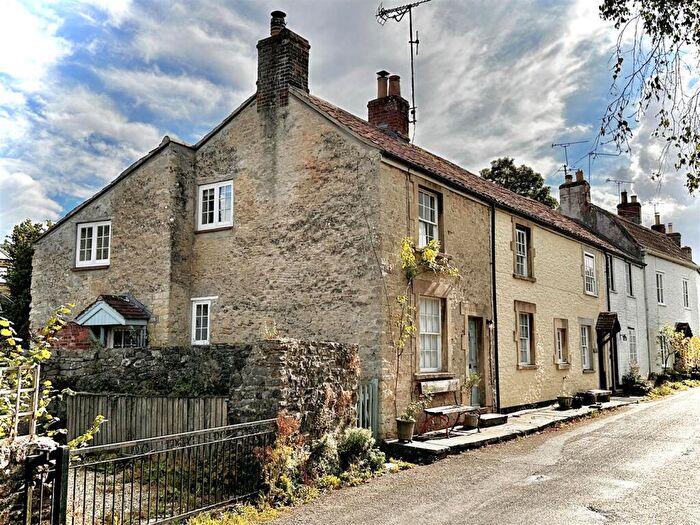
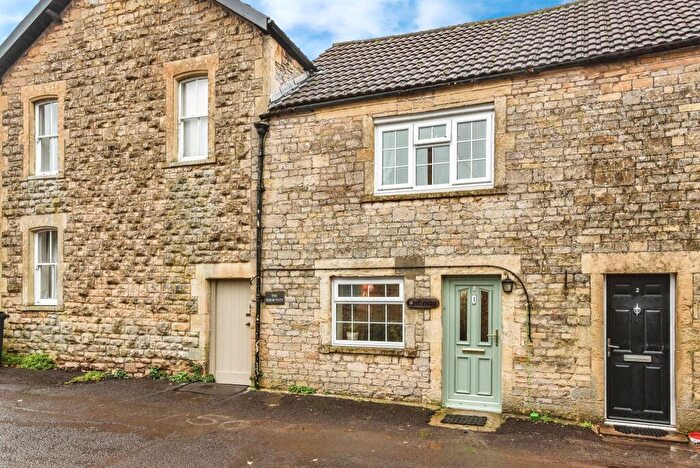
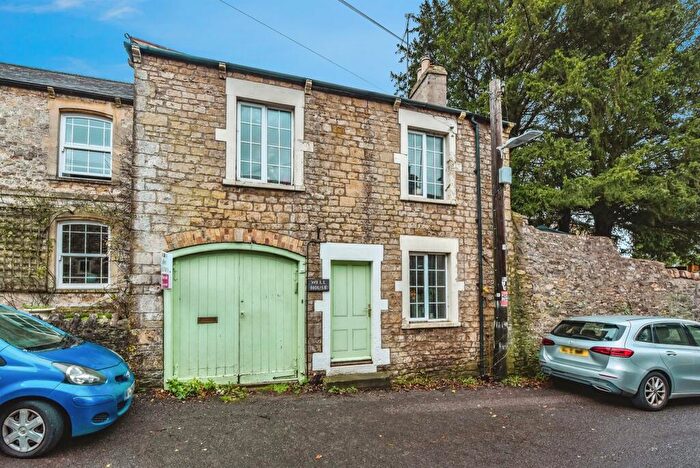
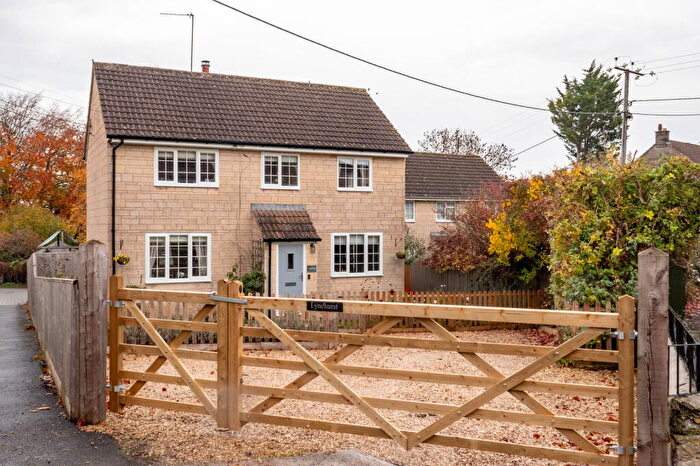
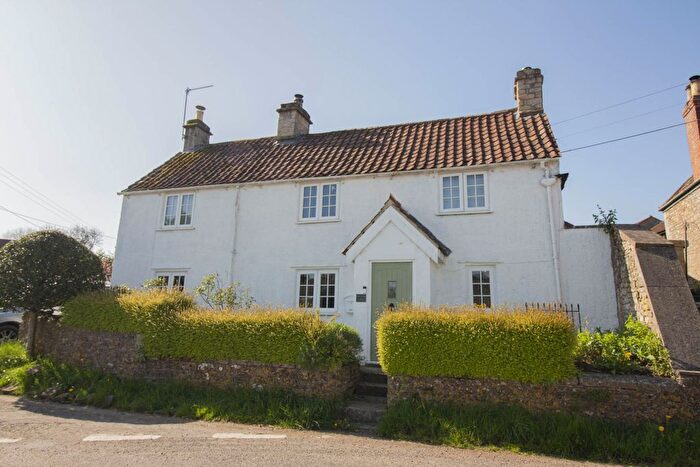
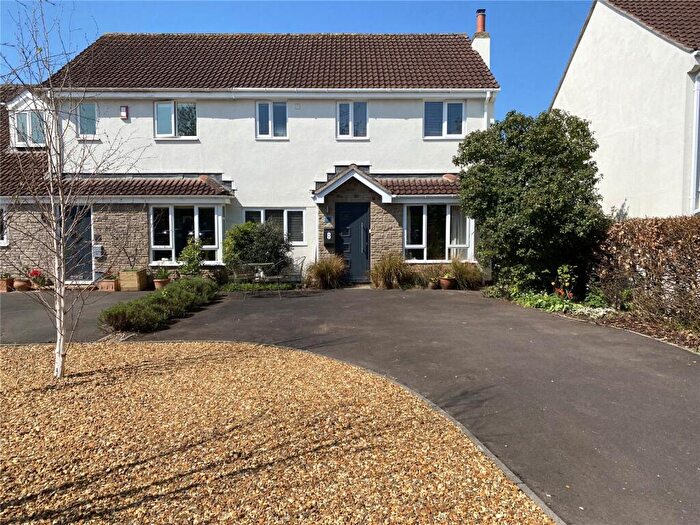
Houses for sale & to rent in Cranmore, Doulting And Nunney, Frome
House Prices in Cranmore, Doulting And Nunney
Properties in Cranmore, Doulting And Nunney have an average house price of £443,877.00 and had 40 Property Transactions within the last 3 years¹.
Cranmore, Doulting And Nunney is an area in Frome, Somerset with 461 households², where the most expensive property was sold for £1,397,180.00.
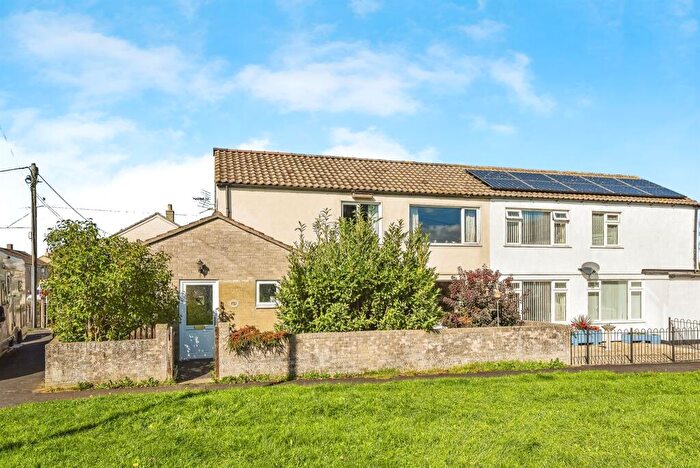
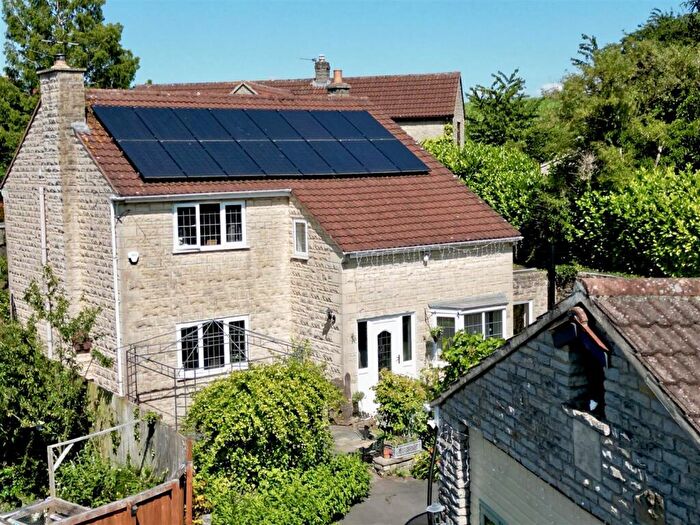
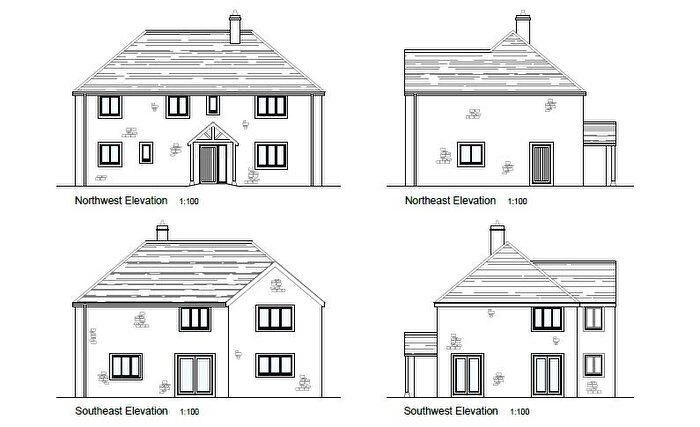
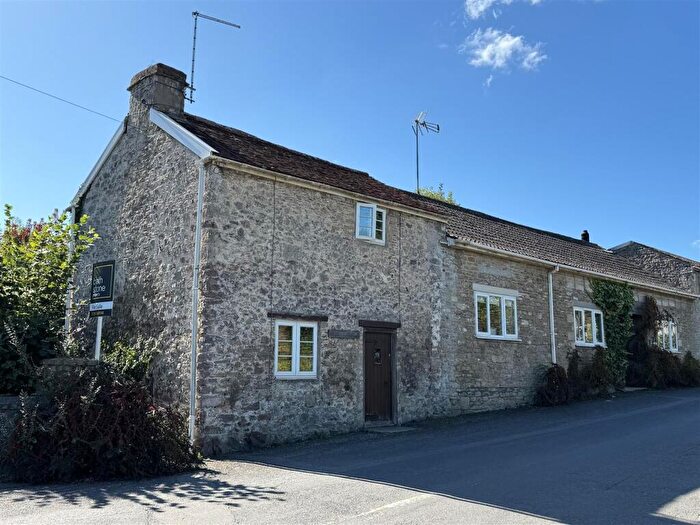
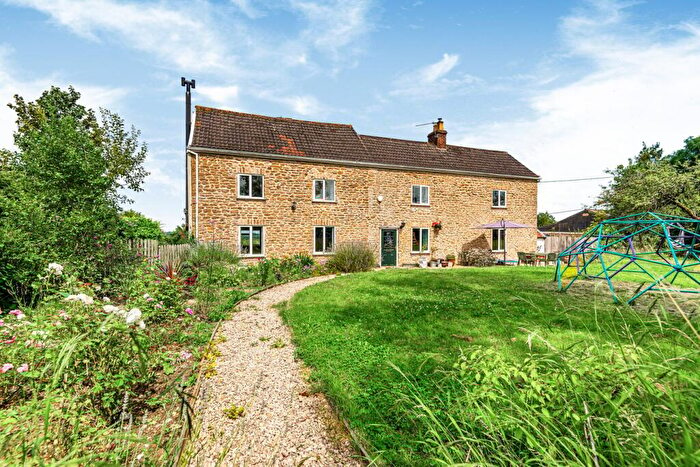
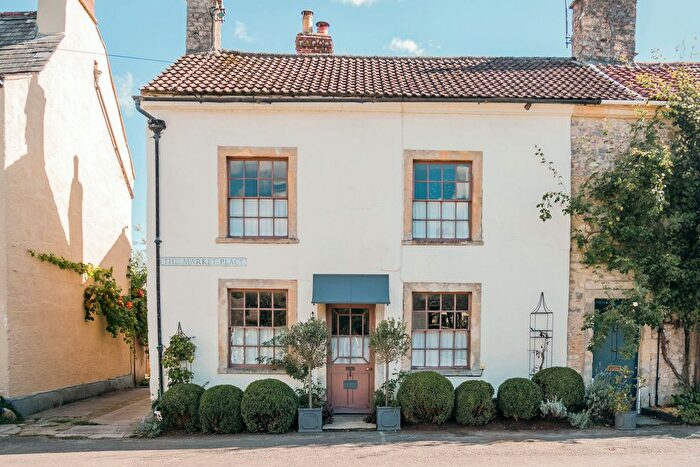
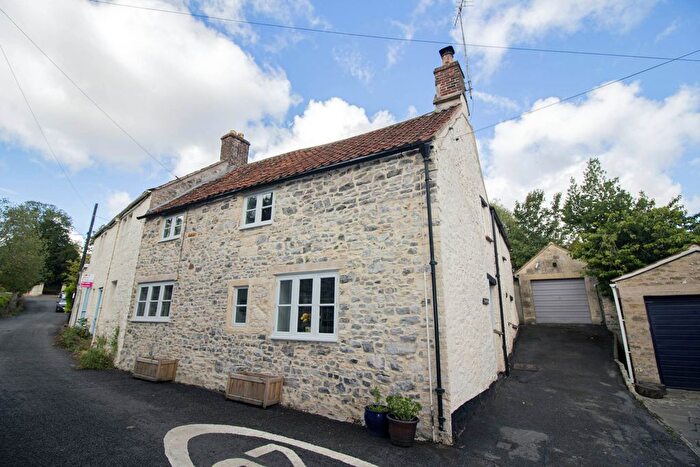
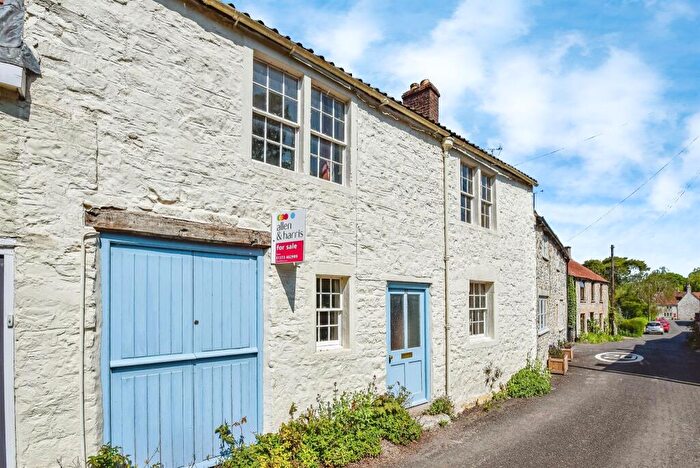
Properties for sale in Cranmore, Doulting And Nunney
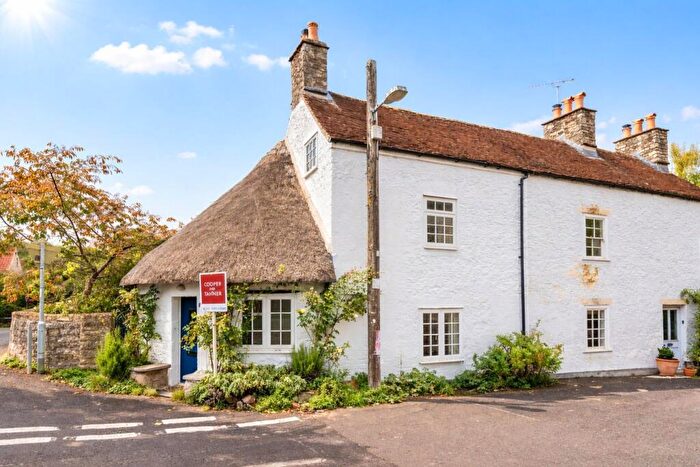
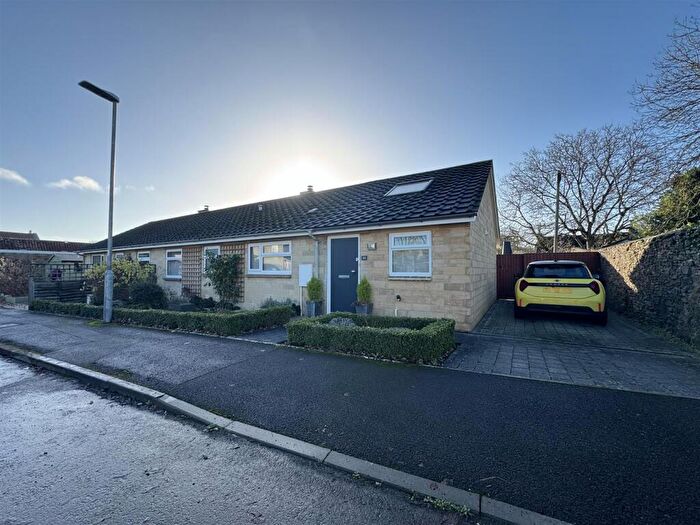
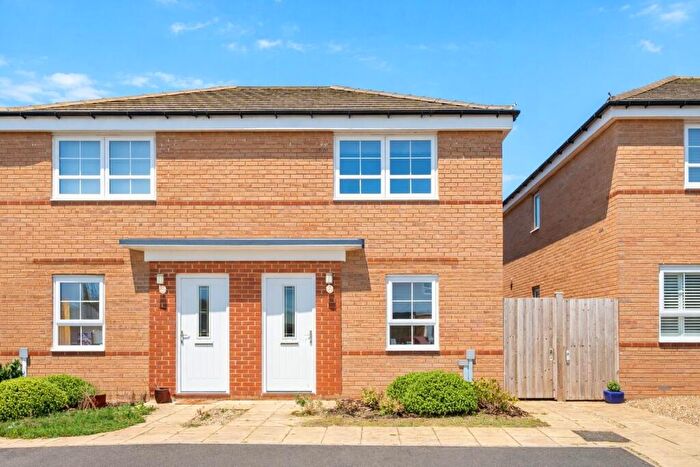
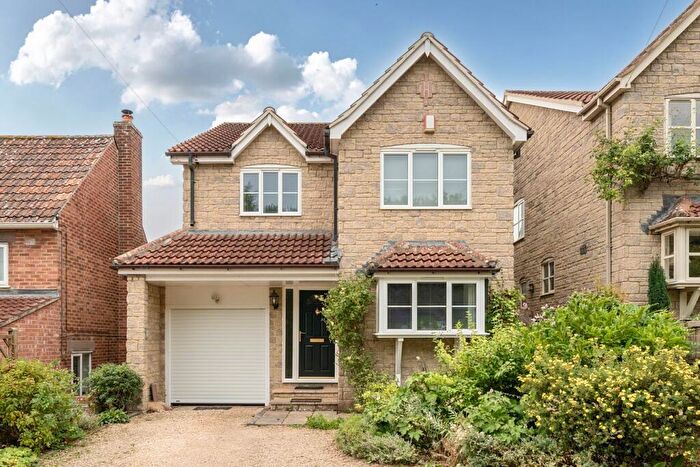
Previously listed properties in Cranmore, Doulting And Nunney
Roads and Postcodes in Cranmore, Doulting And Nunney
Navigate through our locations to find the location of your next house in Cranmore, Doulting And Nunney, Frome for sale or to rent.
| Streets | Postcodes |
|---|---|
| Berry Hill | BA11 4NR |
| Black Lane | BA11 3LQ |
| Bullen Mead | BA11 3LG |
| Bulls Green | BA11 3LY |
| Castle Green | BA11 4NH |
| Castle Hill | BA11 4NL |
| Castle Street | BA11 4NJ |
| Catch Road | BA11 4NE |
| Church Street | BA11 4LW |
| Dallimore Lane | BA11 4NA |
| Flowerfield | BA11 4NF |
| Frome Road | BA11 4LG BA11 4LN |
| Glebelands | BA11 4NQ |
| Green Pits Lane | BA11 4NW |
| High Street | BA11 4LZ BA11 4NB |
| Holwell | BA11 4PZ BA11 4PU |
| Horn Street | BA11 4NP |
| Leigh Road | BA11 3LP |
| Market Place | BA11 4LY |
| Mells Lane | BA11 3LW |
| Pookfield Close | BA11 4AU |
| Ridgeway | BA11 4NT |
| Ridgeway Lane | BA11 4NS BA11 4PD |
| Russells Barton | BA11 4LX |
| Stoney Lane | BA11 3LH |
| Sunnyhill | BA11 4ND |
| Upper Flowerfield | BA11 4NG |
| Westover | BA11 4NN |
| BA11 3JP BA11 3JR BA11 3JU BA11 3JX BA11 3LA BA11 3LB BA11 3LJ BA11 3LL BA11 3LN BA11 4LQ BA11 4NY BA11 5DD BA11 3JY BA11 3LE BA11 3LS BA11 4LL BA11 4NZ |
Transport near Cranmore, Doulting And Nunney
-
Frome Station
-
Bruton Station
-
Dilton Marsh Station
-
Westbury Station
-
Warminster Station
-
Freshford Station
-
Avoncliff Station
-
Castle Cary Station
- FAQ
- Price Paid By Year
- Property Type Price
Frequently asked questions about Cranmore, Doulting And Nunney
What is the average price for a property for sale in Cranmore, Doulting And Nunney?
The average price for a property for sale in Cranmore, Doulting And Nunney is £443,877. This amount is 19% higher than the average price in Frome. There are 163 property listings for sale in Cranmore, Doulting And Nunney.
What streets have the most expensive properties for sale in Cranmore, Doulting And Nunney?
The streets with the most expensive properties for sale in Cranmore, Doulting And Nunney are Horn Street at an average of £782,963, Frome Road at an average of £587,500 and Mells Lane at an average of £565,000.
What streets have the most affordable properties for sale in Cranmore, Doulting And Nunney?
The streets with the most affordable properties for sale in Cranmore, Doulting And Nunney are Bullen Mead at an average of £205,000, Glebelands at an average of £250,400 and Dallimore Lane at an average of £255,000.
Which train stations are available in or near Cranmore, Doulting And Nunney?
Some of the train stations available in or near Cranmore, Doulting And Nunney are Frome, Bruton and Dilton Marsh.
Property Price Paid in Cranmore, Doulting And Nunney by Year
The average sold property price by year was:
| Year | Average Sold Price | Price Change |
Sold Properties
|
|---|---|---|---|
| 2025 | £437,946 | 24% |
19 Properties |
| 2024 | £331,187 | -58% |
8 Properties |
| 2023 | £521,892 | 10% |
13 Properties |
| 2022 | £469,192 | -4% |
13 Properties |
| 2021 | £487,023 | -16% |
21 Properties |
| 2020 | £566,500 | 25% |
24 Properties |
| 2019 | £425,192 | 9% |
13 Properties |
| 2018 | £384,843 | -16% |
16 Properties |
| 2017 | £445,552 | 19% |
19 Properties |
| 2016 | £358,791 | 19% |
12 Properties |
| 2015 | £291,222 | -31% |
18 Properties |
| 2014 | £381,000 | 31% |
16 Properties |
| 2013 | £263,847 | 5% |
22 Properties |
| 2012 | £249,368 | -51% |
8 Properties |
| 2011 | £377,384 | 29% |
13 Properties |
| 2010 | £269,788 | -20% |
9 Properties |
| 2009 | £322,700 | 37% |
5 Properties |
| 2008 | £202,693 | -99% |
11 Properties |
| 2007 | £403,743 | 36% |
8 Properties |
| 2006 | £257,769 | -9% |
21 Properties |
| 2005 | £280,166 | 25% |
9 Properties |
| 2004 | £211,493 | -17% |
16 Properties |
| 2003 | £246,617 | 36% |
20 Properties |
| 2002 | £158,184 | 18% |
23 Properties |
| 2001 | £129,149 | 3% |
20 Properties |
| 2000 | £124,725 | 28% |
21 Properties |
| 1999 | £89,304 | -6% |
21 Properties |
| 1998 | £94,607 | 17% |
20 Properties |
| 1997 | £78,704 | -1% |
24 Properties |
| 1996 | £79,707 | 7% |
13 Properties |
| 1995 | £74,160 | - |
10 Properties |
Property Price per Property Type in Cranmore, Doulting And Nunney
Here you can find historic sold price data in order to help with your property search.
The average Property Paid Price for specific property types in the last three years are:
| Property Type | Average Sold Price | Sold Properties |
|---|---|---|
| Semi Detached House | £353,123.00 | 21 Semi Detached Houses |
| Detached House | £733,575.00 | 9 Detached Houses |
| Terraced House | £398,611.00 | 9 Terraced Houses |
| Flat | £149,800.00 | 1 Flat |

